
Animation and VFX studios deal with complex work — multiple projects, tight deadlines, high production costs, and endless revision cycles. Managing all of this manually quickly becomes overwhelming. That’s exactly why the Animation & VFX Dashboard in Excel is the perfect solution for creative studios, freelancers, and production houses. It transforms raw project data into clear visuals, interactive insights, and real-time performance summaries.
This Excel dashboard is designed to help you monitor revenue, profit margins, production costs, project progress, revisions, and software performance all in one place. From studio-level analysis to monthly financial trends, this dashboard gives you everything you need to make informed, confident, and fast decisions.
If you manage 2D animation, 3D modeling, VFX compositing, rigging, lighting, motion graphics, or editing workflows — this dashboard provides the clarity your studio needs to stay profitable and efficient.
📦 What’s Inside the Animation & VFX Dashboard in Excel
The dashboard includes five powerful analytical pages and two support sheets. Every page has slicers that let you filter the data by department, studio, client type, software tool, project status, or month.
⭐ 1. Overview Page – Your Complete Studio Summary
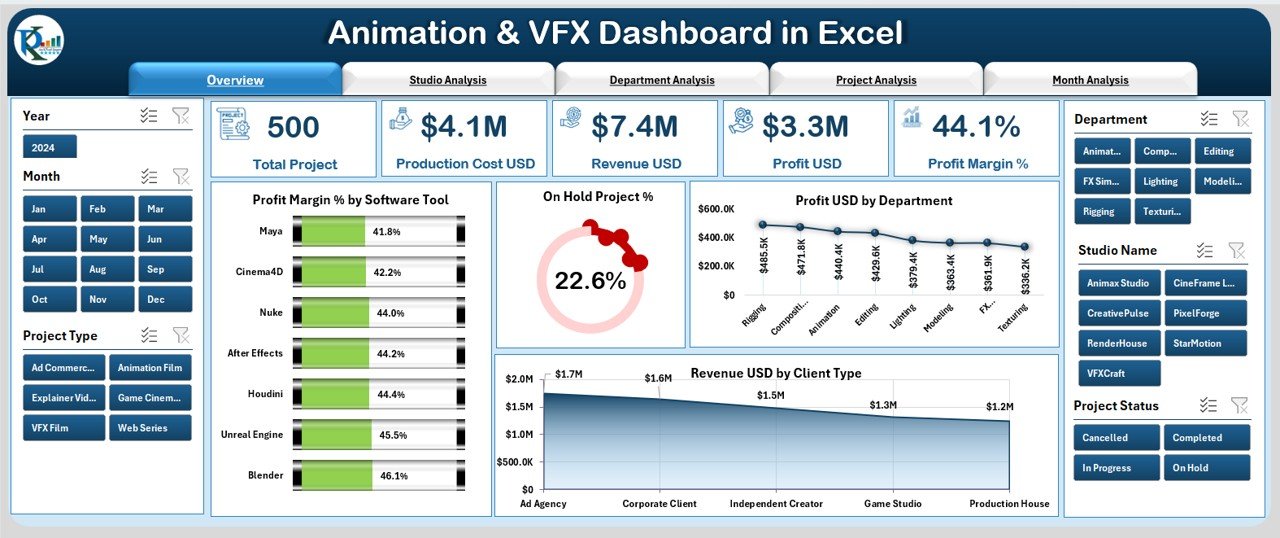
The Overview Page gives you a quick snapshot of how your studio is performing.
It includes:
-
Page navigator
-
Data slicer
-
5 summary KPI cards
-
4 key charts
Charts on this page:
-
Profit Margin % by Software Tool
-
On Hold Project %
-
Profit (USD) by Department
-
Revenue (USD) by Client Type
This page helps you identify which software tools generate more profit, which departments perform better, and which client categories bring the most revenue.
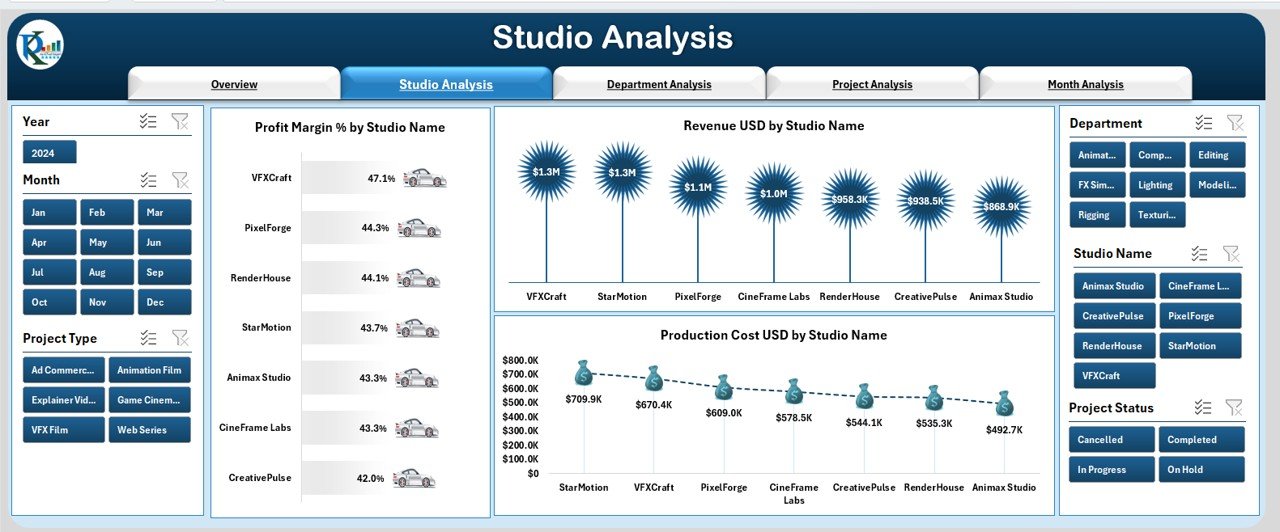
⭐ 2. Studio Analysis Page – Compare Studio Performance Instantly
For studios with multiple branches or freelancers working remotely, this page is extremely useful.
Charts on this page:
-
Profit Margin % by Studio Name
-
Revenue (USD) by Studio Name
-
Production Cost (USD) by Studio Name
You can immediately spot which studio performs better, which one has high production cost, and which location generates the most profit.
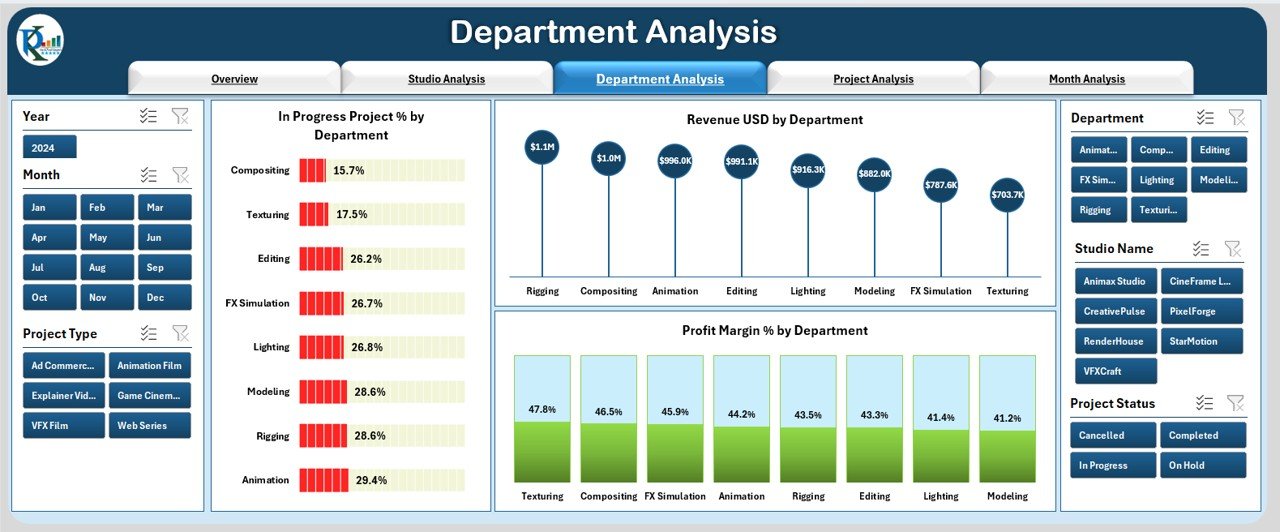
⭐ 3. Department Analysis Page – Understand Every Creative Department
Animation and VFX pipelines depend on multiple teams — modeling, rigging, animation, lighting, compositing, and editing.
This page helps you track:
-
In-Progress Project % by Department
-
Revenue (USD) by Department
-
Profit Margin % by Department
This page helps you identify strengths and weaknesses across departments, helping managers allocate resources more efficiently.
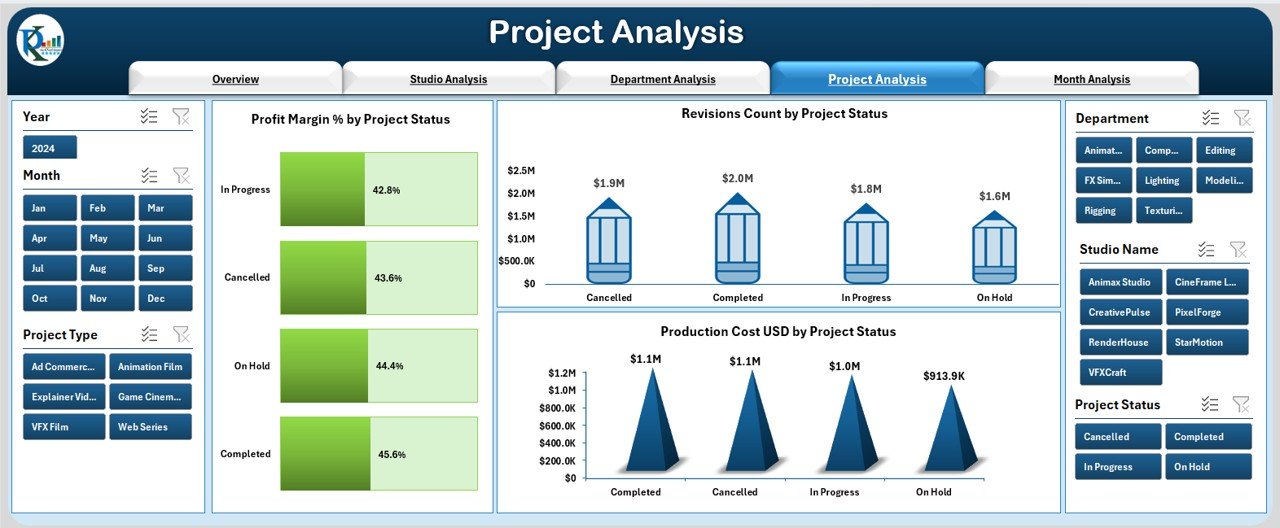
⭐ 4. Project Analysis Page – Track Project Health in Seconds
Project delays, revisions, and cost overruns affect profitability. This page highlights those issues clearly.
Charts on this page:
-
Profit Margin % by Project Status
-
Revision Count by Project Status
-
Production Cost (USD) by Project Status
You can instantly see which projects need attention, which have too many revisions, and which statuses impact your revenue.
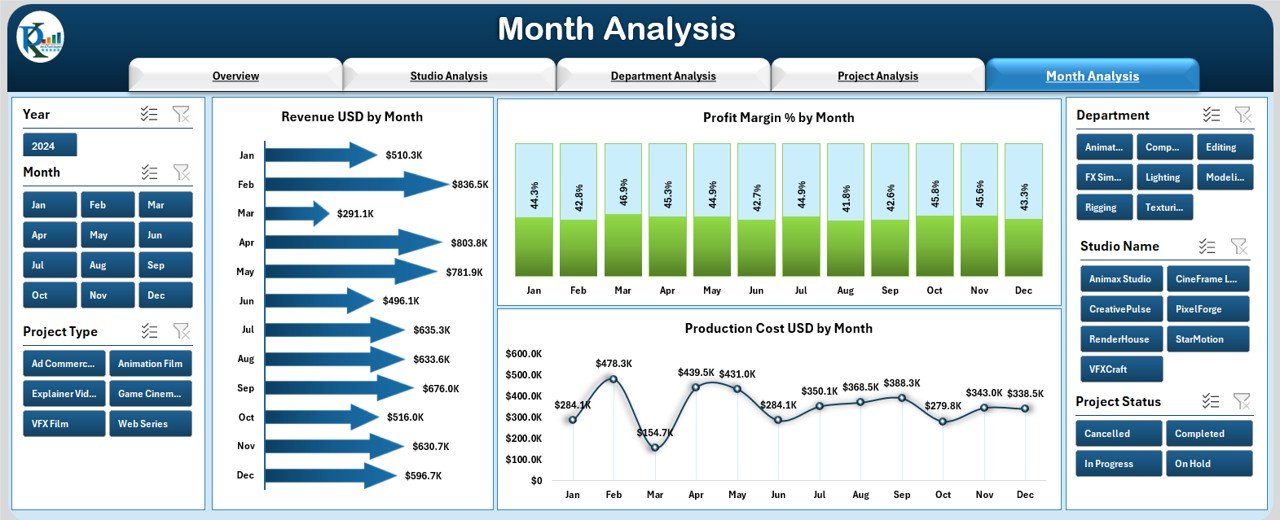
⭐ 5. Month Analysis Page – Track Monthly Patterns and Trends
Studios experience ups and downs every month based on incoming projects and staffing.
Charts on this page:
-
Revenue (USD) by Month
-
Project Margin % by Month
-
Production Cost (USD) by Month
This page helps you forecast revenue, plan resource allocation, and identify high-performing months.
⭐ Support Sheets Included:
Support Sheet: Stores master data such as software tools, departments, studios, project status, and client types.
Data Sheet: Your main data entry sheet — update it and the entire dashboard refreshes automatically.
🛠️ How to Use the Animation & VFX Dashboard in Excel
This dashboard is beginner-friendly and requires no advanced technical skills.
Follow these simple steps:
➡️ Update your project, revenue, cost, and revision data in the Data Sheet
➡️ Choose your slicers such as department, month, or studio
➡️ Analyze charts and KPIs instantly
➡️ Compare profit margins across tools, clients, or departments
➡️ Export visuals anytime for presentations
➡️ Customize the dashboard if needed
Since everything is Excel-based, updates take just minutes.
👥 Who Can Benefit from This Animation & VFX Dashboard in Excel
🎯 Animation & VFX Studios
Track profit margins, revisions, and production cost easily.
🎯 Freelancers & Small Agencies
Get business clarity without expensive software.
🎯 Large Creative Production Houses
Compare studios, departments, and monthly performance.
🎯 Project Managers & Producers
Monitor project status and reduce delays.
🎯 Finance & Operations Teams
Track production cost, revenue streams, and profitability.
🎯 CG Artists, Editors & Compositors
Understand how your team contributes to the overall performance.
Whether you run a small creative team or a large multi-studio operation, this dashboard helps you stay organized and profitable.
### 📘 Click here to read the Detailed Blog Post
### 📺 Visit our YouTube channel to learn step-by-step video tutorials:
👉 Youtube.com/@PKAnExcelExpert


Reviews
There are no reviews yet.