Efficient project monitoring is key to success in the construction industry. The Construction KPI Scorecard in Google Sheets is a ready-to-use, interactive tool designed to track and analyze performance across multiple project metrics—helping construction managers, site supervisors, and stakeholders make data-driven decisions.
This scorecard brings all your key performance indicators (KPIs) into one dynamic and visual Google Sheets dashboard. It provides Month-to-Date (MTD) and Year-to-Date (YTD) insights, highlighting areas of success and identifying where corrective actions are needed.
Whether you’re managing a single project or multiple construction sites, this tool helps ensure timely delivery, budget control, safety compliance, and resource optimization — all within an easy-to-use, cloud-based environment.
🔑 Key Features of the Construction KPI Scorecard in Google Sheets
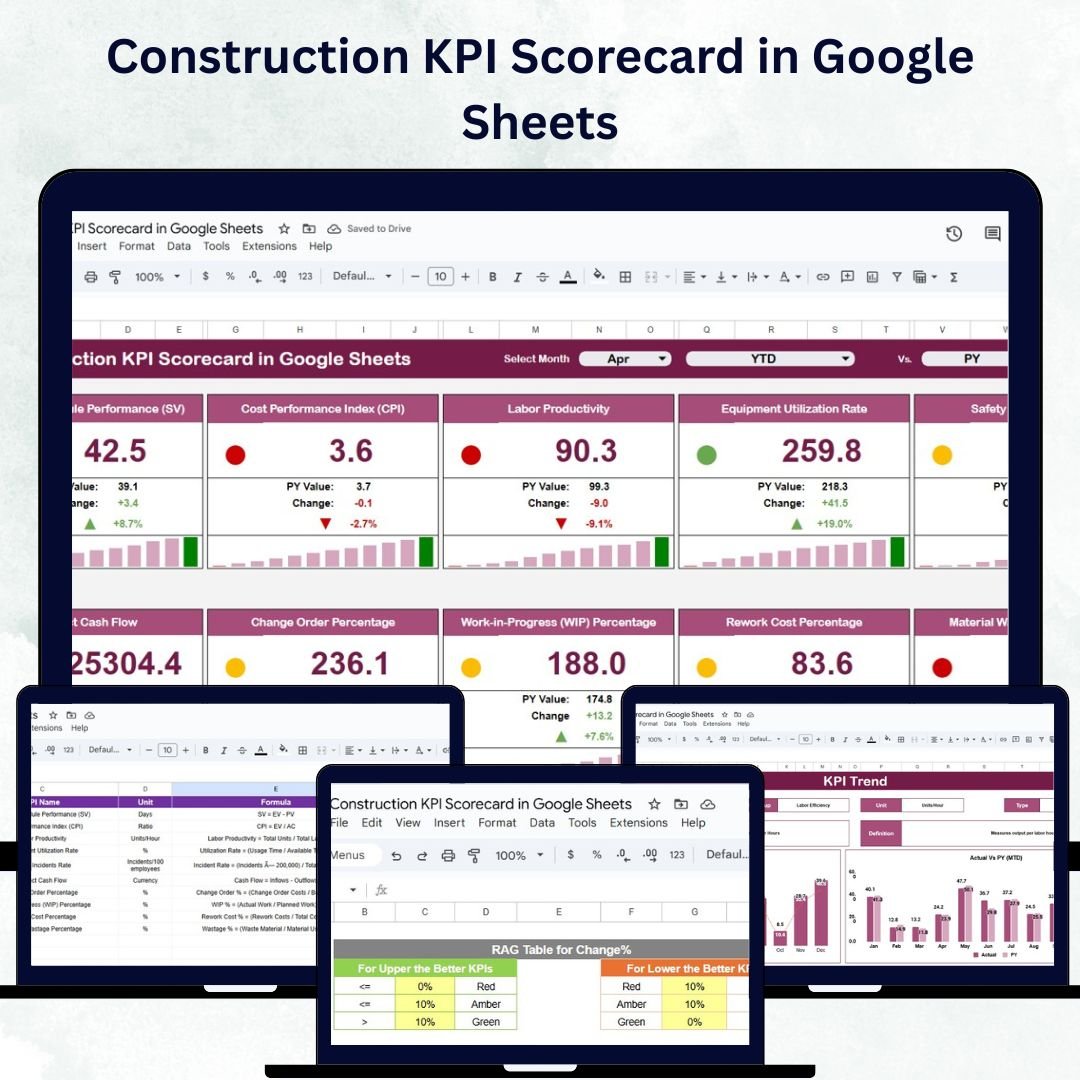
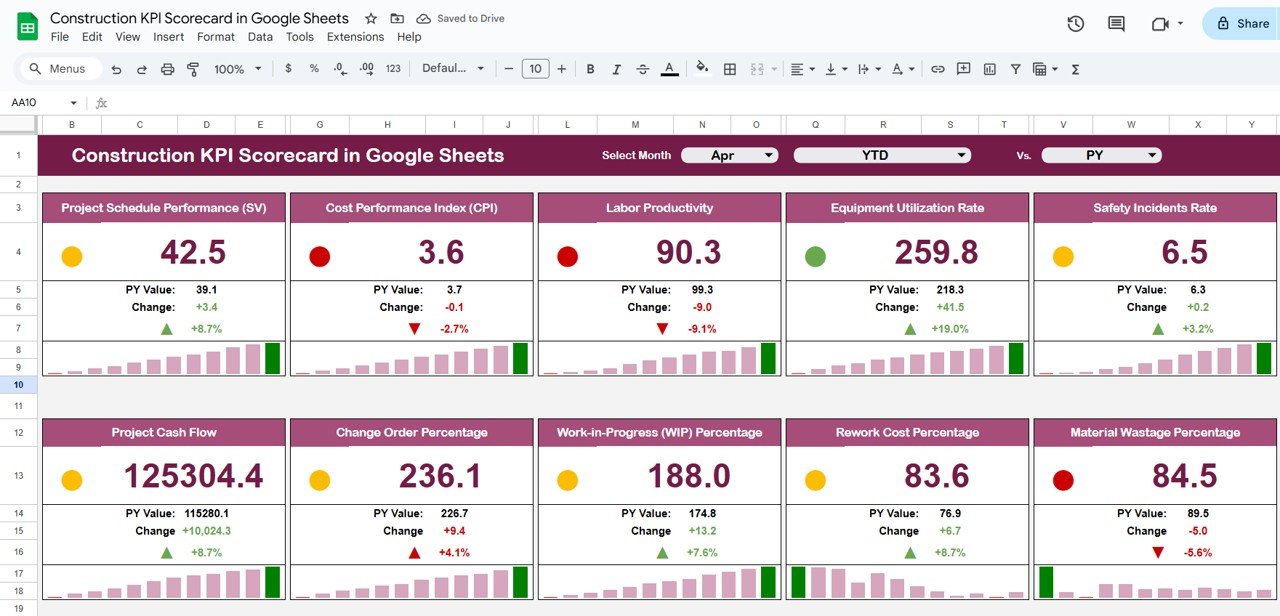
📊 Scorecard Sheet Tab
The main dashboard gives a visual overview of all construction KPIs with real-time updates and intuitive visuals.
Highlights Include:
-
🗓️ Month Selection Dropdown: Automatically updates all dashboard data for the selected month.
-
📅 MTD & YTD Toggle: Instantly switch between monthly and annual performance views.
-
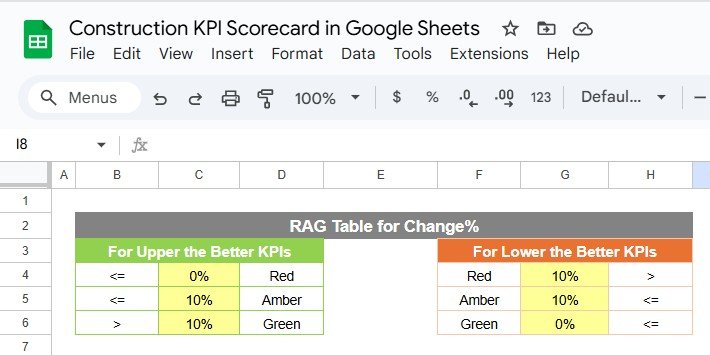
🚦 Traffic Lights and Arrows: Color-coded indicators for quick status checks on KPIs.
-
📈 Performance Cards: Display 10 key KPIs with Actual, Target, and Previous Year comparisons.
This sheet gives managers a one-glance summary of project health and progress.
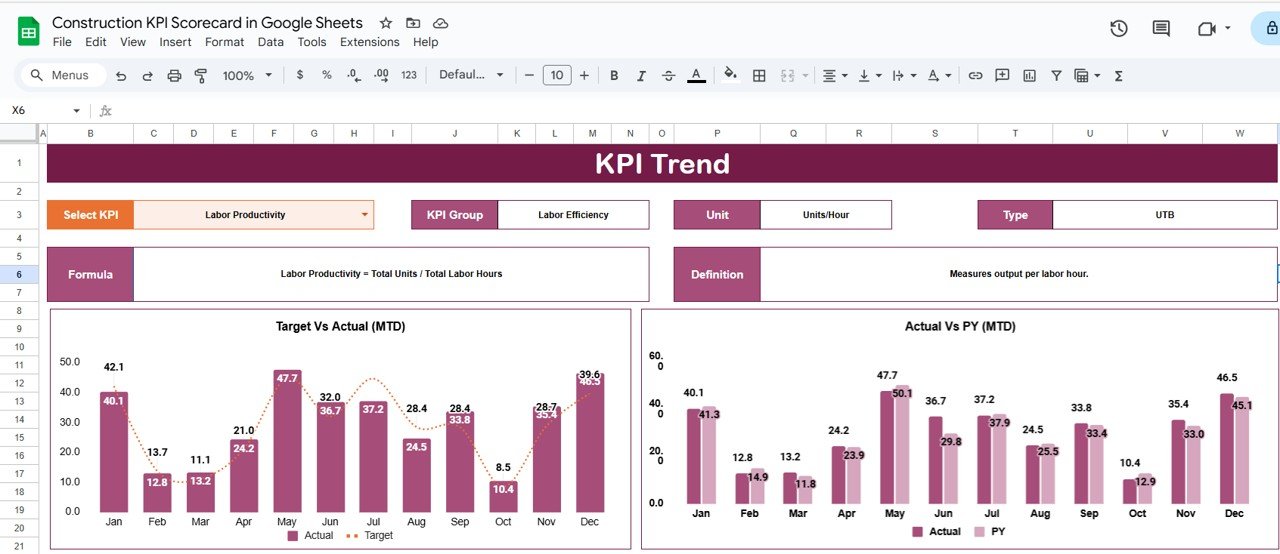
📈 Trend Sheet Tab
Dive deeper into individual KPIs with historical trends and detailed insights.
-
Select KPI from a dropdown (Range C3)
-
View KPI Group, Unit, Type (UTB/LTB), and Formula
-
Visual charts highlight monthly and yearly performance trends
This helps managers spot patterns, identify bottlenecks, and take timely actions.
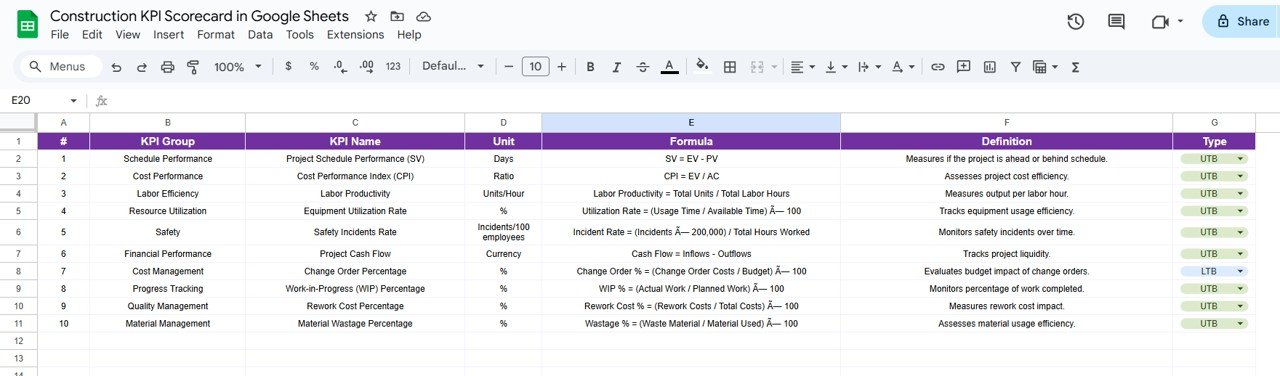
📘 KPI Definition Sheet Tab
A structured reference for all your KPIs.
-
Document KPI Name, Group, Unit, Formula, and Definition
-
Specify KPI Type (Upper-the-Better or Lower-the-Better)
This ensures clarity and consistency across all reporting and analysis.
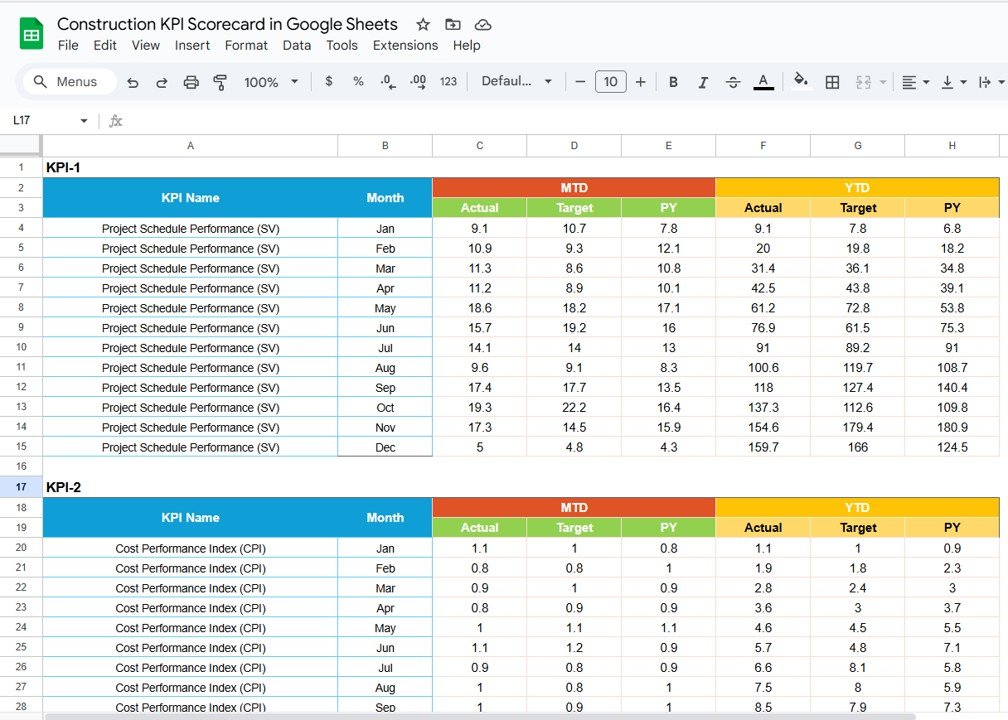
🧾 Data Input Sheet Tab
Centralized data entry for all performance metrics.
-
Input monthly and yearly KPI data
-
Automatic calculations reflect instantly in the dashboard and trend charts
This keeps your reporting real-time and accurate.
🎨 Color Settings Tab
Fully customizable visuals for the dashboard.
-
Adjust color codes for performance levels
-
Define traffic light thresholds and arrow settings
This helps make the dashboard intuitive and brand-aligned.
🧠 Advantages of Using the Construction KPI Scorecard
✅ Centralized Performance Tracking: Monitor project metrics in one unified dashboard.
📈 Real-Time Insights: Automatically updates as soon as data changes.
🚦 Visual Performance Indicators: Instantly identify KPIs that are on track or lagging.
📊 Trend Analysis: Monitor month-to-month and year-over-year trends.
💡 Data-Driven Decisions: Identify underperforming areas quickly and take corrective measures.
⚙️ Fully Customizable: Add KPIs, adjust colors, or modify formulas based on project needs.
👥 Collaborative: Share and edit data with multiple users simultaneously through Google Sheets.
This scorecard transforms traditional reporting into a dynamic, visual, and strategic performance tool.
💡 Best Practices for Using the Scorecard
-
Update Regularly: Keep monthly and yearly data current for accurate reporting.
-
Focus on Key Metrics: Prioritize high-impact KPIs like safety, cost, and timeline adherence.
-
Analyze Trends: Use the Trend Sheet to detect recurring issues or seasonal variations.
-
Use Visual Cues: Traffic lights and arrows help highlight urgent issues.
-
Record Changes: Maintain update logs for transparency and accountability.
🧩 Examples of KPIs to Track
Some of the most valuable KPIs for construction teams include:
-
🏗️ Project Completion Rate (%): Measures milestone achievement.
-
💰 Budget Utilization ($): Tracks actual vs. planned expenditure.
-
🦺 Safety Incidents (#): Measures compliance and safety performance.
-
👷 Labor Productivity (Hours/Unit): Assesses workforce efficiency.
-
🧱 Quality Compliance (%): Tracks adherence to standards.
-
🚜 Equipment Utilization (%): Monitors machinery performance.
-
⏰ On-Time Task Completion (%): Evaluates schedule reliability.
Each KPI includes Unit, Formula, and Type (UTB/LTB) for accurate performance measurement.
🏗️ How This Scorecard Helps Construction Managers
-
Monitor Performance Efficiently: Centralized KPI tracking for all projects.
-
Detect Issues Early: Spot potential delays, overruns, or safety gaps.
-
Support Accountability: Assign KPIs to departments or teams.
-
Improve Resource Allocation: Track labor, materials, and costs effectively.
-
Enhance Decision-Making: Provide visual, data-driven insights to stakeholders.
With this scorecard, managers can transform complex construction metrics into actionable insights — ensuring on-time, safe, and cost-effective project delivery.
🔗 Click here to read the Detailed blog post
Watch the step-by-step video Demo:


Reviews
There are no reviews yet.