

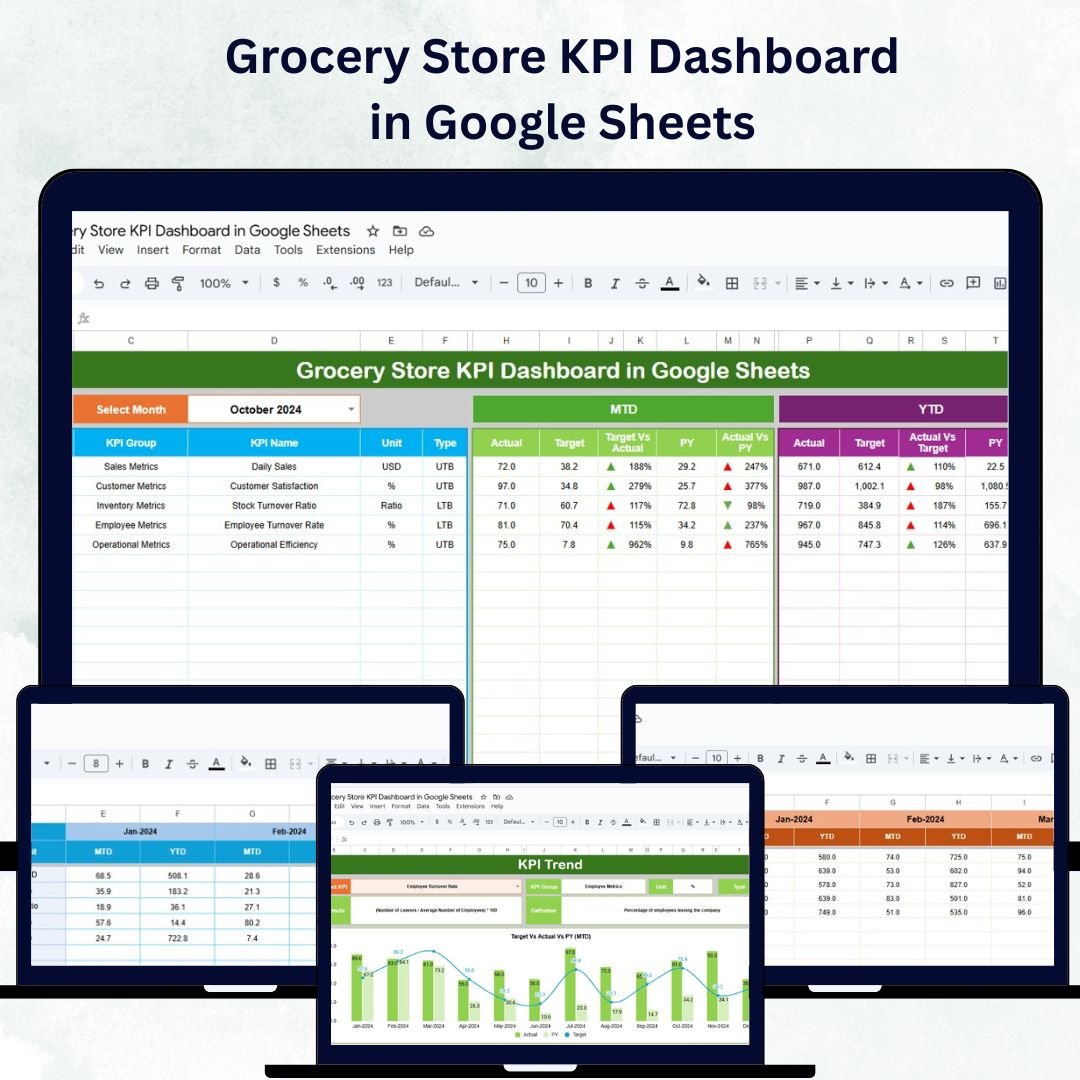



Running a grocery store efficiently requires constant tracking of performance across sales, inventory, and customer engagement. The Grocery Store KPI Dashboard in Google Sheets is a ready-to-use, interactive tool designed to help store managers, owners, and analysts monitor key metrics and make data-driven decisions — all in one place.
Built entirely in Google Sheets, this dashboard automates performance tracking and provides visual insights into store operations, helping you enhance productivity, profitability, and customer satisfaction. 🌟
🔑 Key Features of the Grocery Store KPI Dashboard in Google Sheets
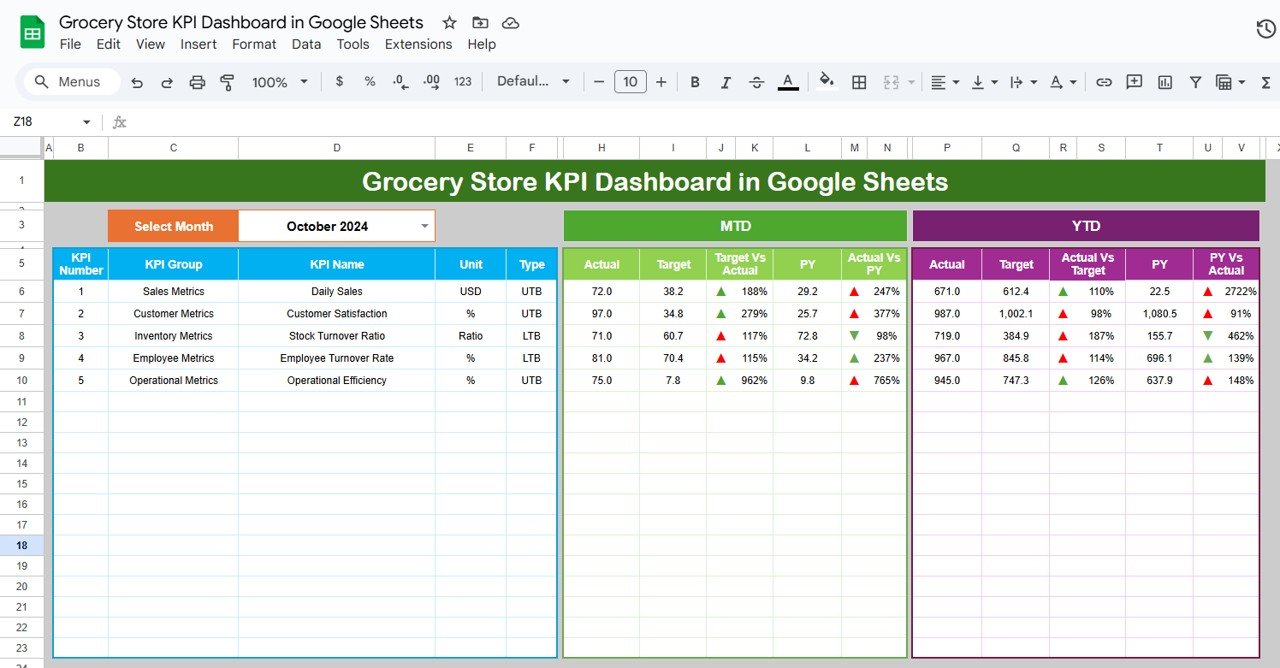
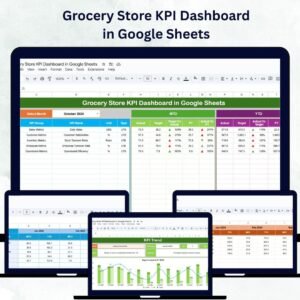
📊 Dashboard Sheet Tab
Get a complete overview of your store’s performance with dynamic visuals and real-time insights:
Month Selection (Range D3): Updates all KPIs for the chosen month
MTD Metrics: Displays Month-to-Date Actual, Target, and Previous Year data
YTD Metrics: Tracks Year-to-Date performance with conditional formatting
Visual Indicators: Arrows and color codes highlight trends and target achievement
This sheet acts as the control center for quick analysis of sales, operations, and inventory health.
📈 KPI Trend Sheet Tab
Dive deeper into KPI trends over time:
Select a KPI from the dropdown (Range C3)
Displays KPI Group, Unit, and Type (Upper-the-Better or Lower-the-Better)
Shows formulas and definitions for clarity
Visualizes monthly MTD and YTD trends
This tab helps identify seasonal trends, bottlenecks, and growth opportunities.
🧾 Actual Numbers Sheet Tab
Input your performance data for MTD and YTD metrics:
Update the first month (Range E1) to adjust all calculations
Data automatically syncs with the dashboard and charts
Supports multi-department or category tracking
🎯 Target Sheet Tab
Set clear performance benchmarks for your store:
Define monthly and yearly targets
Compare actual vs. target to identify shortfalls or overperformance
Helps maintain accountability and goal alignment across teams
📉 Previous Year Numbers Sheet Tab
Understand your growth trajectory:
Input last year’s values for comparative analysis
Assess progress against previous performance
Recognize seasonal fluctuations and long-term trends
📘 KPI Definition Sheet Tab
Maintain clarity for all team members:
Document KPI Name, Group, Unit, Formula, Definition, and Type
Ensures everyone understands how performance is measured
Provides a standardized approach for all reporting
🛍️ Example KPIs Tracked in the Dashboard
The Grocery Store KPI Dashboard comes with a predefined list of performance metrics suitable for any retail setup:
Total Sales ($): Tracks revenue generated per period
Average Basket Value ($): Measures the average spend per transaction
Inventory Turnover Rate: Evaluates how fast stock is sold and replenished
Customer Footfall: Monitors total store visitors
Stock-Outs: Tracks instances when items are unavailable (Lower-the-Better)
Employee Performance Score: Assesses productivity and service quality
Sales per Category ($): Analyzes which product lines drive the most revenue
Each KPI includes:
Unit of Measurement (e.g., $, %, count)
Formula for Calculation
Performance Type (UTB/LTB)
🌟 Advantages of Using the Grocery Store KPI Dashboard
✅ Centralized Data Management: Track all store metrics in one Google Sheet
📈 Real-Time Insights: Charts and cards update automatically with new data
🧠 Trend Analysis: Compare MTD, YTD, and Year-over-Year performance
💡 Identify Opportunities: Spot underperforming categories and improve stock management
🛒 Customer-Centric Optimization: Use KPIs to enhance service quality and retention
👥 Collaborative Access: Multiple users can edit and view in real time
⚙️ Customizable: Add, modify, or remove KPIs easily based on store requirements
🧠 Best Practices for Using the Dashboard
Update Regularly: Input fresh data monthly or weekly for accurate tracking
Segment KPIs: Analyze performance by store section or product category
Leverage Conditional Formatting: Highlight top and low-performing areas
Monitor Inventory: Track stock-outs and turnover for supply optimization
Compare with Past Data: Identify growth patterns and recurring issues
Engage Teams: Share the dashboard with department leads for collaboration
🧾 How This Dashboard Helps Grocery Store Managers
Improve Decision-Making: Use KPIs to guide pricing, promotions, and inventory strategy
Boost Profit Margins: Track basket value and sales by category
Reduce Waste: Identify fast- and slow-moving products
Enhance Customer Experience: Monitor footfall and satisfaction trends
Optimize Workforce Performance: Evaluate team efficiency through HR-linked KPIs
With this tool, grocery stores can turn data into insights — driving smarter decisions, improved efficiency, and sustainable growth. 🚀
🔗 Click here to read the Detailed blog post
Watch the step-by-step video Demo:
🔗 Visit our YouTube channel to learn step-by-step video tutorials
Compatibility and Requirements
- Works in Google Sheets. You need a free Google account and a web browser.
- You pick the month from a dropdown on the Dashboard sheet and the KPI from a dropdown on the KPI Trend sheet. Google explains dropdowns in Create an in-cell dropdown list.
Frequently Asked Questions
Which sheets are included?
Five sheets: Dashboard, KPI Trend, Actual Numbers, Target, Previous Year Numbers and KPI Definition.
How do I update the dashboard?
Enter your MTD and YTD figures in the Actual Numbers sheet and your goals in the Target sheet. Then select a month in cell D3 of the Dashboard sheet and all KPIs update.
Which KPIs are tracked?
Total Sales, Average Basket Value, Inventory Turnover Rate, Customer Footfall, Stock-Outs, Employee Performance Score and Sales per Category. Each KPI has a unit, a formula and a type (Upper-the-Better or Lower-the-Better) on the KPI Definition sheet.
Can I compare this year with last year?
Yes. Add last year’s figures to the Previous Year Numbers sheet and the Dashboard shows them next to your actuals and targets.
Can I add or change KPIs?
Yes. You can add, modify or remove KPIs to fit your store.
Is there an Excel or Power BI version?
Yes. See the Grocery Store KPI Dashboard in Excel and the Grocery Store KPI Dashboard in Power BI.
Related Store Templates
- Grocery Store KPI Dashboard in Excel: the same KPIs in Excel
- Grocery Store KPI Dashboard in Power BI: the Power BI edition
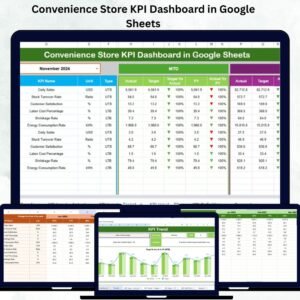
- Convenience Store KPI Dashboard in Google Sheets: a similar store dashboard in Google Sheets
- Inventory Management Template for Store: stock tracking for a store
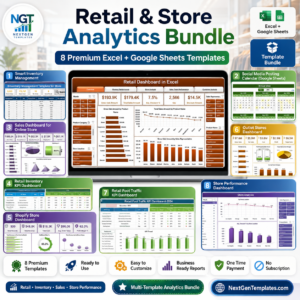
- Retail & Store Analytics Bundle: 8 templates for store analytics in one download
Browse all Google Sheets KPI dashboards.





Reviews
There are no reviews yet.