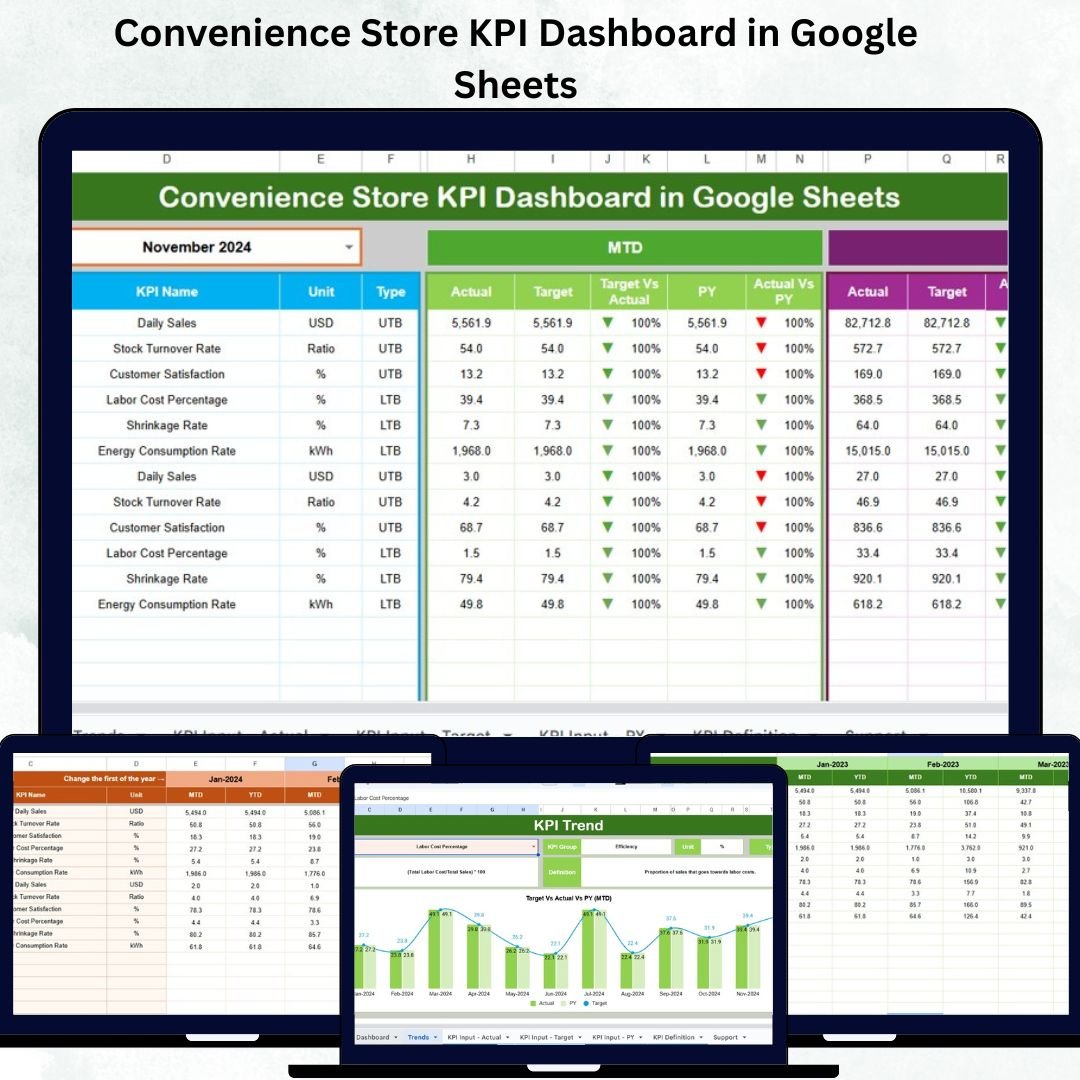
Running a convenience store means juggling multiple responsibilities — sales tracking, inventory management, profitability analysis, and customer satisfaction. 📊 Managing all these manually can be tough, but with the Convenience Store KPI Dashboard in Google Sheets, everything becomes organized, visual, and efficient.
This powerful dashboard helps you monitor real-time KPIs, compare them against targets, and make data-driven business decisions — all within a familiar, cloud-based Google Sheets environment. Let’s explore why this tool is a game changer for convenience store owners and retail managers.
⚡ Key Features of the Convenience Store KPI Dashboard in Google Sheets
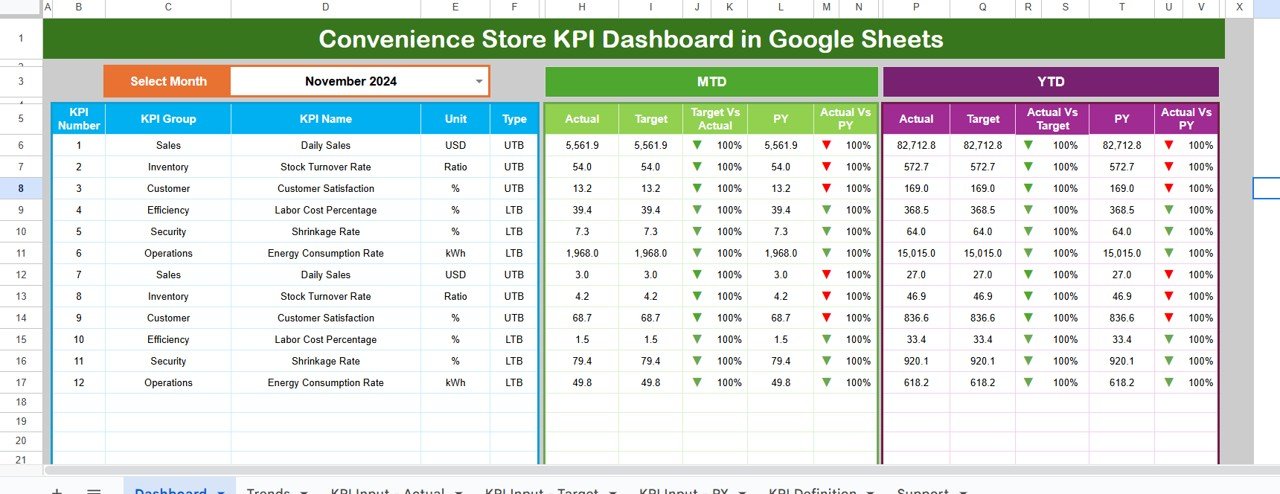
✨ 📈 Interactive Dashboard View – Monitor your store’s performance in one glance with MTD (Month-to-Date) and YTD (Year-to-Date) comparisons for every KPI.
✨ 🎯 Target vs Actual Comparison – Instantly identify whether your store is meeting, exceeding, or missing performance targets with smart visual indicators.
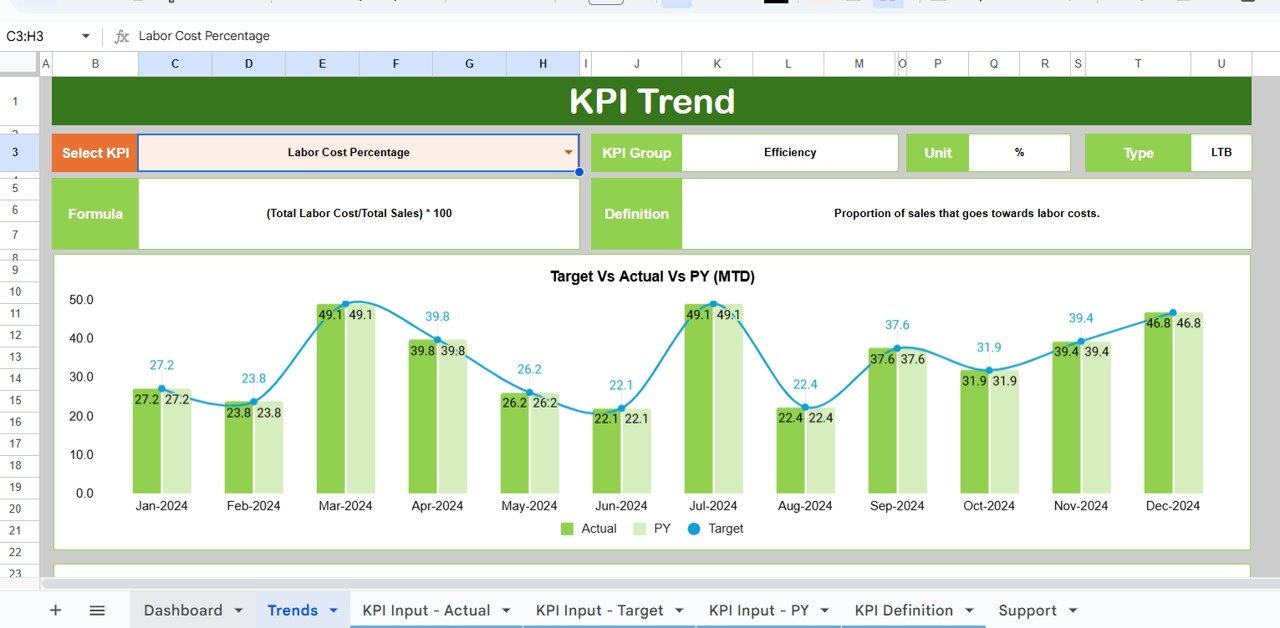
✨ 📊 Trend Analysis – Visualize performance trends using MTD and YTD charts for better forecasting and planning.
✨ 📅 Month Selection Drop-down – Select the month from the drop-down (cell D3) and watch all data update dynamically.
✨ 🧮 Data Automation – Update only once! The dashboard automatically refreshes KPIs, targets, and charts.
✨ 💬 Real-time Collaboration – Share the dashboard with your team to enable live updates and transparent performance tracking.
✨ 💰 Cost-Effective and Cloud-Based – Enjoy the benefits of analytics without investing in expensive BI tools or software licenses.
📂 What’s Inside the Convenience Store KPI Dashboard in Google Sheets
This dashboard includes six structured worksheets, each built to streamline performance tracking:
1️⃣ Dashboard Sheet – Your command center! Displays monthly summaries, MTD/YTD data, and comparison visuals.
2️⃣ Trend Sheet – View KPI trends over time with detailed charts and KPI-level details like Group, Unit, and Type.
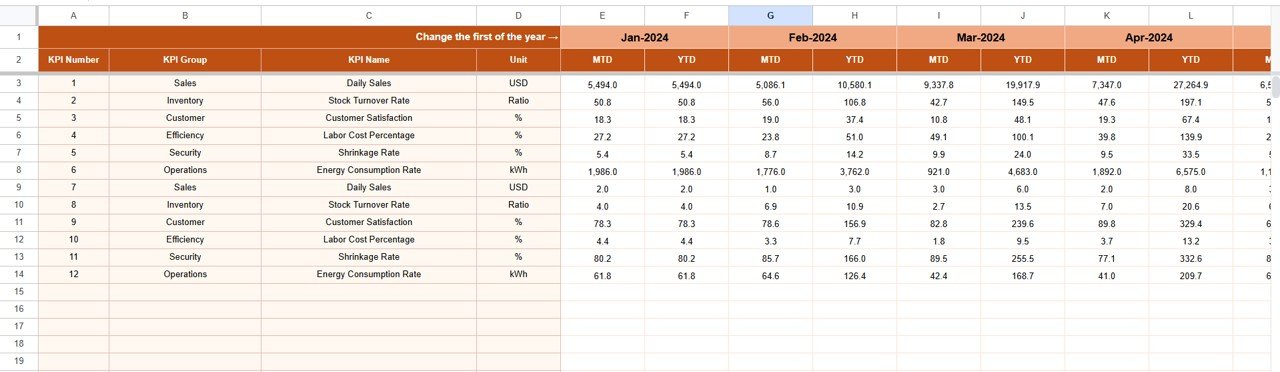
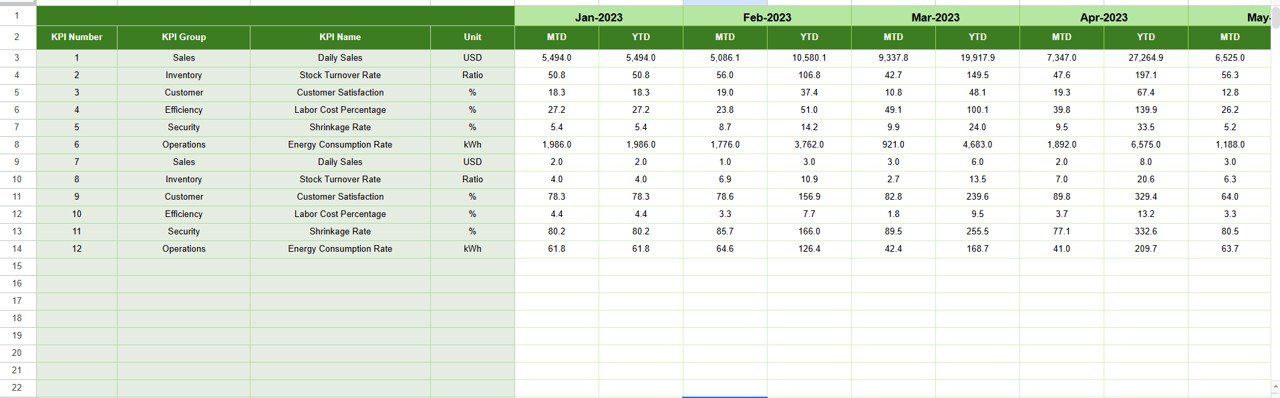
3️⃣ Actual Numbers Input Sheet – Log your store’s monthly and yearly performance data. The dashboard auto-updates!
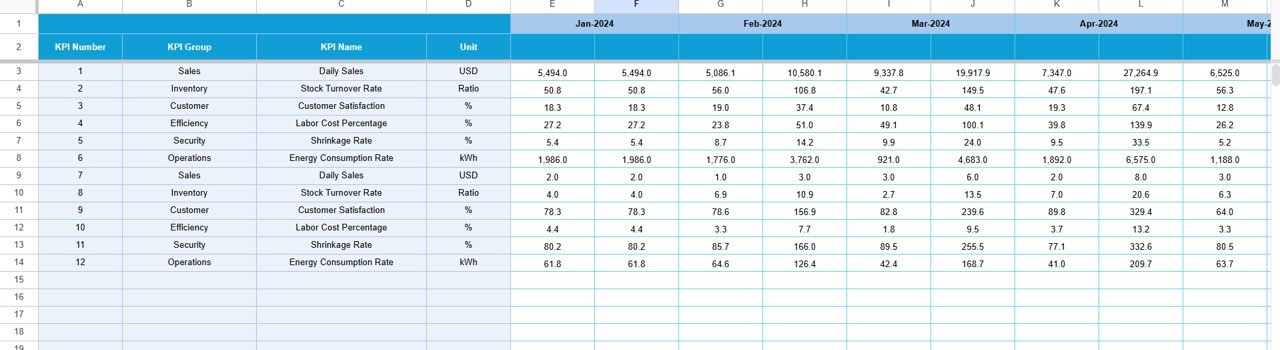
4️⃣ Target Sheet – Define and track monthly and yearly goals with conditional formatting for performance visualization.
5️⃣ Previous Year Numbers Sheet – Compare performance against the previous year to monitor growth and improvement.
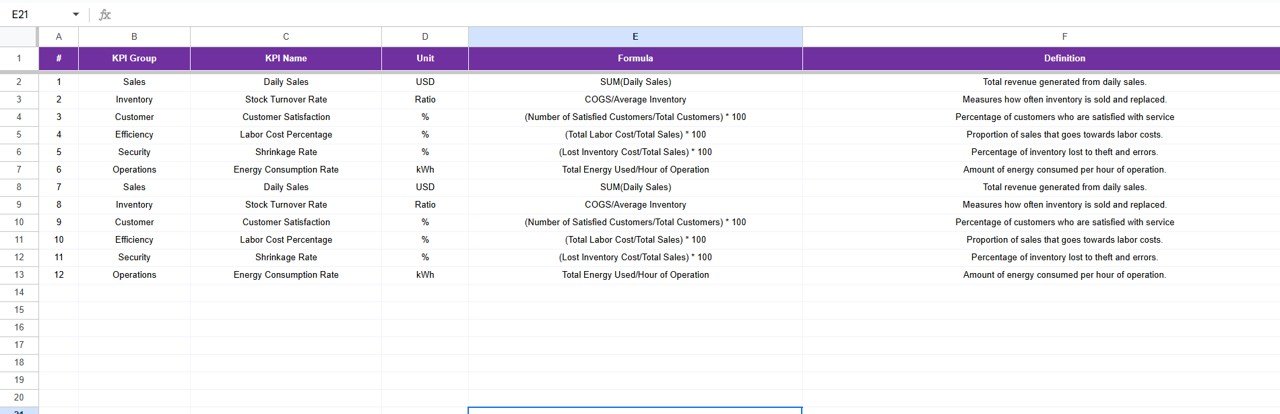
6️⃣ KPI Definition Sheet – Clearly defines each KPI’s formula, logic, and purpose for full transparency.
Every sheet has been thoughtfully designed to ensure ease of use, accuracy, and automation — allowing even beginners to manage store data effortlessly.
🧠 How to Use the Convenience Store KPI Dashboard in Google Sheets
✅ Step 1: Collect your store’s actual sales, inventory, and cost data.
✅ Step 2: Input MTD and YTD values in the Actual Numbers Input Sheet.
✅ Step 3: Set your targets in the Target Sheet for each KPI.
✅ Step 4: Choose the month in the Dashboard Sheet (D3) — all visuals and numbers will update automatically.
✅ Step 5: Review performance in the Trend Sheet to analyze patterns and act on underperforming KPIs.
💡 Pro Tip: Link your POS or accounting data using Google Apps Script to automate updates.
👥 Who Can Benefit from This Convenience Store KPI Dashboard in Google Sheets
👨💼 Store Owners – Track profitability, expenses, and product performance without complex tools.
👩💻 Retail Managers – Monitor sales teams, inventory levels, and footfall trends.
📊 Analysts & Accountants – Get clean, structured data for deeper analysis and reporting.
🏢 Franchise Operators – Consolidate data across multiple branches for a unified view.
🧾 Entrepreneurs – Perfect for those starting a retail or convenience store business to establish KPIs and performance benchmarks.
This dashboard is designed for everyone — whether you manage a single shop or a chain of stores, it delivers insights that drive results.


Reviews
There are no reviews yet.