


Seasonal sales can make or break business performance. Peak seasons bring high demand, tight inventory planning, aggressive marketing, and intense pressure on teams. At the same time, off-season periods require cost control, realistic forecasting, and smarter target setting. Unfortunately, many businesses still track seasonal sales using static reports or scattered spreadsheets, which leads to delayed insights and missed opportunities.
That is exactly why a Seasonal Sales KPI Dashboard in Google Sheets becomes an essential sales analytics and planning tool.
This ready-to-use dashboard helps businesses monitor seasonal sales trends, evaluate performance against targets, and compare current results with previous years. Instead of guessing whether sales are improving or declining, decision-makers get a clear, data-driven view of seasonal performance using structured KPIs, automated calculations, and visual indicators.
Because the dashboard is built in Google Sheets, it is easy to maintain, collaborative, and accessible—without requiring expensive BI software or technical expertise.
🚀 Key Features of the Seasonal Sales KPI Dashboard
📌 MTD & YTD Sales Performance Tracking
Track Month-to-Date and Year-to-Date performance for every seasonal KPI.
🎯 Target vs Actual Comparison
Instantly see whether sales are meeting, exceeding, or missing targets.
📊 Previous Year Benchmarking
Compare current season performance with last year to identify growth or decline.
📈 Visual Performance Indicators
Up and down arrows highlight improvement or decline instantly.
🔎 Detailed KPI Trend Analysis
Understand how each KPI behaves across months and seasons.
🤝 Real-Time Collaboration
Multiple users can update and review data in Google Sheets simultaneously.
📦 What’s Inside the Seasonal Sales KPI Dashboard
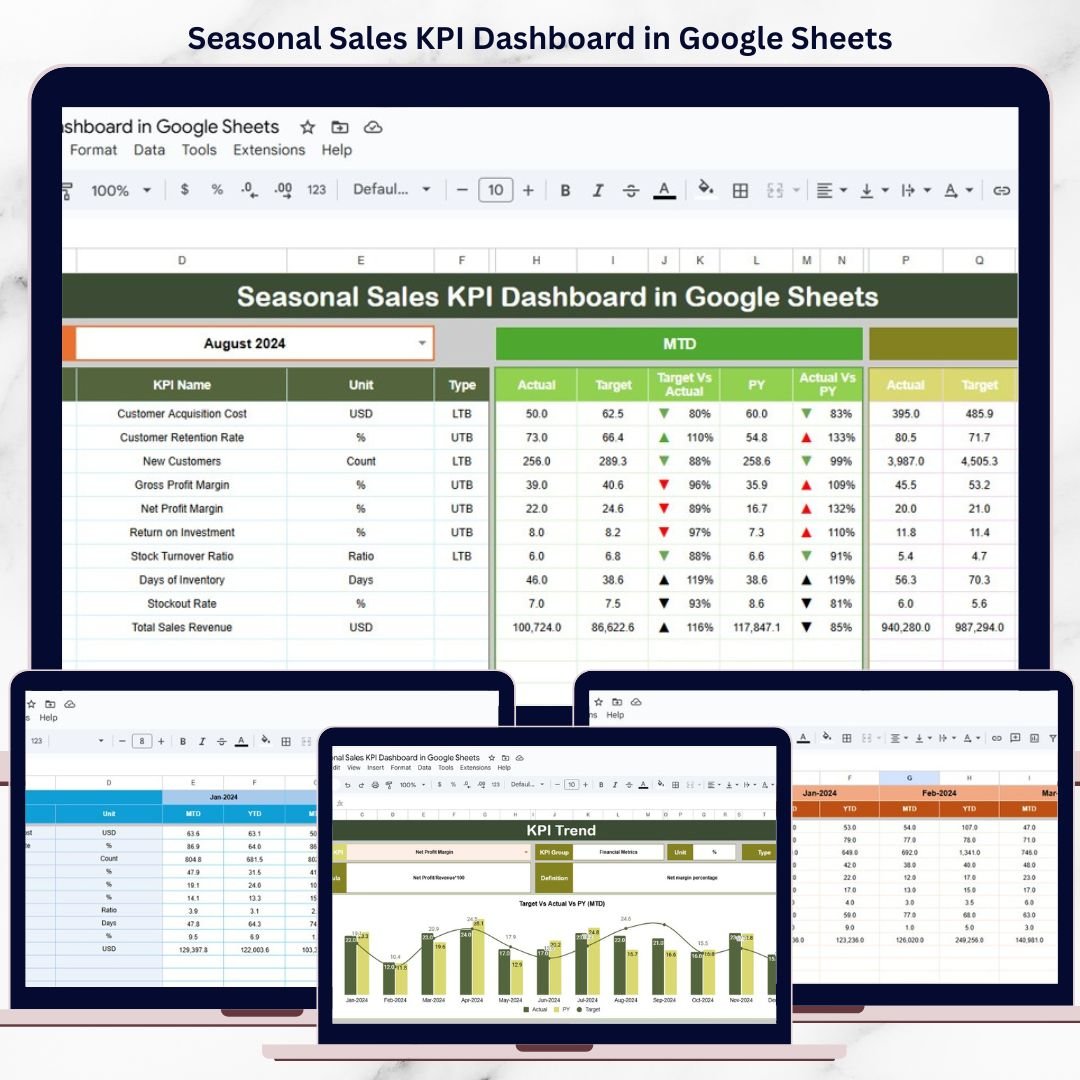
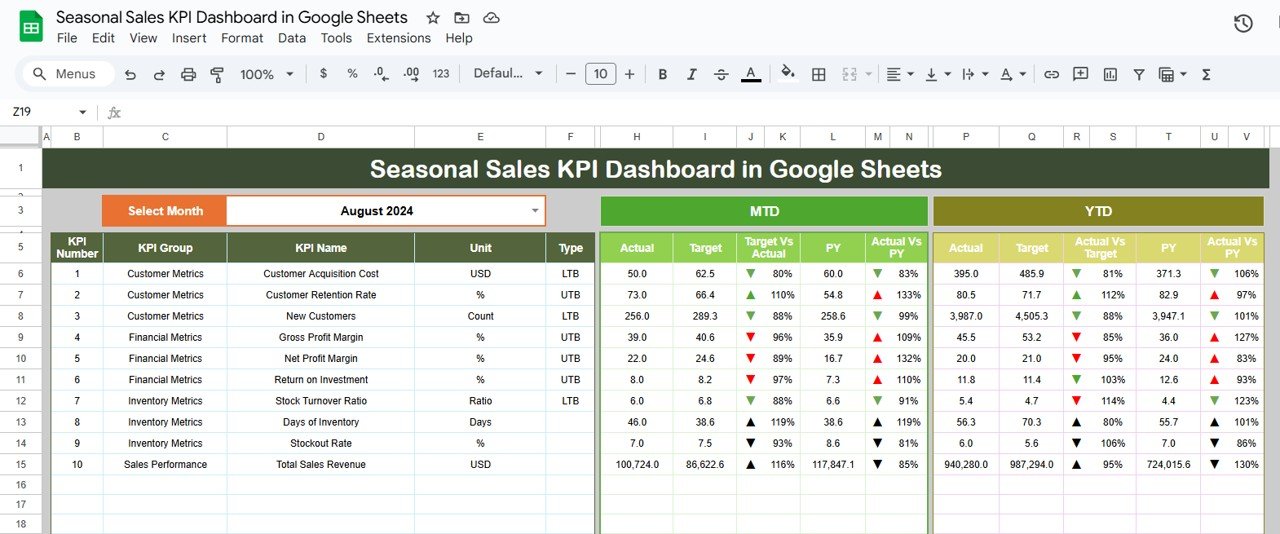
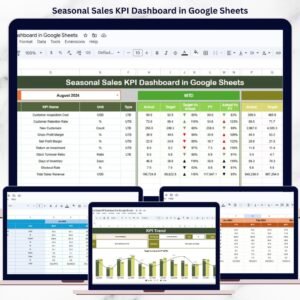
🧾 Dashboard Sheet Tab – Main KPI Overview
This is the executive summary of the dashboard.
📅 Month Selection
Select the month from Cell D3
All KPIs update automatically for the selected month
📊 MTD KPIs Displayed
For each KPI, the dashboard shows:
MTD Actual
MTD Target
MTD Previous Year
Target vs Actual (%)
Previous Year vs Actual (%)
Directional arrows instantly show whether performance has improved or declined.
📈 YTD KPIs Displayed
The dashboard also displays:
YTD Actual
YTD Target
YTD Previous Year
Target vs Actual (%)
Previous Year vs Actual (%)
This allows long-term seasonal performance evaluation.
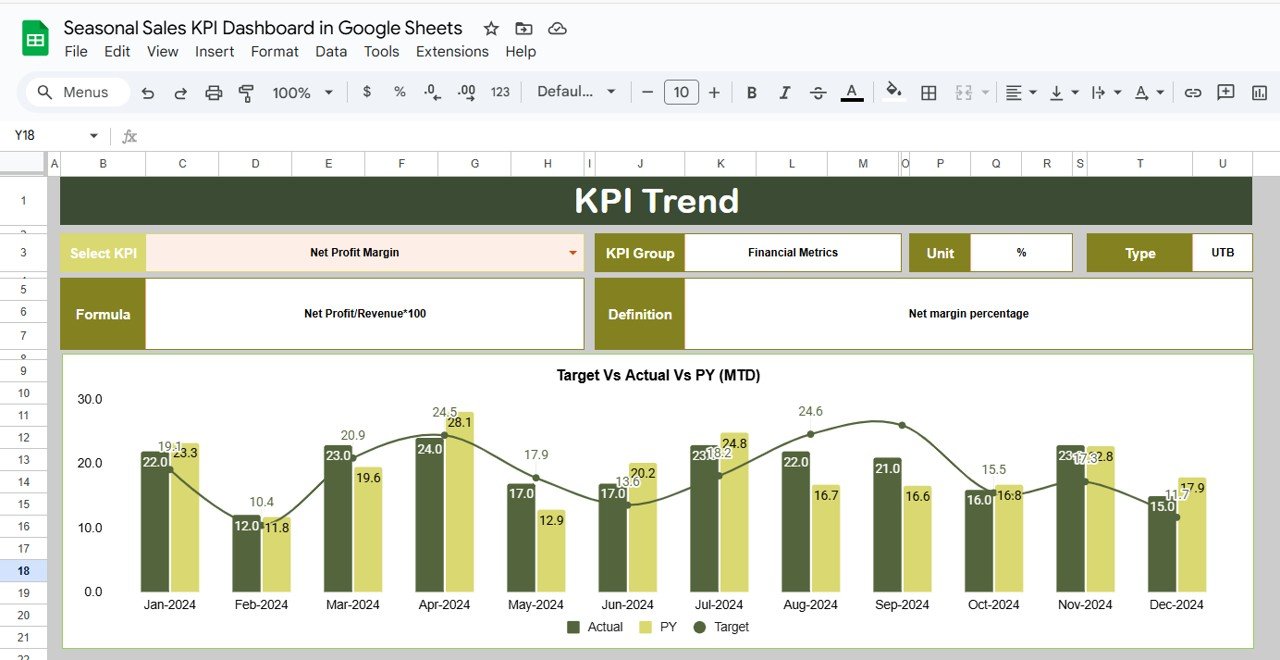
📉 KPI Trend Sheet – KPI Deep Dive
📌 How It Works
Select a KPI name from the dropdown in Cell C3
The sheet dynamically updates all KPI details
📋 KPI Information Displayed
KPI Group
KPI Unit
KPI Type (Upper the Better / Lower the Better)
KPI Formula
KPI Definition
This ensures complete clarity and consistent interpretation across teams.
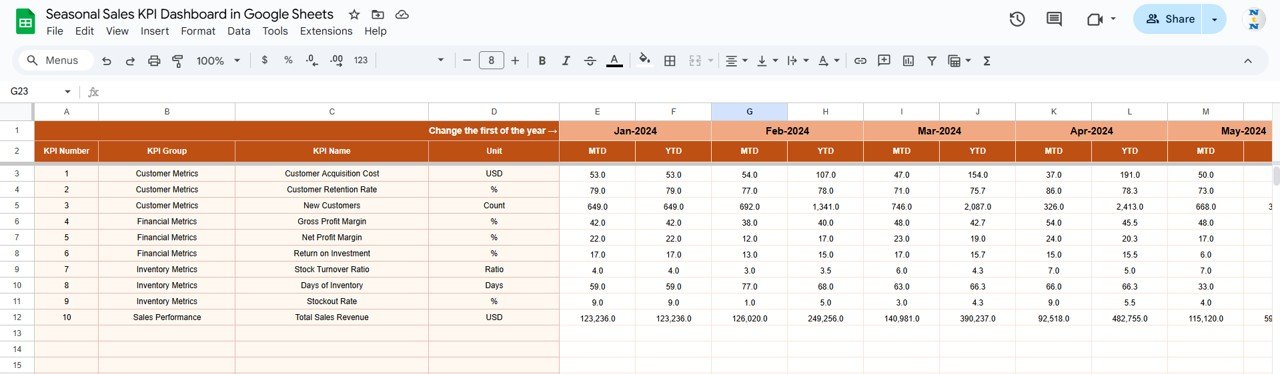
🧮 Actual Number Sheet Tab
This sheet captures real sales performance data.
🛠️ How to Use
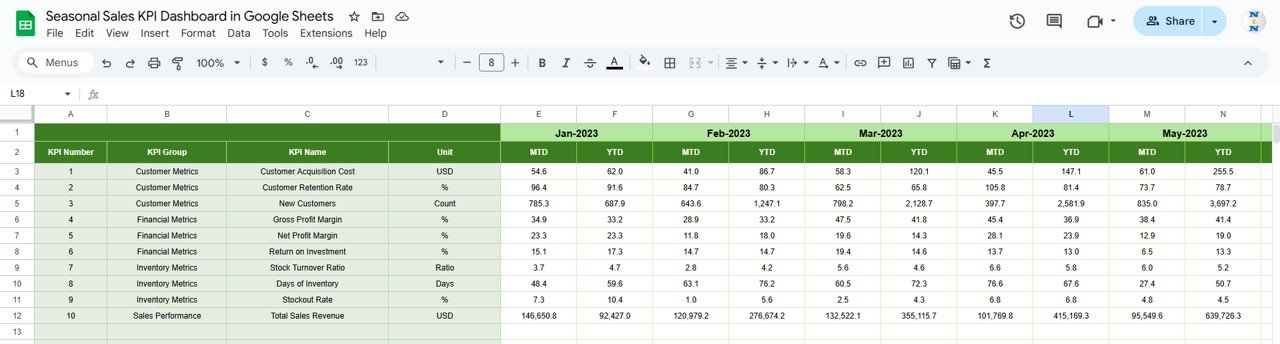
Select the first month of the year in Cell E1
Enter MTD Actual and YTD Actual values
All dashboard calculations update automatically
This structure eliminates manual errors and maintains consistency.
🎯 Target Sheet Tab
The Target Sheet defines expected seasonal sales performance.
✍️ What to Enter
Monthly MTD Target values
Cumulative YTD Target values
Targets help businesses evaluate performance objectively and plan proactively.
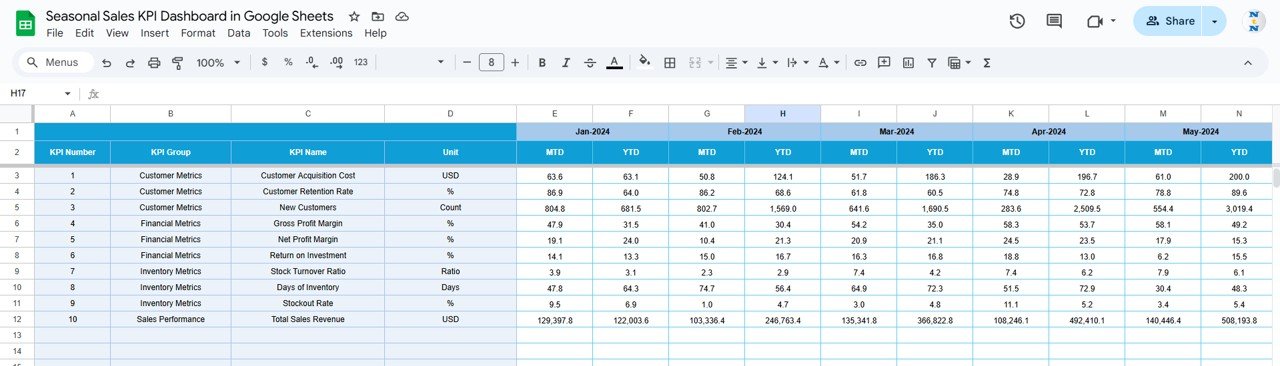
📆 Previous Year Number Sheet Tab
Historical comparison strengthens seasonal analysis.
📊 Purpose
Enter previous year MTD and YTD values
Identify recurring seasonal patterns
Measure growth, stagnation, or decline
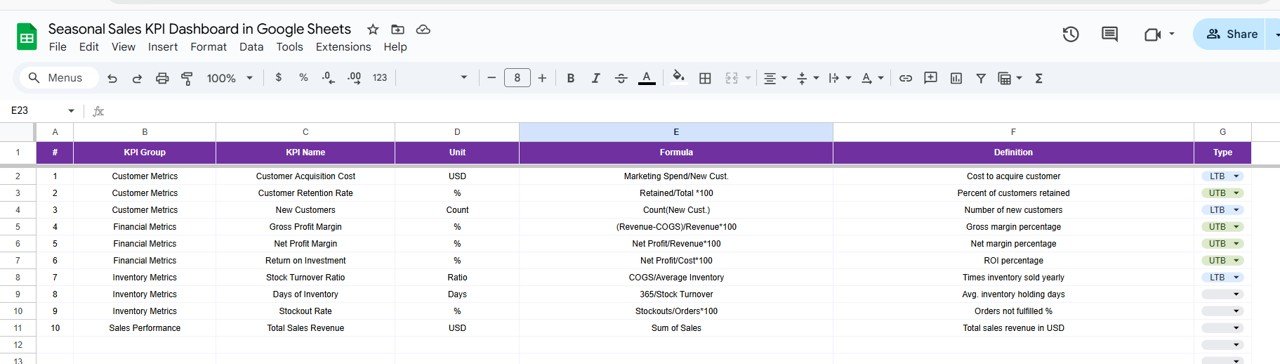
📚 KPI Definition Sheet Tab
This sheet acts as the KPI master reference.
🧾 Fields Included
KPI Name
KPI Group
Unit
Formula
KPI Definition
KPI Type
It ensures transparency and standardization across all stakeholders.
🎯 Who Can Benefit from This Seasonal Sales Dashboard
🛒 Retail & E-commerce Businesses
📦 Distribution & Wholesale Companies
📊 Sales Managers & Business Owners
📣 Marketing & Promotion Teams
📈 Operations & Inventory Planners
🛠️ How to Use the Seasonal Sales KPI Dashboard
Update sales data regularly
Review KPIs weekly during peak seasons
Compare Actual vs Target consistently
Monitor year-over-year seasonal trends
Align inventory, staffing, and promotions with insights
🔗 Click here to read the Detailed blog post
Watch the step-by-step video tutorial:
▶️ Visit our YouTube channel to learn step-by-step video tutorials
👉 Youtube.com/@NeotechNavigators
Compatibility and Requirements
- Works in Google Sheets. You need a free Google account and a web browser.
- You pick the month on the Dashboard sheet and the KPI on the KPI Trend sheet from dropdowns. Google explains dropdowns in Create an in-cell dropdown list.
Frequently Asked Questions
Which sheets are included?
Six sheets: Dashboard, KPI Trend, Actual Number, Target, Previous Year Number and KPI Definition.
How do I update the dashboard?
Select the first month of the year in cell E1 of the Actual Number sheet, then enter your MTD Actual and YTD Actual values. Add your MTD and YTD goals in the Target sheet. Then pick a month in cell D3 of the Dashboard sheet and all KPIs update.
Can I compare this season with last year?
Yes. Enter last year’s MTD and YTD values in the Previous Year Number sheet. The Dashboard shows them next to your actuals and targets, with a Previous Year vs Actual percentage.
How do I see the trend for one KPI?
Open the KPI Trend sheet and select a KPI name from the dropdown in cell C3. The sheet shows the KPI group, unit, type (Upper the Better or Lower the Better), formula and definition.
Is there an Excel or Power BI version?
Yes. See the Seasonal Sales KPI Dashboard in Excel and the Seasonal Sales KPI Dashboard in Power BI.
Related Sales Dashboard Templates
- Seasonal Sales KPI Dashboard in Excel: the same seasonal KPIs in Excel
- Seasonal Sales KPI Dashboard in Power BI: the Power BI edition
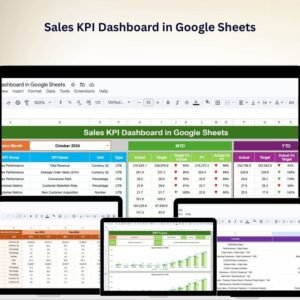
- Sales KPI Dashboard in Google Sheets: a general sales KPI view
- Sales Business Intelligence Dashboard in Google Sheets: a wider sales analysis dashboard
- Monthly Sales Tracker and Report in Google Sheets: a monthly sales log and report
Browse all Google Sheets KPI dashboards.

Reviews
There are no reviews yet.