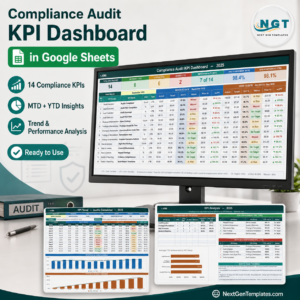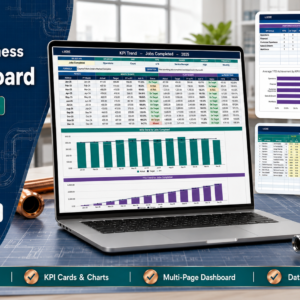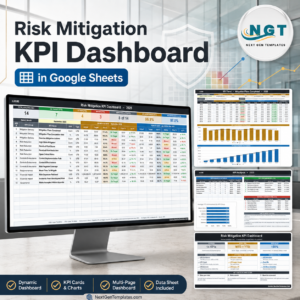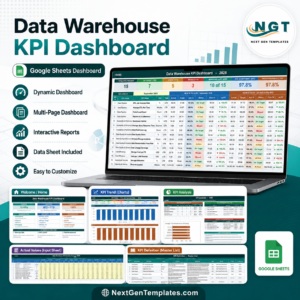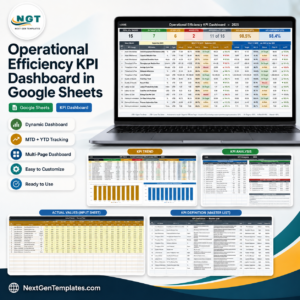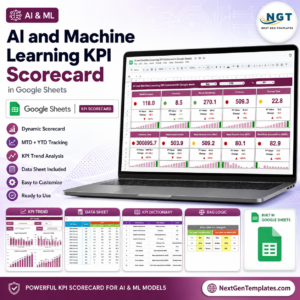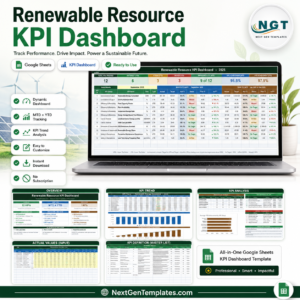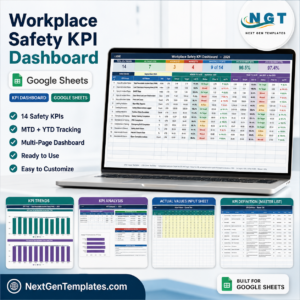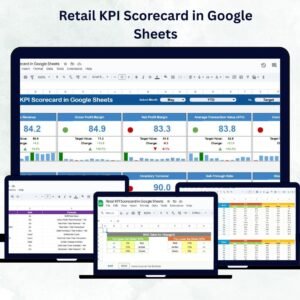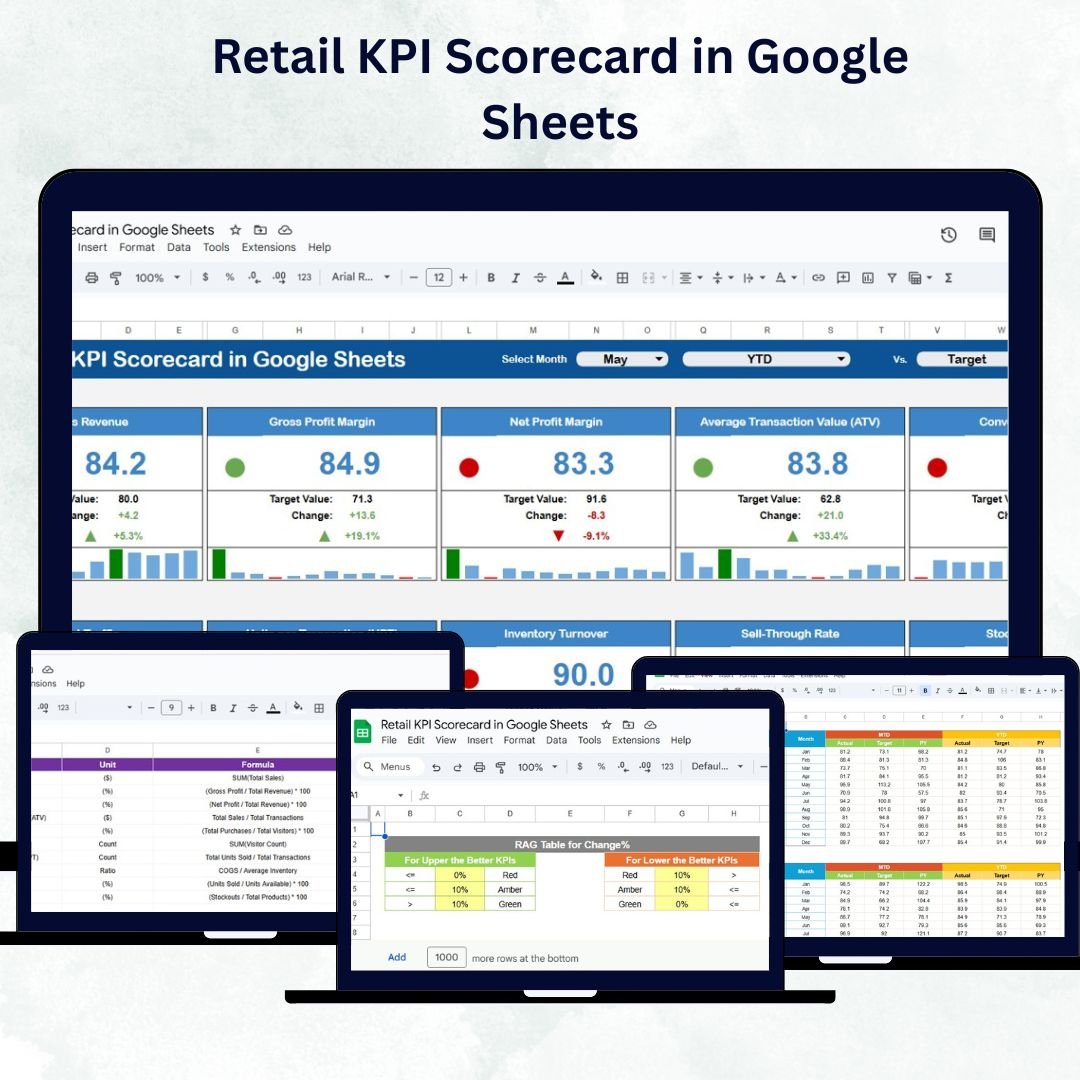
In the competitive world of retail, understanding your key performance indicators (KPIs) is essential for growth and profitability. The Retail KPI Scorecard in Google Sheets is a ready-to-use, automated, and interactive performance tracking tool that enables retailers to monitor sales, customer satisfaction, and operational efficiency — all in one centralized dashboard.
This scorecard helps you visualize trends, compare Month-to-Date (MTD) and Year-to-Date (YTD) performance, and evaluate progress against set targets with easy-to-read visuals. Designed for simplicity and clarity, it’s an indispensable tool for retail owners, managers, and finance teams who want to make data-driven decisions effortlessly.
🔑 Key Features of the Retail KPI Scorecard in Google Sheets
📊 Dashboard Sheet Tab
Your all-in-one control panel for retail performance.
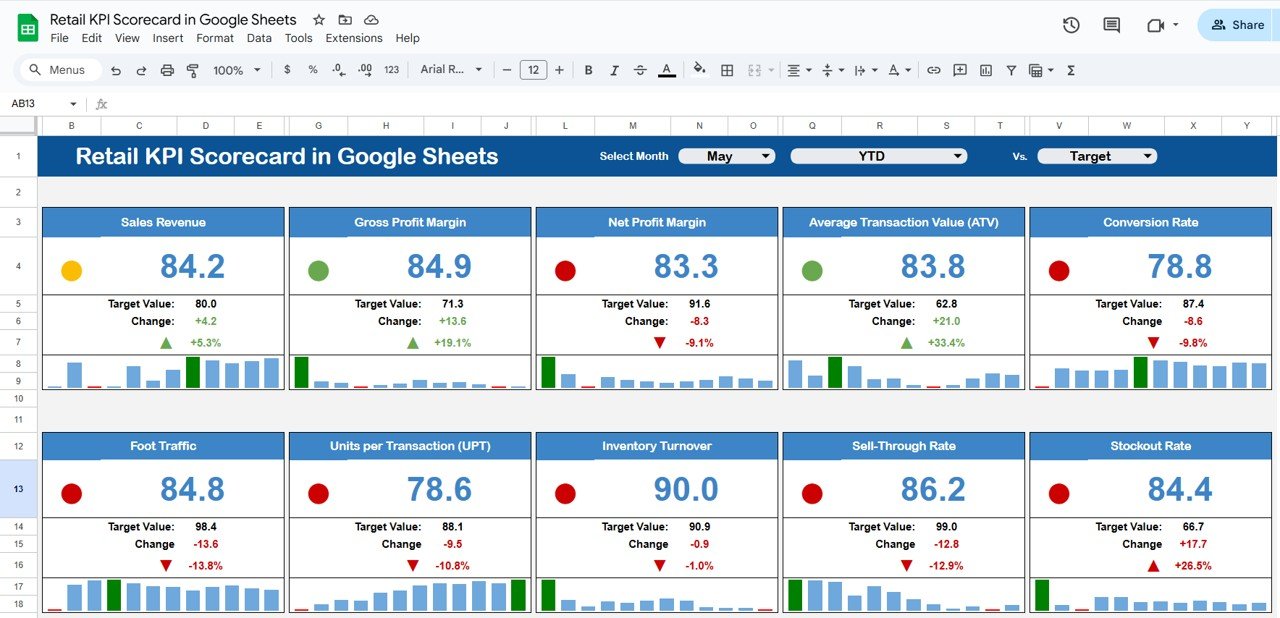
Interactive Month Dropdown (Cell D3): Instantly switch between months to view live updates.
MTD vs. YTD Comparison: Track short-term and long-term performance side by side.
Visual Indicators: Up/down arrows and color-coded lights (red, yellow, green) show trends at a glance.
Performance vs Target: See which KPIs have met, exceeded, or missed targets.
This sheet provides a real-time, visual snapshot of your retail performance.
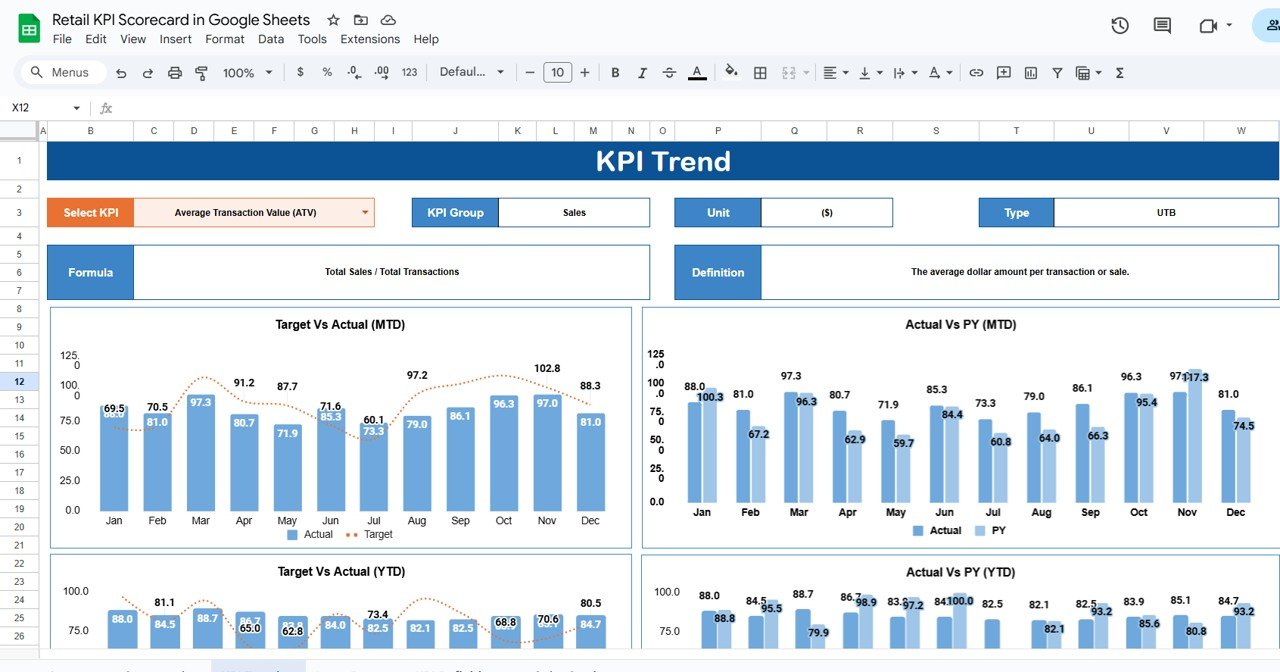
📈 Trend Sheet Tab
Dive deep into KPI analysis and discover performance patterns.
Select a KPI name from the dropdown (Cell C3).
Automatically displays KPI Group, Unit, Formula, and Type (UTB/LTB).
Generates trend charts to show monthly progress over time.
This allows you to monitor progress, seasonal effects, and improvement opportunities effortlessly.
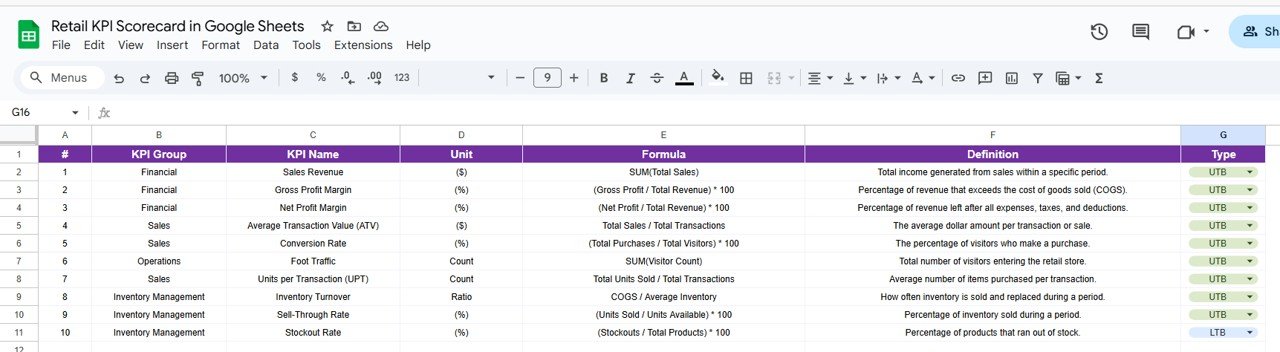
📖 KPI Definition Sheet Tab
Maintain clarity and standardization for all metrics.
Clearly define each KPI with Group, Unit, Formula, Definition, and Type (UTB/LTB).
Ensures consistency across reporting and communication.
Eliminates ambiguity in performance discussions.
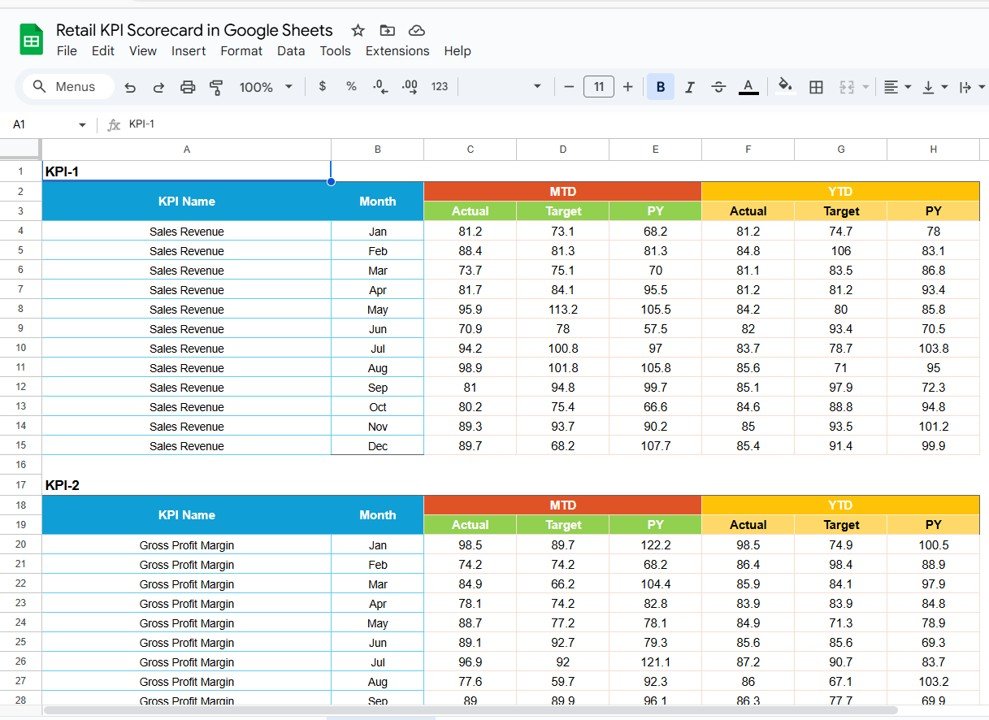
📅 Data Input Sheet Tab
The foundation of your scorecard — where all performance data lives.
Enter actual values, targets, and previous year data by month.
Automatically feeds into dashboard visuals and tables.
Keeps your entire team aligned with one accurate source of data.
🎨 Color Settings Sheet Tab
Personalize your dashboard’s visual look and feel.
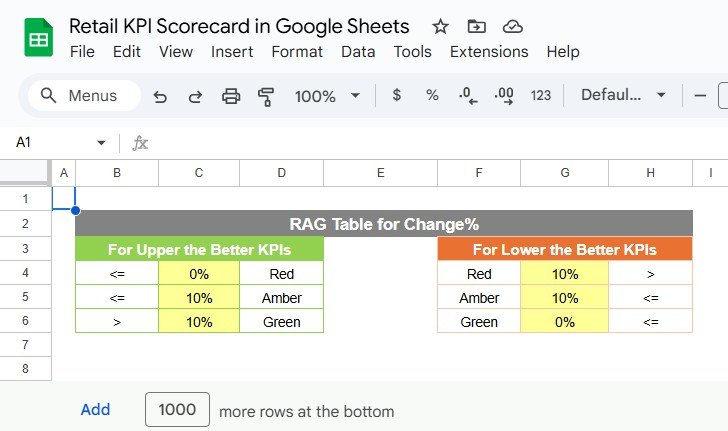
Customize thresholds for “Excellent,” “Average,” or “Below Target.”
Adjust icon indicators and traffic-light colors as per your brand style.
Makes the scorecard visually appealing and easy to interpret.
📦 What’s Inside the Template
✅ Interactive Dashboard – Real-time retail KPI visualization
✅ Trend Analysis Sheet – Detailed monthly progress charts
✅ KPI Definition Sheet – Clear and consistent KPI setup
✅ Data Input Sheet – Centralized location for all actuals and targets
✅ Color Settings Sheet – Full customization of visuals and formatting
✅ Auto Calculations – Dynamic MTD/YTD and % change formulas
Everything is interlinked and automated — no manual formulas needed! 🚀
👩💼 Who Can Use This Retail KPI Scorecard
🛍️ Retail Store Owners – Monitor overall sales and performance trends.
📈 Sales Managers – Evaluate revenue, conversion rate, and customer engagement.
💼 Operations Teams – Track inventory turnover and store efficiency.
👨💼 Finance & Accounting Teams – Compare targets, budgets, and profitability.
🏬 Regional Heads – Review multiple stores’ performance metrics with ease.
🧠 How to Use the Scorecard
Input Data: Enter actual KPI numbers and targets in the Data Input tab.
Select Month: Use the dropdown (Cell D3) on the Dashboard Sheet to switch views.
Analyze Performance: Review KPIs that are above, on, or below target.
Identify Trends: Use the Trend Sheet for deeper insights into individual KPIs.
Customize Visuals: Adjust color thresholds or add new KPIs if needed.
All charts, calculations, and visual elements update automatically — ensuring real-time accuracy.
🌟 Why Choose the Retail KPI Scorecard in Google Sheets
📈 Instant Insights: Real-time dashboard with automated calculations.
🎯 Goal-Oriented: Compare actuals vs targets to assess achievements.
🕒 Time-Saving: No coding or manual data entry beyond simple updates.
💡 Data Transparency: Shareable with team members and management.
🧭 Scalable & Customizable: Suitable for single or multi-store setups.
🌐 Cloud-Based Collaboration: Update and access anywhere with Google Sheets.
The Retail KPI Scorecard in Google Sheets is more than a reporting tool — it’s a performance management system that empowers retail businesses to make informed decisions, increase efficiency, and maximize profitability.
🔗 Click here to read the Detailed blog post
Watch the step-by-step video Demo: