


Monitoring employee training effectiveness is one of the most important responsibilities of HR and Learning & Development (L&D) teams. Without the right tools, it becomes nearly impossible to evaluate whether training programs are driving real improvement in skills, knowledge, and organizational outcomes.
The Employee Training Effectiveness Dashboard in Power BI is a ready-to-use, interactive solution that consolidates all training-related data into one visual platform. By tracking pre- and post-training scores, certifications, completion rates, and feedback, this dashboard empowers organizations to make data-driven training decisions that maximize ROI and improve employee performance.
🔑 Key Features of the Employee Training Effectiveness Dashboard
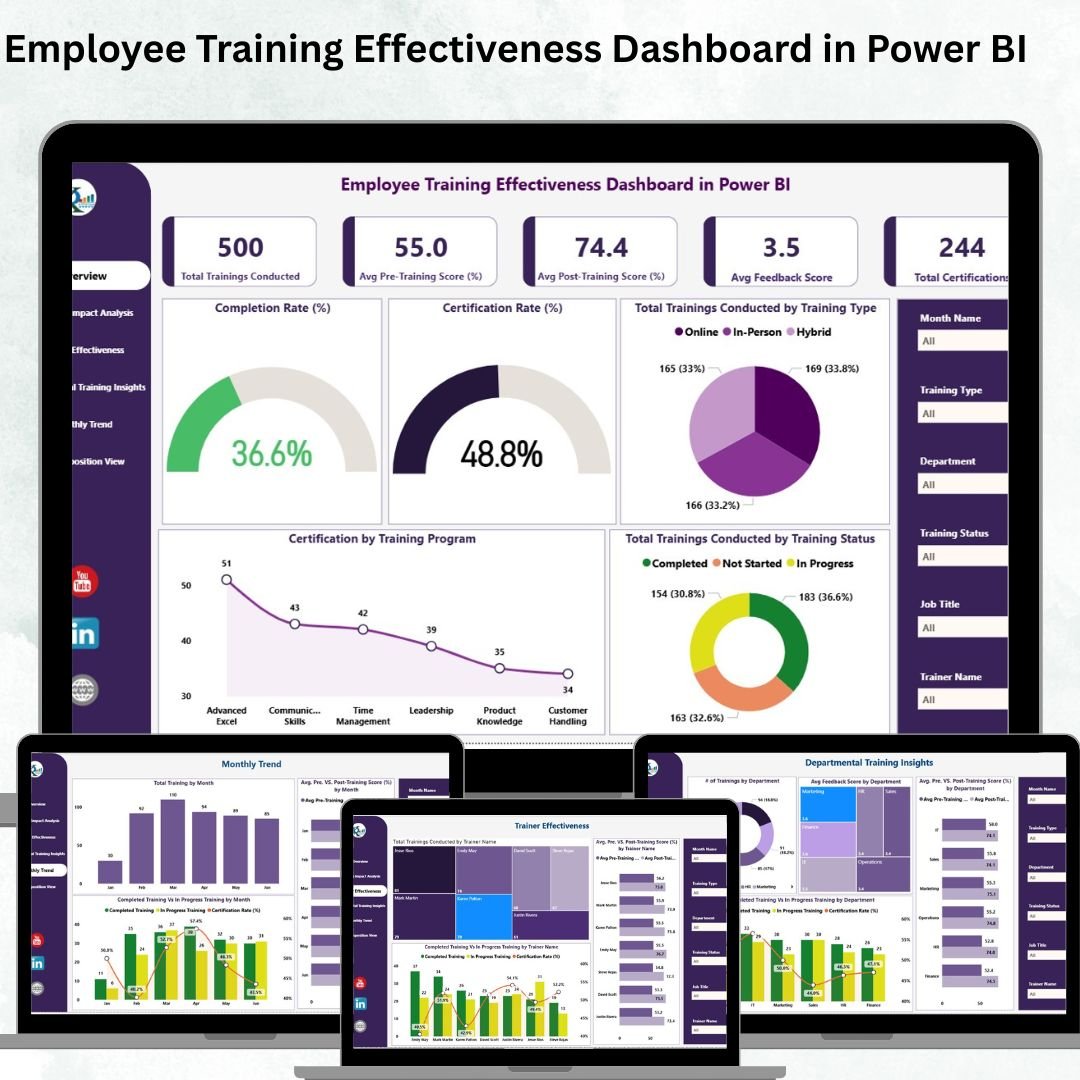
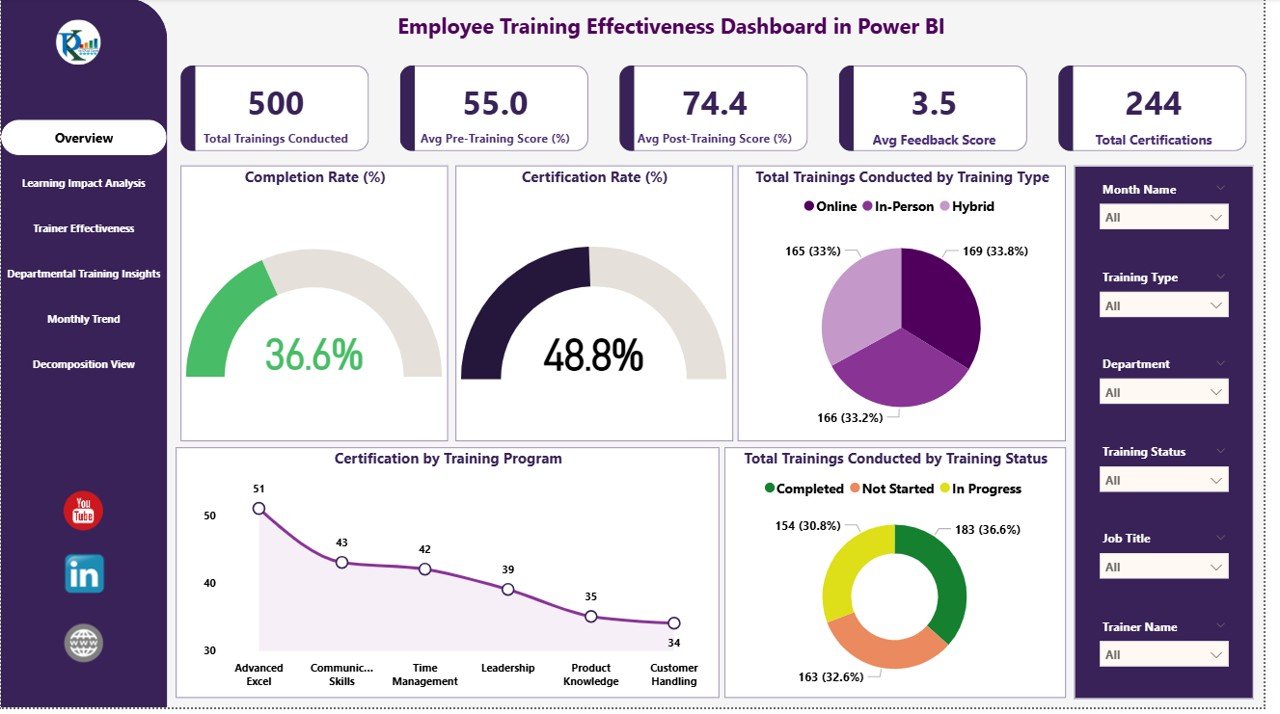
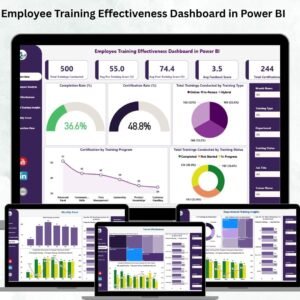
📋 Dashboard Overview Page
Cards: Total Trainings Conducted, Avg. Feedback Score, Avg. Post-Training Score (%), Avg. Pre-Training Score (%), Total Certifications.
Charts: Completion Rate (%), Certification Rate (%), Trainings by Type, Trainings by Status, Certification by Training Program.
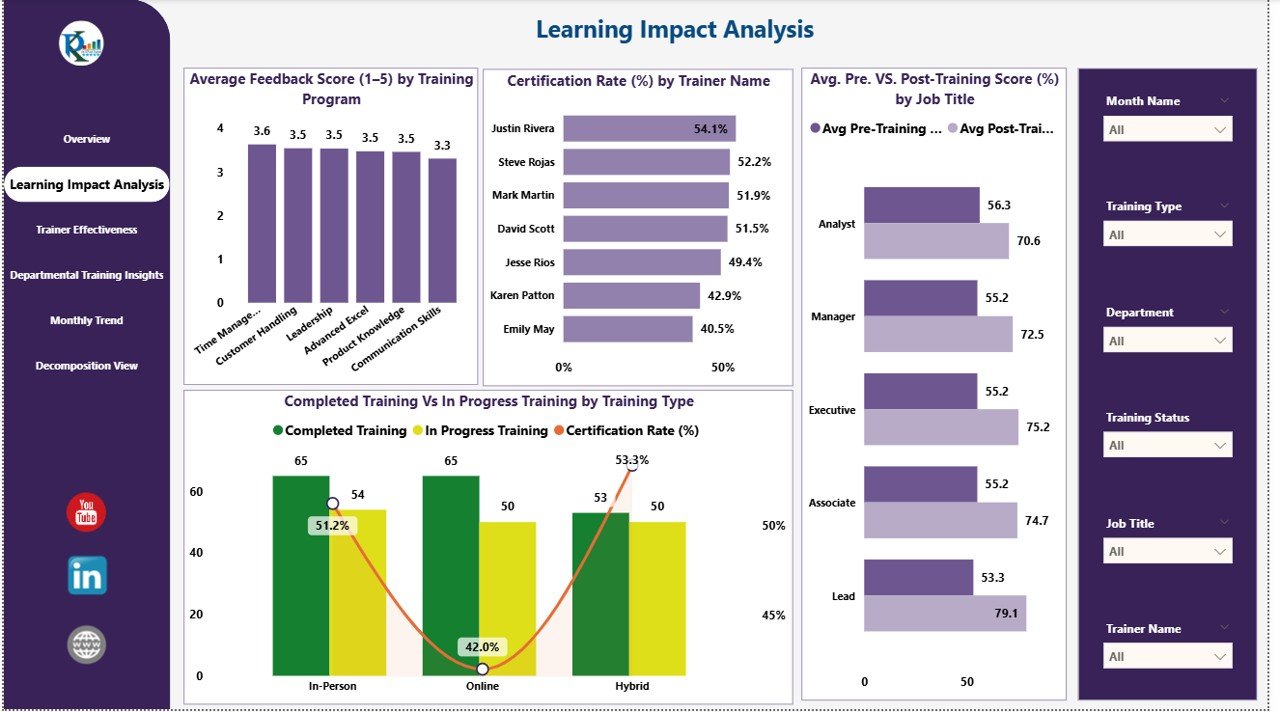
📈 Learning Impact Analysis Page
Average Feedback Score (1–5) by Training Program
Certification Rate (%) by Trainer Name
Avg. Pre vs Post-Training Score (%) by Job Title
Completed vs In Progress Trainings by Training Type
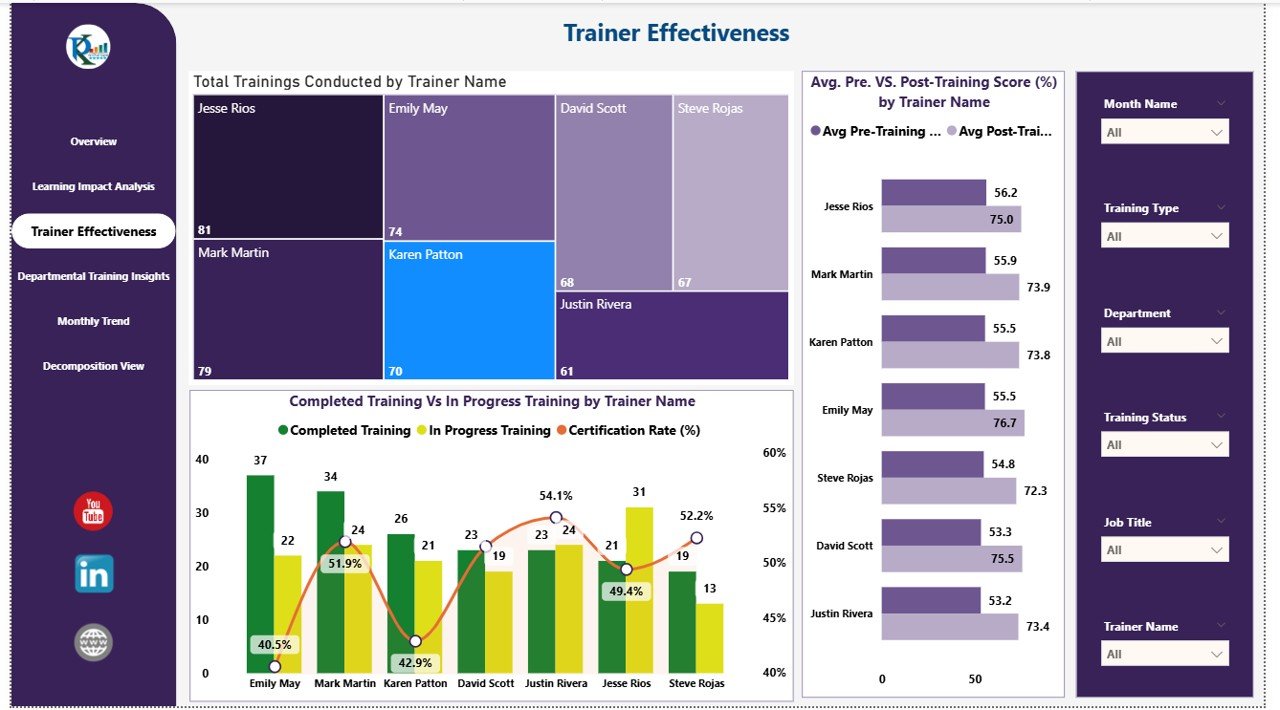
👨🏫 Trainer Effectiveness Page
Total Trainings Conducted by Trainer
Avg. Pre vs Post Score (%) by Trainer
Completed vs In Progress by Trainer
Identify trainer success and learning delivery effectiveness
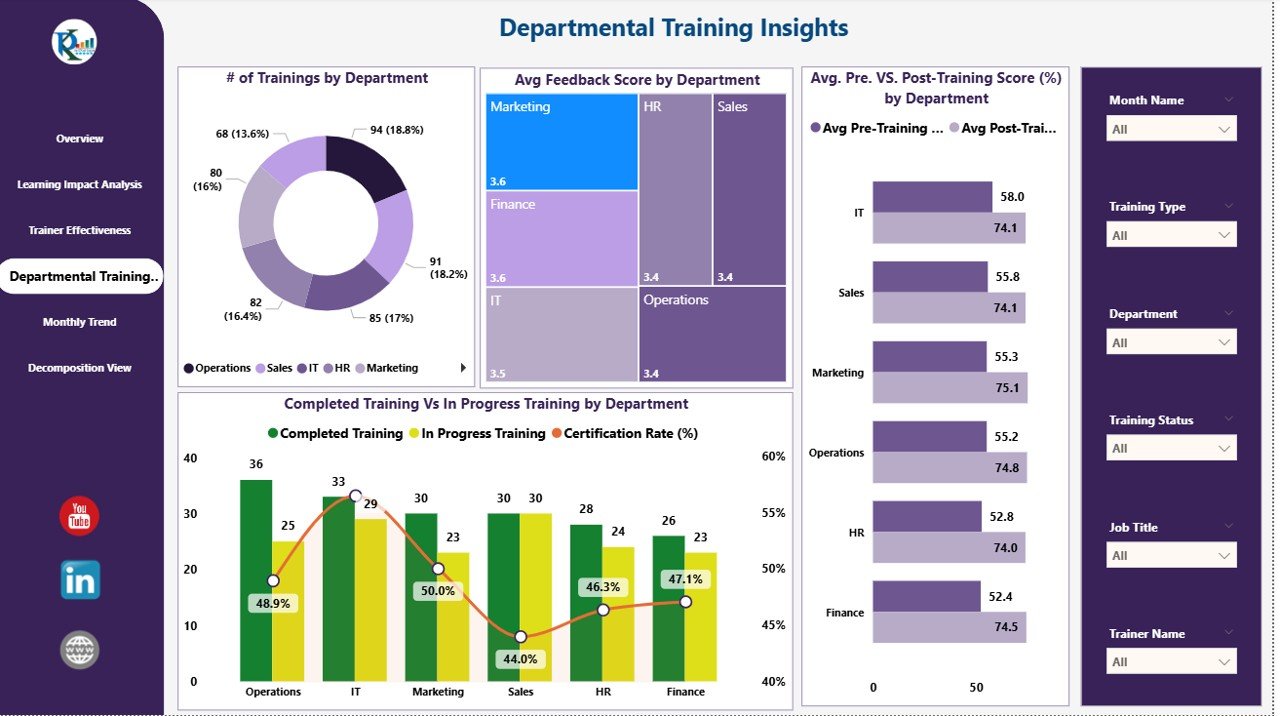
🏢 Departmental Training Insights Page
of Trainings by Department
Avg. Feedback Score by Department
Avg. Pre vs Post Score (%) by Department
Completed vs In Progress by Department
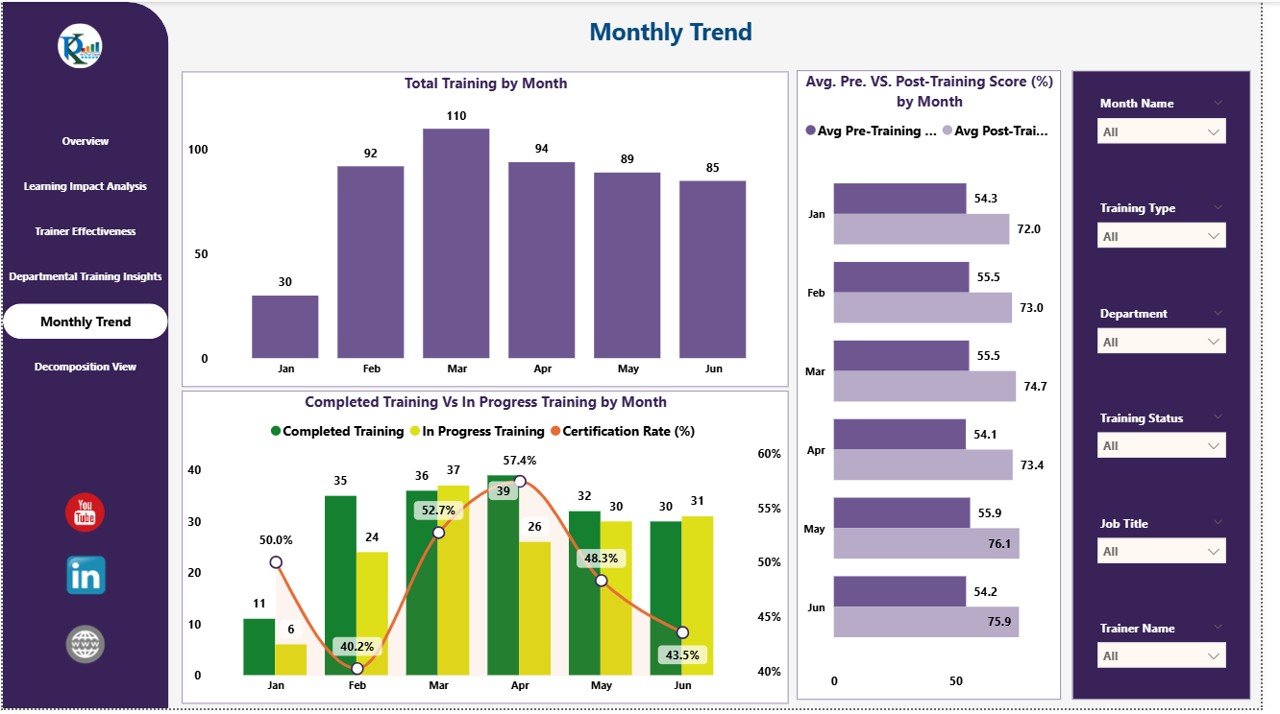
📅 Monthly Trend Page
Total Trainings by Month
Avg. Pre vs Post Score (%) by Month
Completed vs In Progress by Month
Track monthly performance improvements
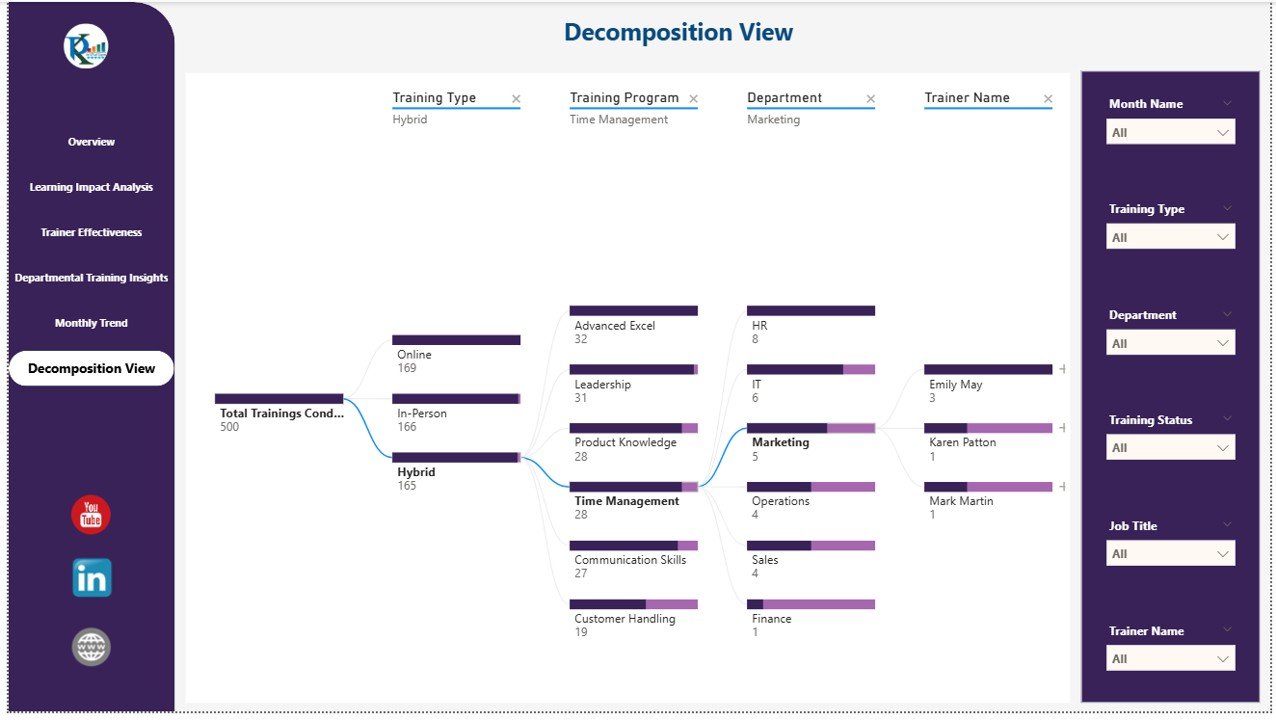
🌳 Decomposition View Page
Drill down into KPIs by department, trainer, training type, or location
Identify bottlenecks, gaps, and opportunities for improvement
📦 What’s Inside the Dashboard?
✅ Power BI (.pbix) File – Fully interactive and customizable
✅ Multiple Pages – Overview, Learning Impact, Trainer Effectiveness, Department Insights, Monthly Trends, Decomposition View
✅ Excel Data Source – Compatible with Input, Target, and Definition sheets
✅ Pre-Built KPIs & Charts – No setup required, just plug in your data
✅ Customizable Structure – Add, modify, or remove KPIs as needed
👥 Who Can Benefit from This Dashboard?
🎯 HR Managers – Track certifications, completion rates, and training feedback
🎯 L&D Teams – Measure learning improvement and program ROI
🎯 Trainers – Evaluate training delivery and participant progress
🎯 Executives – Gain a high-level view of organizational learning outcomes
🎯 Compliance Teams – Ensure mandatory trainings are completed on time
🌟 Advantages of the Employee Training Effectiveness Dashboard
✅ Measure Learning Impact – Compare pre vs post scores for actual knowledge gain
✅ Track Certifications – Monitor completion of mandatory and skill-based certifications
✅ Evaluate Trainers – Assess effectiveness and delivery quality
✅ Departmental Insights – Identify training gaps by team or role
✅ Trend Monitoring – Track performance improvements month-over-month
✅ Data-Driven Decisions – Use visual analytics to improve training programs
✅ Scalable & Customizable – Suitable for both small and large organizations
🧪 Best Practices for Using the Dashboard
Update Data After Each Session – Keep training records current for real-time insights.
Segment by Role/Department – Customize training programs based on team performance.
Monitor Trainer Effectiveness – Compare pre vs post scores to refine delivery.
Track Completion Rates – Ensure mandatory sessions are completed on schedule.
Use Trend Analysis – Plan future training sessions based on peak demand periods.
Leverage Decomposition View – Investigate root causes behind low performance.
🎯 How This Dashboard Helps Organizations
Improves training ROI with measurable outcomes
Enhances employee development & retention
Ensures compliance and certifications are up to date
Provides management-ready reports with instant insights
Enables continuous improvement in training delivery and content
🔗 Click here to read the Detailed blog post
🔗 Visit our YouTube channel for step-by-step video tutorials
Compatibility and Requirements
- Opens in Power BI Desktop, which is free to download for Windows.
- Training data comes from an Excel file with Input, Target and Definition sheets.
- Get the free app from Microsoft: Get Power BI Desktop.
Frequently Asked Questions
What pages are in the Employee Training Effectiveness Dashboard?
Six: Overview, Learning Impact Analysis, Trainer Effectiveness, Departmental Training Insights, Monthly Trend and a Decomposition View.
Which KPIs appear on the overview?
Total trainings conducted, average feedback score, average pre and post training scores, and total certifications.
Can I compare trainers?
Yes. The Trainer Effectiveness page shows trainings, pre vs post scores and completed vs in progress by trainer.
What does the Decomposition View do?
It drills into KPIs by department, trainer, training type or location to find gaps.
Is there an Excel version?
Yes. See the Employee Training Effectiveness Dashboard in Excel.
Related Training Templates
- Employee Training Effectiveness Dashboard in Excel: the same analysis in Excel
- Training and Development Dashboard in Power BI: a wider training dashboard
- Training and Development Dashboard in Google Sheets: a shared online version
- Training Completion Certification Tracker in Excel: log who completed which course
- HR & Workforce Analytics Bundle: 10 HR templates in one bundle
Browse all Power BI dashboards or the Excel HR and payroll templates.














Reviews
There are no reviews yet.