



This ready-to-use Event Management Dashboard in Excel brings all your event data together into one central file. Instead of juggling multiple reports and spreadsheets, you can view KPIs, charts, and trends in one streamlined dashboard. Whether you’re managing small corporate workshops or large international conferences, this tool makes it easy to analyze results, measure efficiency, and make data-driven decisions.
🌟 Key Features of Event Management Dashboard in Excel
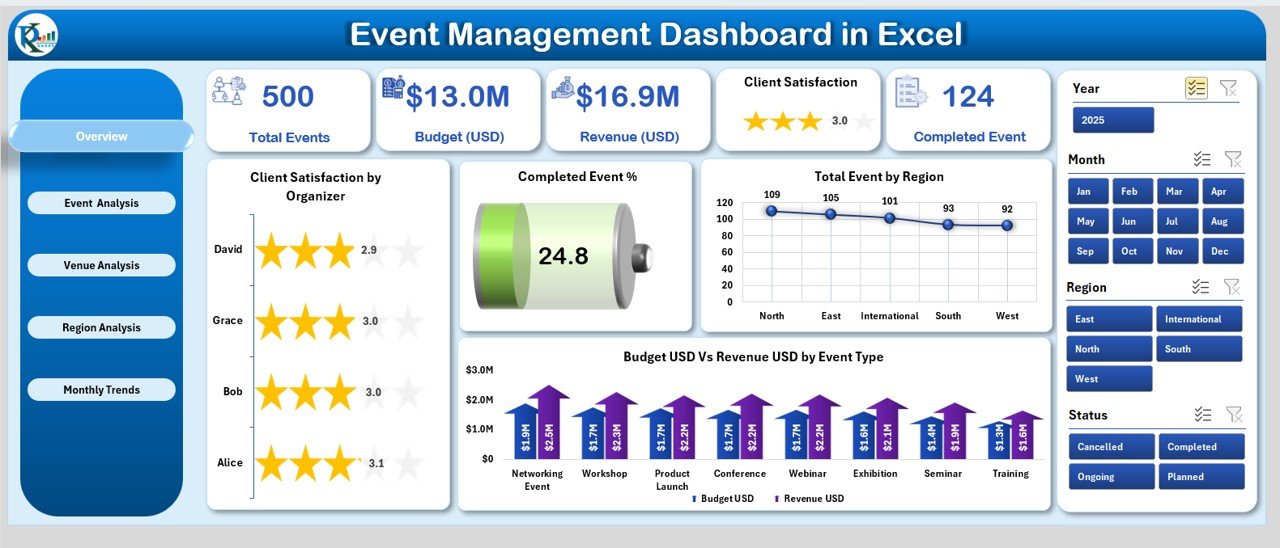
📊 Overview Page: Get a quick summary of event KPIs—see total events, completed %, client satisfaction, and budget vs revenue comparisons in one glance.
🎯 Event Analysis Page: Understand performance by event type with charts on satisfaction, completed events, and average attendees.
🏟 Venue Analysis Page: Evaluate venue-specific success using cost, revenue, and satisfaction insights to choose the best locations.
🌍 Region Analysis Page: Compare event performance across regions with satisfaction, ongoing events, and budget vs revenue breakdowns.
📅 Monthly Trends Page: Track seasonal patterns by viewing monthly completed events, total events, and profitability trends.
⚡ Support Sheet: Keep backend data organized and error-free for seamless dashboard functioning.
📦 What’s Inside the Event Management Dashboard
When you download this template, you’ll receive:
✅ A professionally designed Excel dashboard with 5 analytical pages + 1 support sheet.
✅ Pre-built charts, KPIs, and pivot tables to analyze performance instantly.
✅ A Page Navigator for smooth switching between dashboard sections.
✅ Budget vs Revenue analysis across multiple dimensions (event type, venue, region, and month).
✅ A scalable framework suitable for startups, corporates, nonprofits, and institutions.
✅ A customizable layout—add/remove KPIs, charts, or formulas based on your event goals.
🛠 How to Use the Event Management Dashboard
Input Event Data: Add event type, venue, region, organizer, budget, and revenue into the support sheet.
Navigate Pages: Use the Page Navigator to switch between Overview, Event, Venue, Region, and Monthly Trend analyses.
Track KPIs: Review client satisfaction %, completed events, and attendance metrics.
Analyze Budgets: Compare budget vs revenue across categories to understand ROI.
Spot Trends: Check monthly patterns to prepare for peak and off-season events.
Export Reports: Share event results with management or clients by exporting charts and tables to PDF.
💡 No advanced Excel knowledge required—this dashboard is beginner-friendly and intuitive.
👥 Who Can Benefit from This Dashboard
The Event Management Dashboard in Excel is perfect for:
🏢 Corporate Event Planners: Track ROI of workshops, training programs, and conferences.
📈 Marketing Teams: Monitor performance of product launches and promotional campaigns.
🎓 Educational Institutions: Manage seminars, webinars, and student career fairs.
🤝 Nonprofits: Track fundraising events, donor satisfaction, and campaign efficiency.
🏨 Hospitality Industry: Manage weddings, banquets, and conventions with detailed data insights.
Whether you manage small meetings or global conferences, this tool helps you save time, cut costs, and maximize event success.
📖 Click here to read the Detailed Blog Post
🎥 Visit our YouTube channel to learn step-by-step video tutorials
Watch the step-by-step video tutorial:
Compatibility and Requirements
- Works in Microsoft Excel desktop (Excel 2016 or later, or Microsoft 365).
- The dashboard uses pivot tables and charts. Microsoft explains how to build them in Create a PivotTable to analyze worksheet data.
Frequently Asked Questions
Which pages are included?
Five analysis pages (Overview, Event Analysis, Venue Analysis, Region Analysis and Monthly Trends) plus one Support sheet for the backend data.
Where do I enter my event data?
On the Support sheet. Add event type, venue, region, organizer, budget and revenue there, and the dashboard pages read from it.
Can I compare budget with revenue?
Yes. Budget vs Revenue is shown by event type, venue, region and month.
How do I move between pages?
Use the Page Navigator to switch between the Overview, Event, Venue, Region and Monthly Trend pages.
Is there a Power BI version?
Yes. See the Event Management Dashboard in Power BI.
Related Event Templates
- Event Management Dashboard in Power BI: the same topic in Power BI
- Event Management KPI Scorecard in Excel: a scorecard view of event KPIs
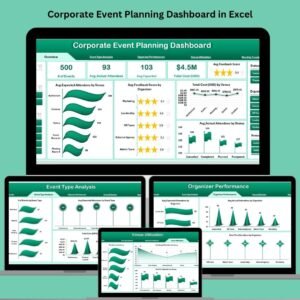
- Corporate Event Planning Dashboard in Excel: a dashboard for corporate events
- Event Planning Calendar in Excel: schedule your events in a calendar
- Marketing Manager Toolkit: 9 templates for marketing teams in one download
Browse all Excel dashboards.
















Reviews
There are no reviews yet.