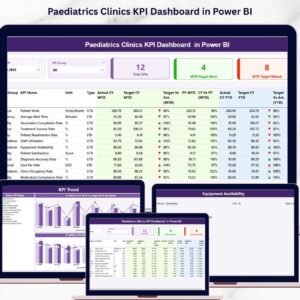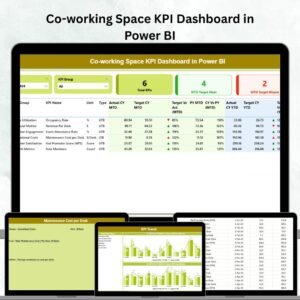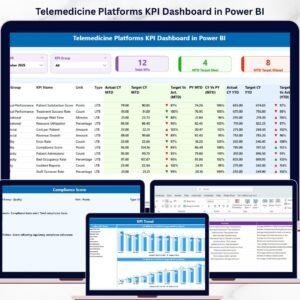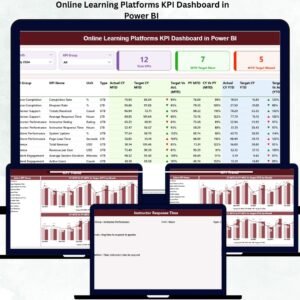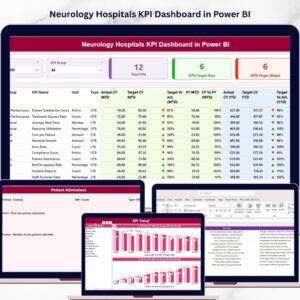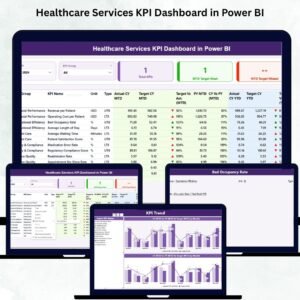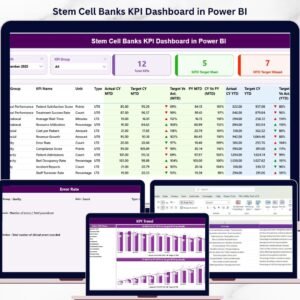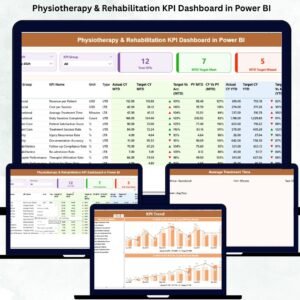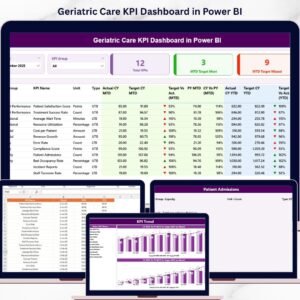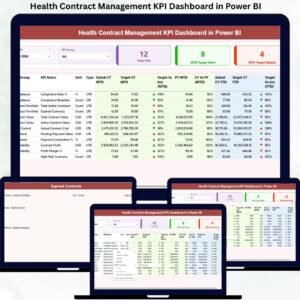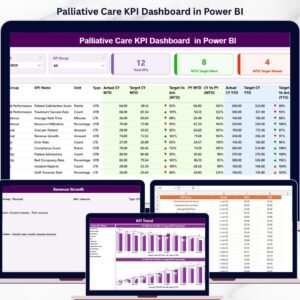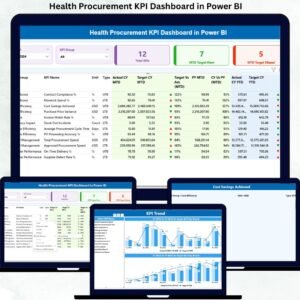

Running a successful dental practice today is about more than providing excellent care—it’s about managing operations, tracking performance, and making data-driven decisions. Rising costs, increasing competition, and regulatory pressures mean clinics need real-time insights to stay ahead. That’s why we designed the Dental Practice KPI Dashboard in Power BI—a ready-to-use solution that empowers dental professionals with clarity, control, and confidence.
This powerful dashboard centralizes your clinic’s key performance indicators (KPIs) into an easy-to-read, interactive format. Instead of juggling spreadsheets and reports, you can view financial, operational, and patient-focused metrics all in one place.
✨ Key Features of the Dental Practice KPI Dashboard
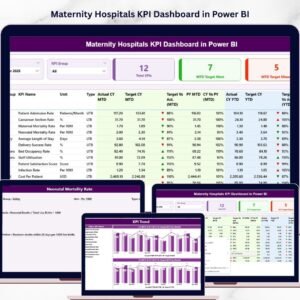
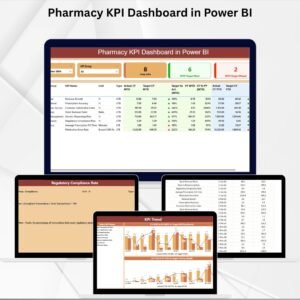
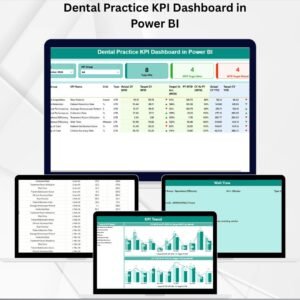
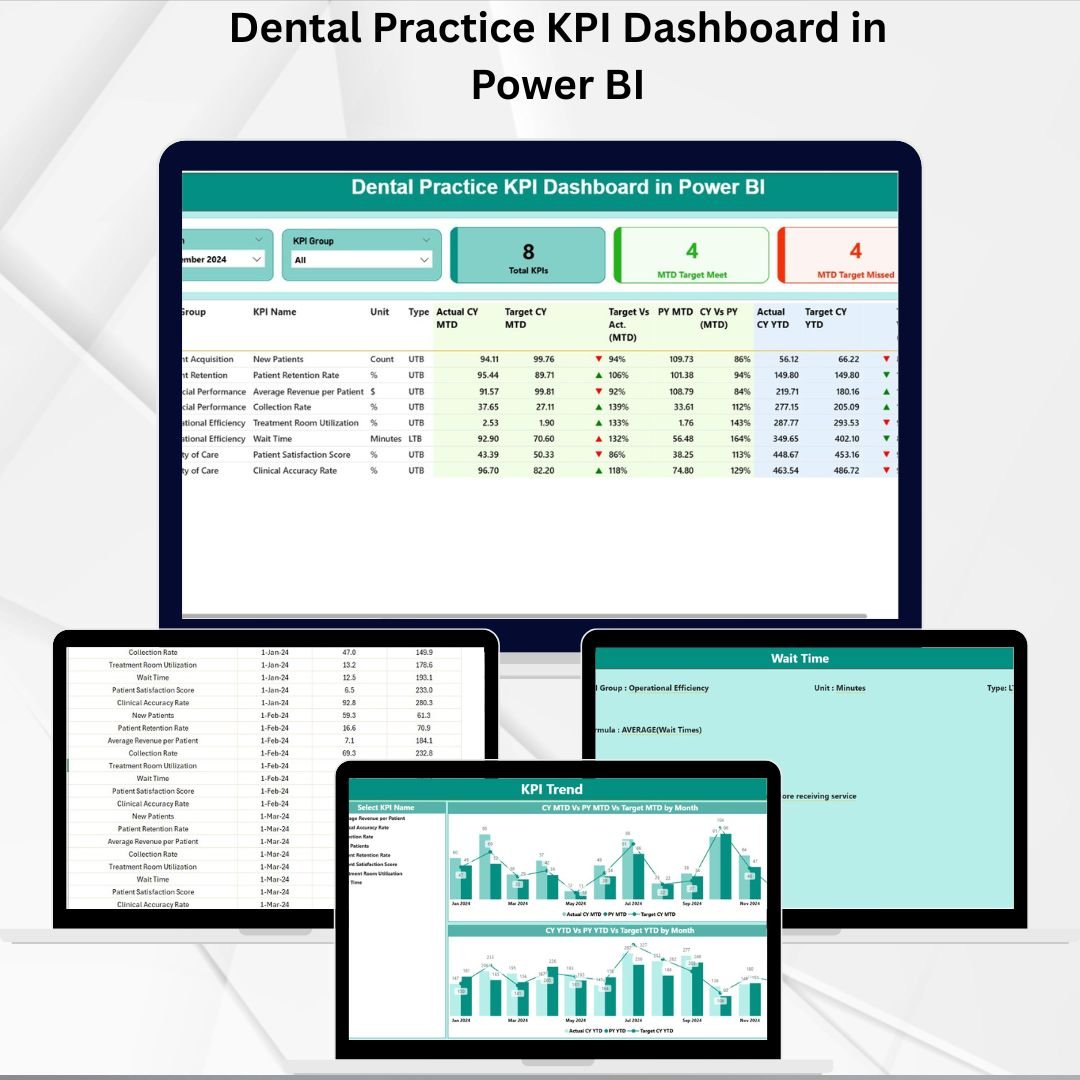
📊 3 Main Dashboard Pages – Summary, KPI Trend, and KPI Definition for clear insights.
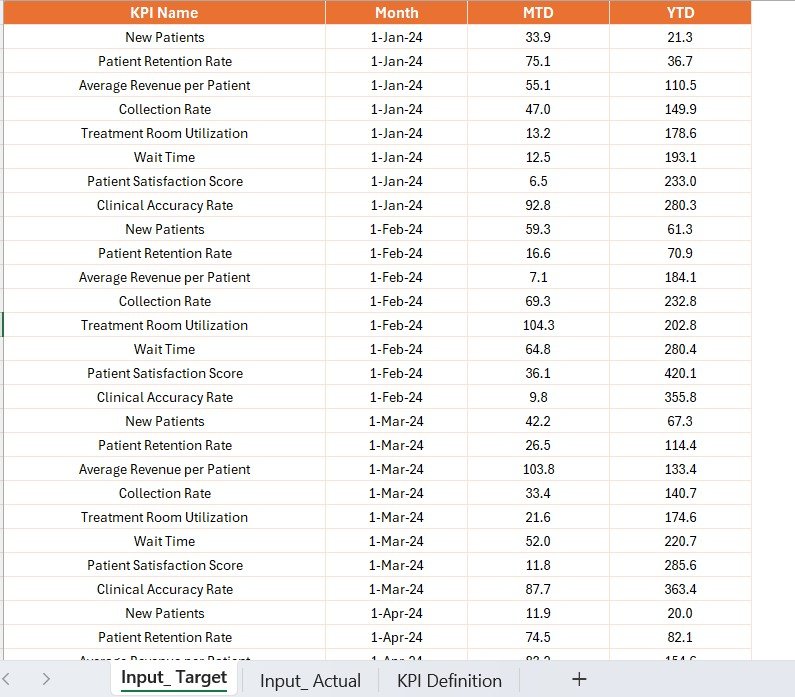
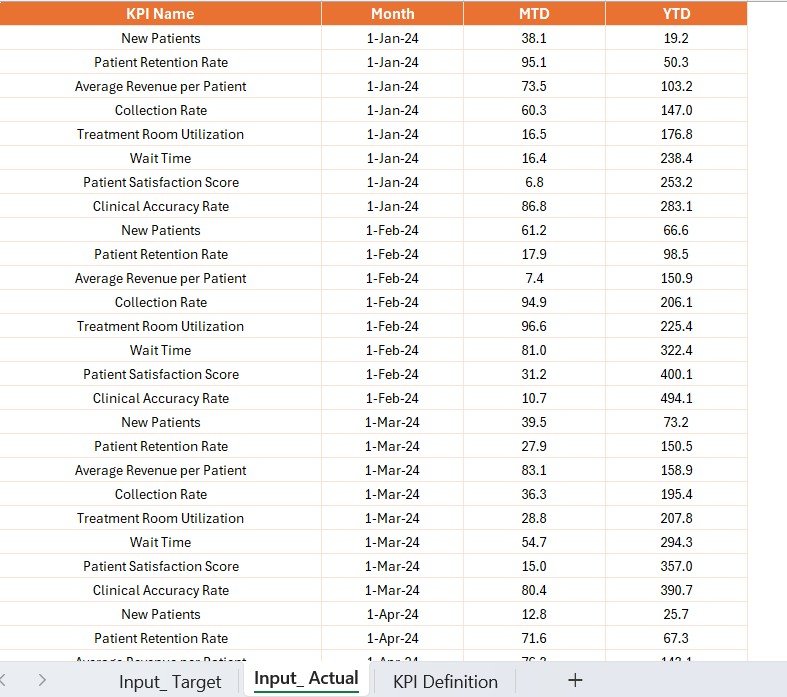
🗂️ Excel Data Source – Enter Actual, Target, and Definition data easily in structured worksheets.
🎯 KPI Cards & Metrics – Instantly see total KPIs, target met, and missed counts.
🔄 MTD & YTD Analysis – Track performance month-to-date and year-to-date for better decision-making.
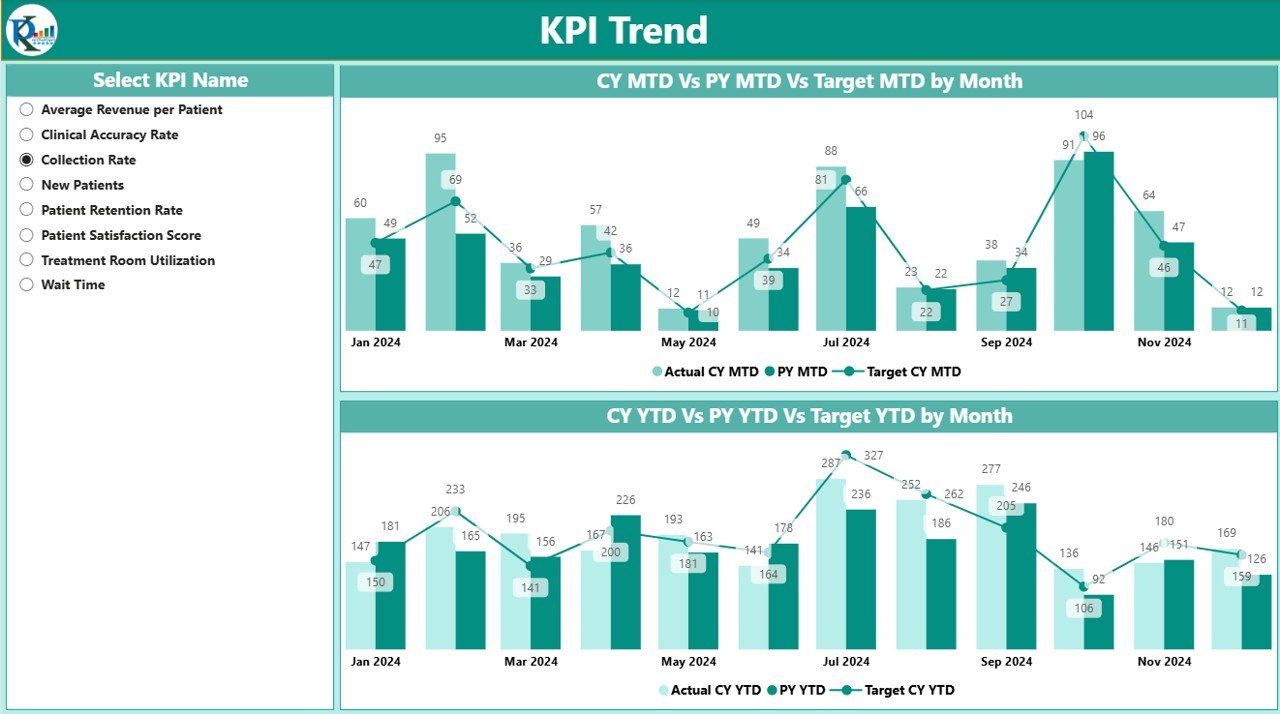
📈 Interactive Charts – View Actuals vs. Targets vs. Previous Year with trend analysis.
🖱️ Slicers & Drill-throughs – Filter by Month, KPI Group, or drill into detailed KPI definitions.
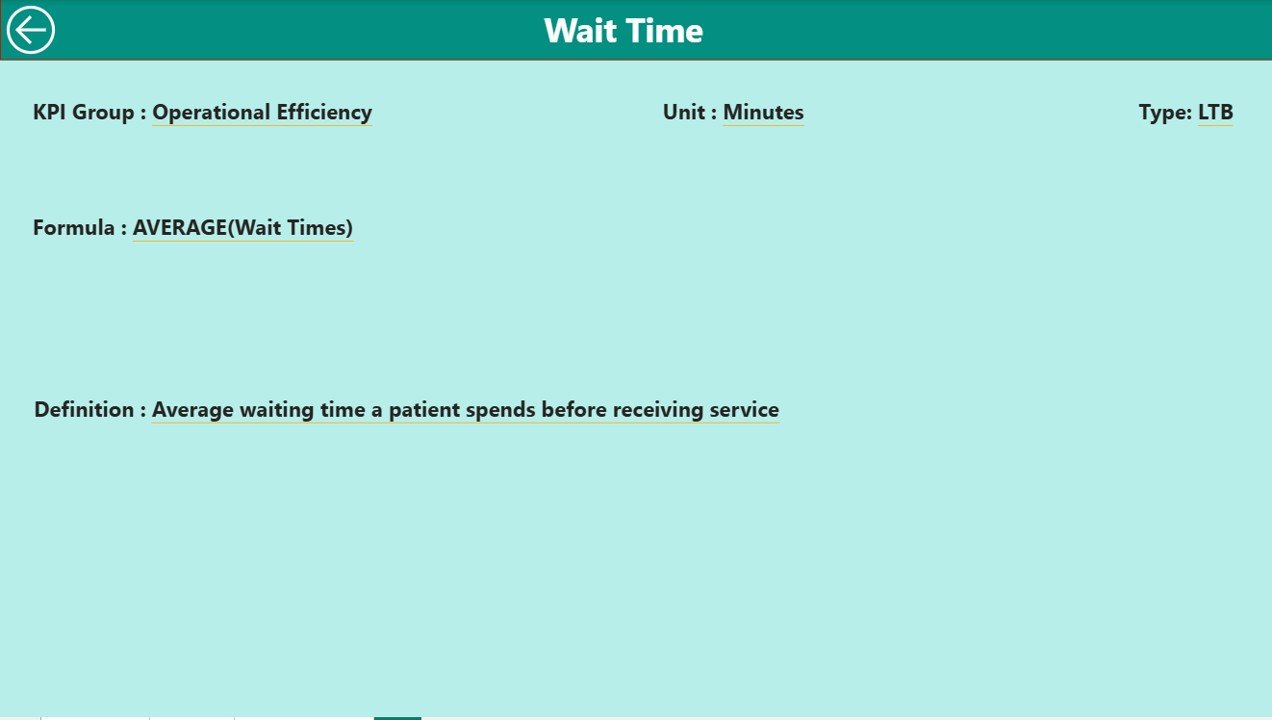
✅ KPI Definitions – Every metric is transparent with formula, unit, and type (LTB/UTB).
🔒 User-Friendly Design – Built for non-technical staff; updates automatically when data is refreshed.
📦 What’s Inside the Dashboard
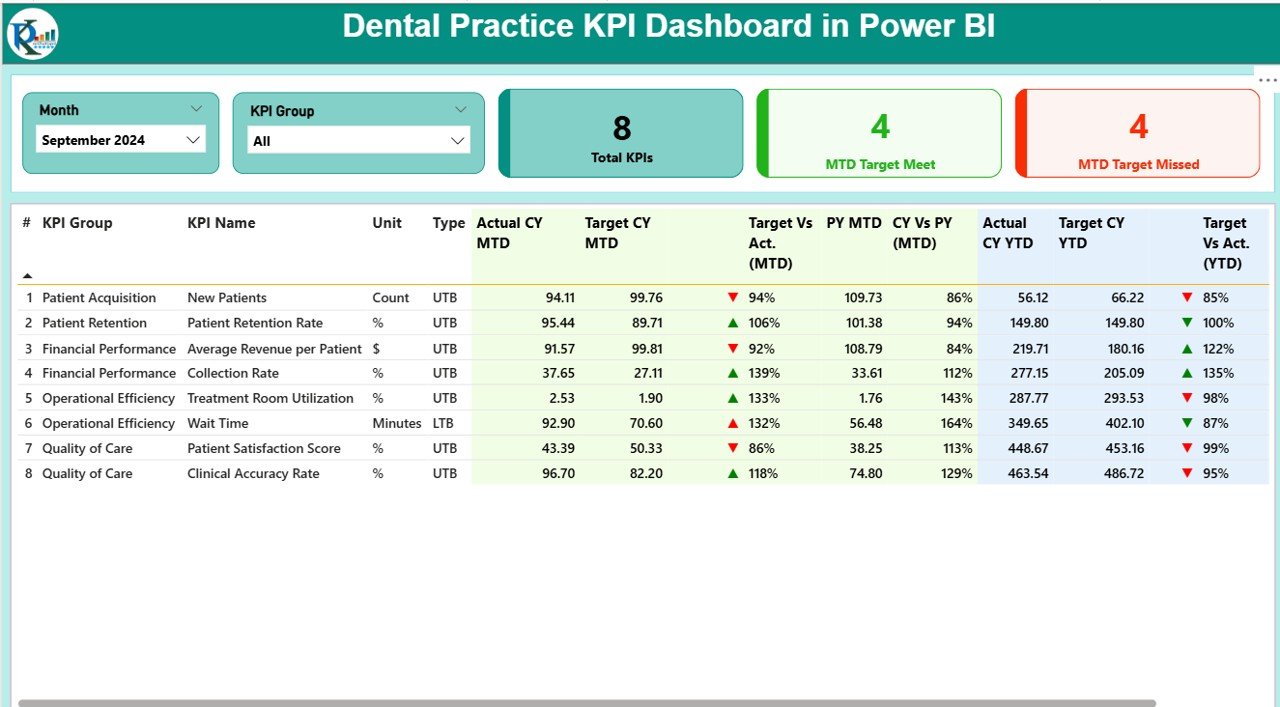
Summary Page – A complete snapshot with KPI cards, performance tables, and variance analysis.
KPI Trend Page – Combo charts showing performance over time (CY, PY, and Targets).
KPI Definition Page – Drill-through transparency with KPI Name, Formula, Unit, and Type.
Excel Backend – Three sheets (Actual, Target, KPI Definition) for simple and secure data entry.
This structure makes it easy to maintain and highly customizable, even for small clinics.
🛠️ How to Use the Dashboard
Update Excel Sheets – Add Actual values in Input_Actual and Target values in Input_Target.
Refresh Power BI – Connect the Excel file and update visuals instantly.
Navigate with Slicers – Filter by Month, KPI Group, or specific metrics.
Drill Into Details – From the Summary Page, explore any KPI’s definition.
Review Trends – Use the KPI Trend page to track progress and spot opportunities.
Act on Insights – Use findings to adjust staff allocation, reduce costs, or improve patient care.
👥 Who Can Benefit from This Dashboard?
🦷 Dentists & Clinic Owners – Gain a bird’s-eye view of practice health.
👩⚕️ Clinic Managers – Monitor daily operations and resource utilization.
💼 Finance Teams – Track costs, revenue, and profitability with accuracy.
📋 Operations Staff – Improve efficiency with chair utilization and treatment acceptance insights.
🌟 Patient Experience Teams – Measure satisfaction and focus on retention strategies.
🎯 Advantages of the Dental Practice KPI Dashboard
✅ Improved Decision-Making – Instant visibility without manual reports.
✅ Time-Saving – Automates calculations and reporting.
✅ Target Tracking – Compare actual vs. monthly and yearly goals.
✅ Transparency – Clear KPI definitions reduce confusion.
✅ Growth Opportunities – Identify underperforming areas quickly.
✅ Patient Focus – More time for care, less on admin tasks.
🚀 Opportunities for Improvement
While already powerful, the dashboard can be enhanced by:
🔗 EHR Integration – Direct connection to patient data for accuracy.
🔔 Automated Data Updates – Eliminate manual Excel entry.
📱 Mobile Accessibility – View KPIs on-the-go with Power BI app.
👥 Expanded KPIs – Add marketing ROI, compliance, or staff performance metrics.
📊 Predictive Analytics – Forecast treatment acceptance or patient retention.
🏆 Best Practices for Using the Dashboard
Keep data updated monthly (or weekly) for accuracy.
Define SMART Goals (Specific, Measurable, Achievable, Relevant, Time-bound).
Train staff to understand KPIs and their impact.
Customize KPIs to match your clinic’s unique needs.
Analyze long-term trends, not just current performance.
Act on insights to reduce costs and improve patient satisfaction.
🏢 Real-World KPIs to Track
Patient Appointments (scheduled, completed, missed)
Chair Utilization Rate (%)
Average Treatment Time
Patient Satisfaction Score
Revenue per Patient
Treatment Acceptance Rate (%)
New vs. Returning Patients
Operating Costs
These metrics help clinics boost efficiency, reduce costs, and improve patient experience.
📖 Click here to read the Detailed blog post
🎥 Visit our YouTube channel to learn step-by-step video tutorials