

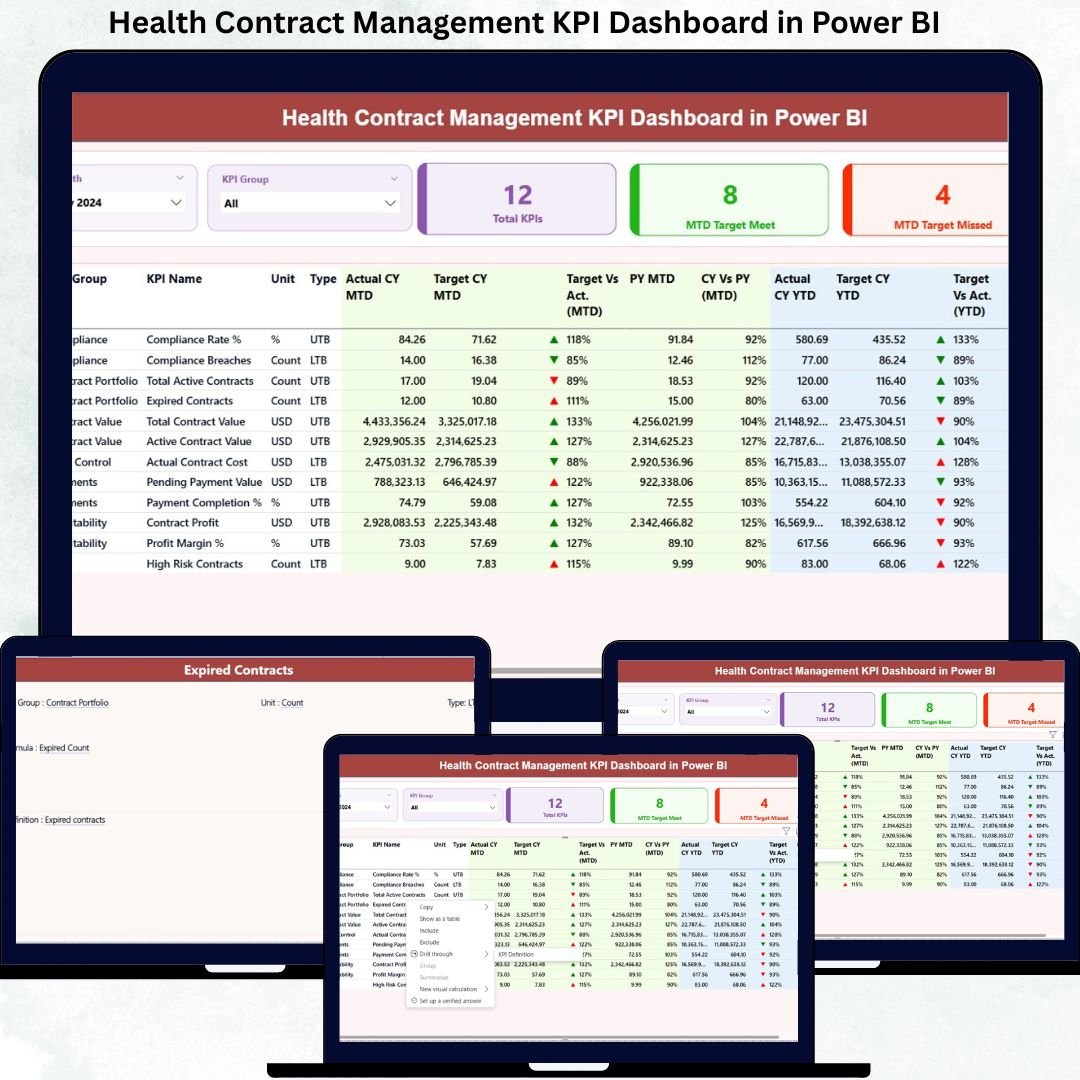

Managing healthcare contracts can quickly become complex. With multiple vendors, strict compliance rules, performance benchmarks, and cost controls, healthcare organizations need a smarter way to monitor and manage contracts effectively.
That’s exactly where the Health Contract Management KPI Dashboard in Power BI becomes an essential tool.
This powerful, ready-to-use dashboard transforms raw contract data into meaningful insights, helping healthcare professionals track KPIs, monitor compliance, analyze trends, and improve decision-making — all from one interactive Power BI report.
Whether you manage hospital contracts, vendor agreements, or healthcare service-level commitments, this dashboard gives you full control with clarity and confidence.
🚀 Key Features of Health Contract Management KPI Dashboard
✅ Interactive Power BI Dashboard – Easy-to-use visuals for fast decision-making
✅ Excel-Based Data Input – Simple data entry with no technical complexity
✅ MTD & YTD Performance Tracking – Monitor monthly and yearly performance
✅ Target vs Actual Comparison – Instantly identify gaps
✅ Automated KPI Status Indicators – Green and red arrows for performance clarity
✅ Dynamic Slicers – Filter by month and KPI group
✅ Trend Analysis Charts – Track growth and performance patterns
✅ Professional Layout – Management-ready reporting design
📊 What’s Inside the Health Contract Management KPI Dashboard
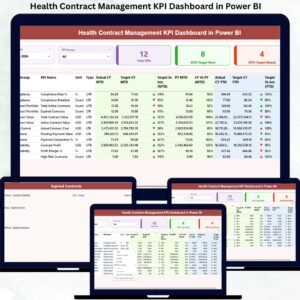
This dashboard contains three powerful analytical pages, each designed to give complete visibility into healthcare contract performance.
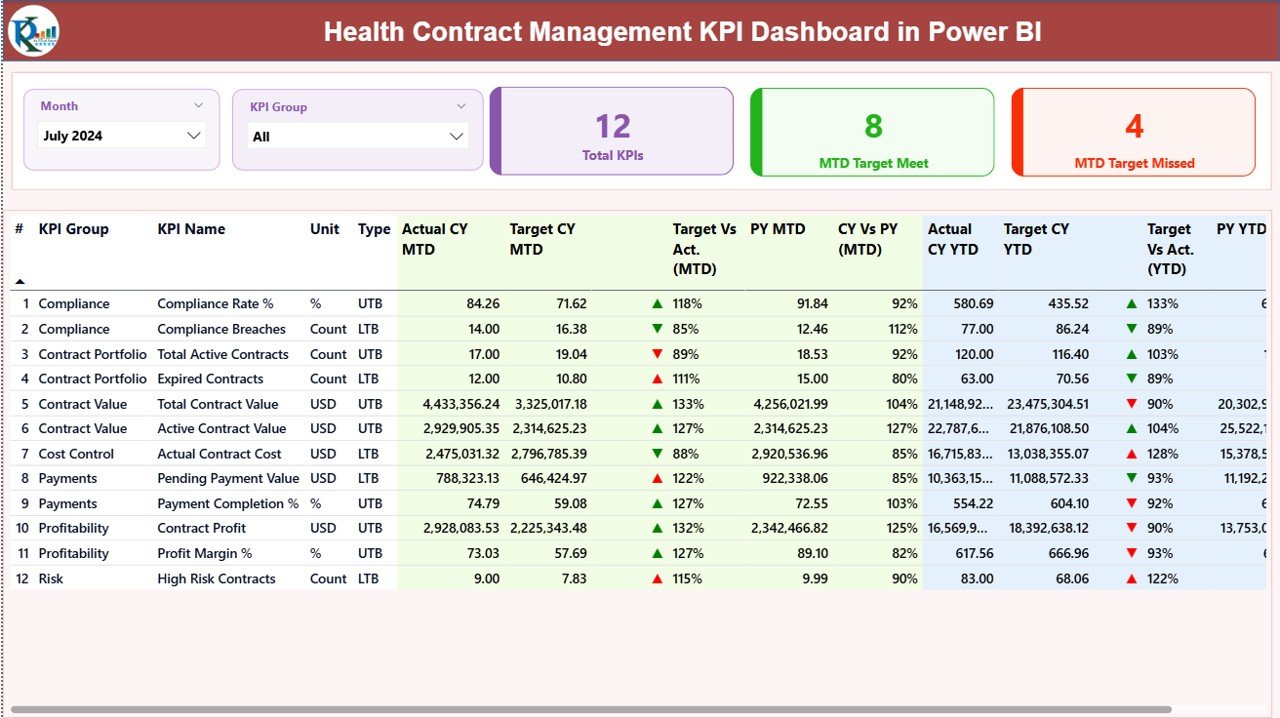
🔹 Summary Page – Complete KPI Overview
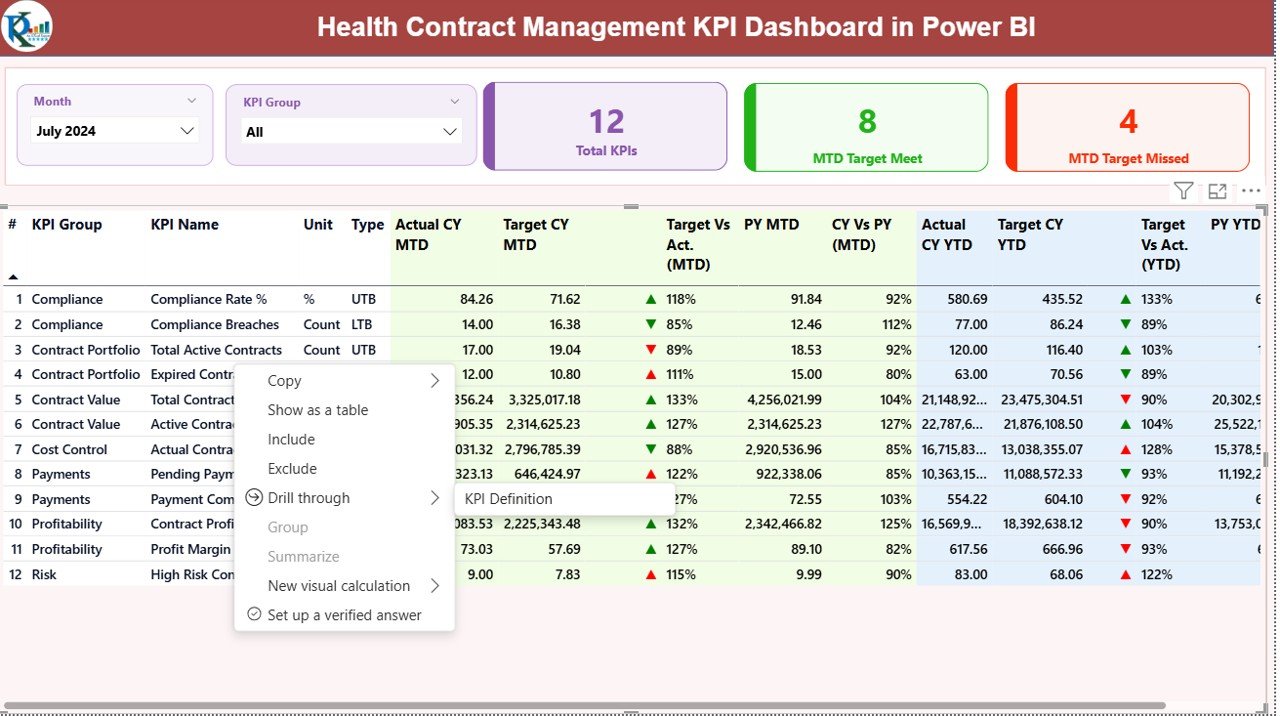
This page provides a high-level snapshot of all key contract metrics.
✔ Month & KPI Group slicers
✔ KPI Cards:
Total KPIs
MTD Target Met
MTD Target Missed
✔ Detailed KPI Table:
KPI Number
KPI Group
KPI Name
Unit of Measurement
KPI Type (LTB / UTB)
Actual CY MTD
Target CY MTD
Status Indicators
Target vs Actual (%)
Previous Year Comparison
YTD Performance
This page helps management instantly understand overall performance health.
📈 KPI Trend Page – Performance Tracking Made Easy
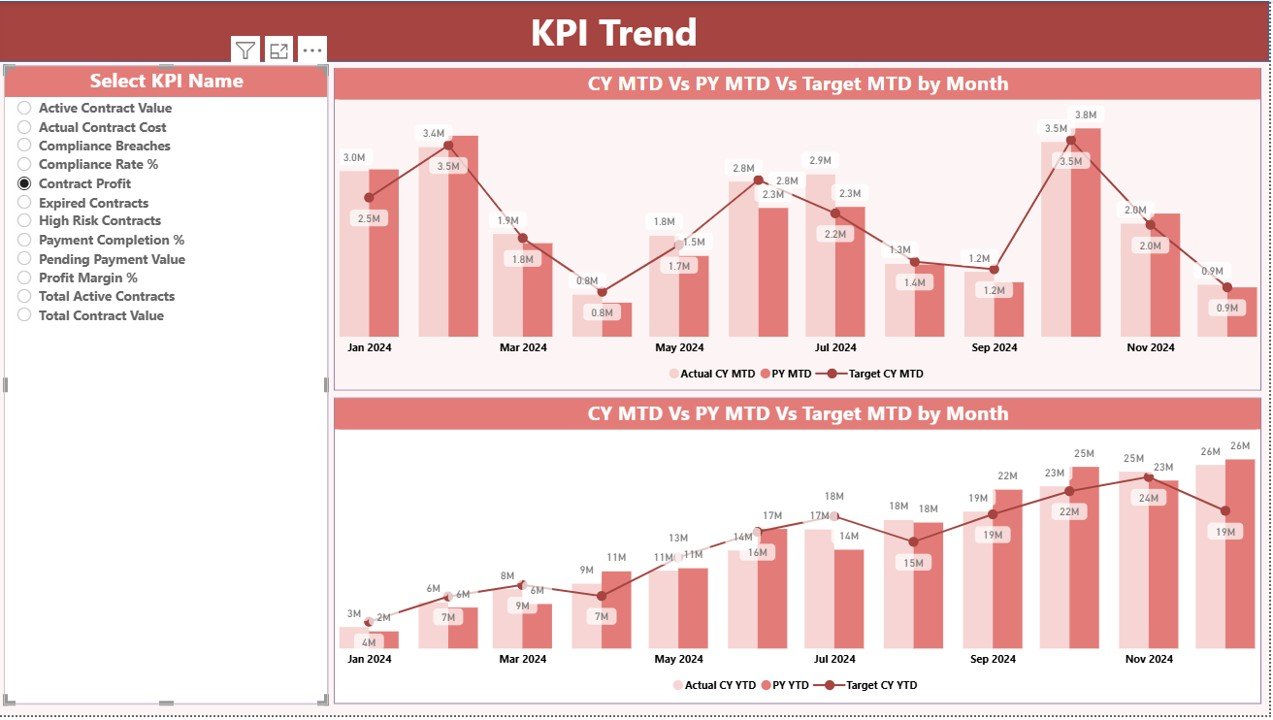
This page focuses on trend analysis and performance comparison.
✔ MTD Trend Analysis
✔ YTD Trend Analysis
✔ Comparison between:
Current Year Actual
Previous Year
Target Values
✔ KPI Selection Slicer for focused insights
This view helps identify:
Performance improvements
Seasonal trends
Underperforming KPIs
Growth patterns
📘 KPI Definition Page – Full Transparency
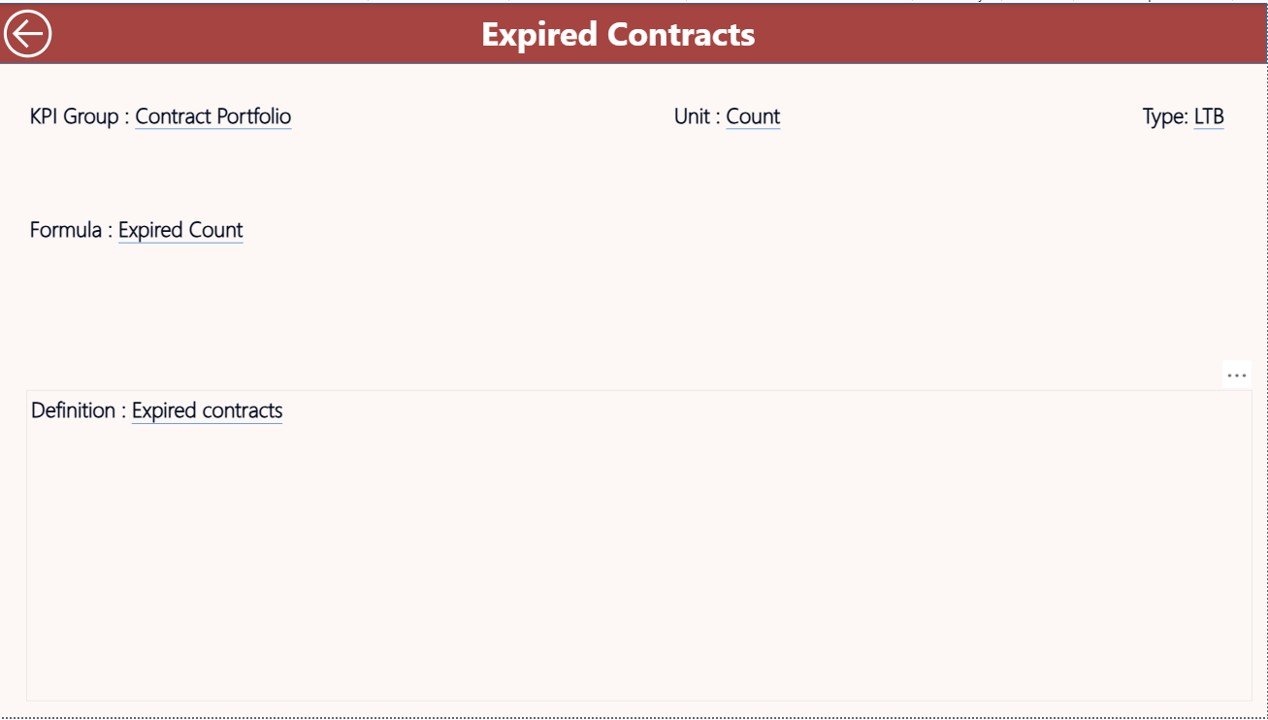
This page ensures clarity for all users.
✔ KPI Name
✔ KPI Formula
✔ KPI Definition
✔ KPI Type (LTB / UTB)
Users can quickly understand how each KPI is calculated and interpreted, improving accuracy and trust in reporting.
🛠️ How to Use the Health Contract Management KPI Dashboard
1️⃣ Enter actual and target data in the Excel input sheets
2️⃣ Refresh Power BI dashboard
3️⃣ Use slicers to filter data
4️⃣ Review MTD & YTD performance
5️⃣ Analyze trends and KPIs
6️⃣ Take action based on insights
No technical skills required — just update Excel and view results instantly.
👥 Who Can Benefit from This Dashboard?
✅ Healthcare Administrators
✅ Hospital Management Teams
✅ Contract Managers
✅ Finance & Compliance Teams
✅ Procurement Departments
✅ Healthcare Analysts
✅ Consultants & Auditors
If you manage contracts, costs, or performance in healthcare — this dashboard is built for you.
🎯 Why Choose This Dashboard?
✔ Saves reporting time
✔ Improves decision accuracy
✔ Enhances contract visibility
✔ Reduces financial risks
✔ Supports compliance monitoring
✔ Easy to customize
✔ Professional Power BI design
Click here to read the Detailed Blog Post
Visit our YouTube channel to learn step-by-step video tutorials
Compatibility and Requirements
- Works in Power BI Desktop, which is free. Microsoft explains how to get it in Get Power BI Desktop.
- You enter your actual and target data in the Excel input sheets, then refresh the Power BI report.
Frequently Asked Questions
How many pages does the dashboard have?
Three pages: Summary, KPI Trend and KPI Definition.
How do I update the dashboard with my data?
Enter your actual and target figures in the Excel input sheets and refresh the Power BI dashboard. The slicers and charts then show your numbers.
Can I compare this year with last year?
Yes. The Summary page shows Previous Year comparison next to Actual CY MTD and Target CY MTD, and the KPI Trend page compares current year actual, previous year and target values.
How do I see if a KPI hit its target?
The Summary page shows green and red status arrows for each KPI, plus cards for Total KPIs, MTD Target Met and MTD Target Missed.
Where can I see how each KPI is calculated?
Open the KPI Definition page. It lists the KPI name, formula, definition and type (LTB or UTB) for every KPI.
Is there an Excel version?
Yes. See the Health Contract Management KPI Dashboard in Excel.
Related Healthcare and Contract Templates
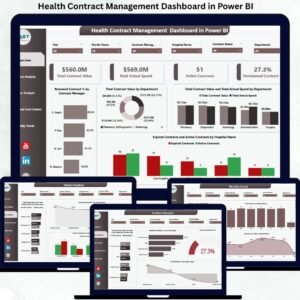
- Health Contract Management Dashboard in Power BI: a dashboard view of the same topic in Power BI
- Health Contract Management KPI Dashboard in Excel: the KPI dashboard in Excel
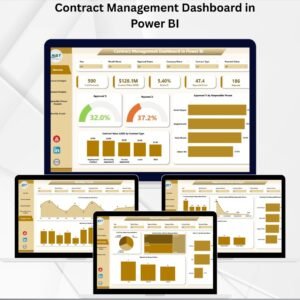
- Contract Management Dashboard in Power BI: a general contract dashboard in Power BI
- Healthcare Dashboard in Power BI: a wider healthcare view in Power BI
- Healthcare & Hospital Management Bundle: 8 healthcare templates in one download
Browse all Power BI KPI dashboards.
























Reviews
There are no reviews yet.