
Are you struggling to track geriatric care performance across multiple systems? Finding it difficult to monitor patient outcomes, treatment efficiency, and healthcare KPIs in one place?
Geriatric Care KPI Dashboard in Power BI!
This powerful, ready-to-use Power BI dashboard is designed specifically for hospitals, clinics, and geriatric care centers that want to improve patient care and operational efficiency. Instead of relying on scattered data and manual reports, this dashboard centralizes all your key performance indicators into one interactive and visually rich platform.
With real-time insights, dynamic visuals, and automated calculations, you can instantly evaluate performance, compare targets, and identify trends. As a result, healthcare providers can make faster, data-driven decisions and deliver better care to elderly patients.
🔑 Key Features of Geriatric Care KPI Dashboard in Power BI
✨ 🏥 Real-Time KPI Monitoring – Track patient care performance instantly with interactive visuals.
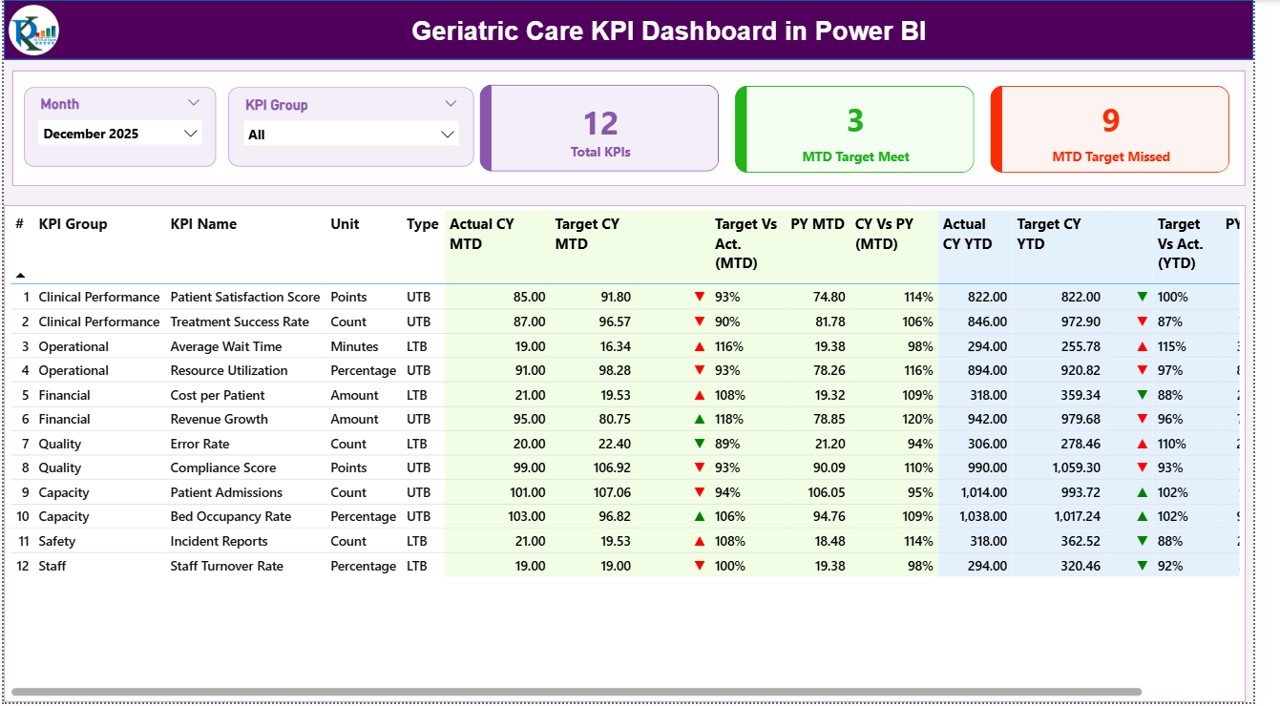
✨ 🎯 Target vs Actual Comparison – Compare actual performance against targets using MTD and YTD metrics.
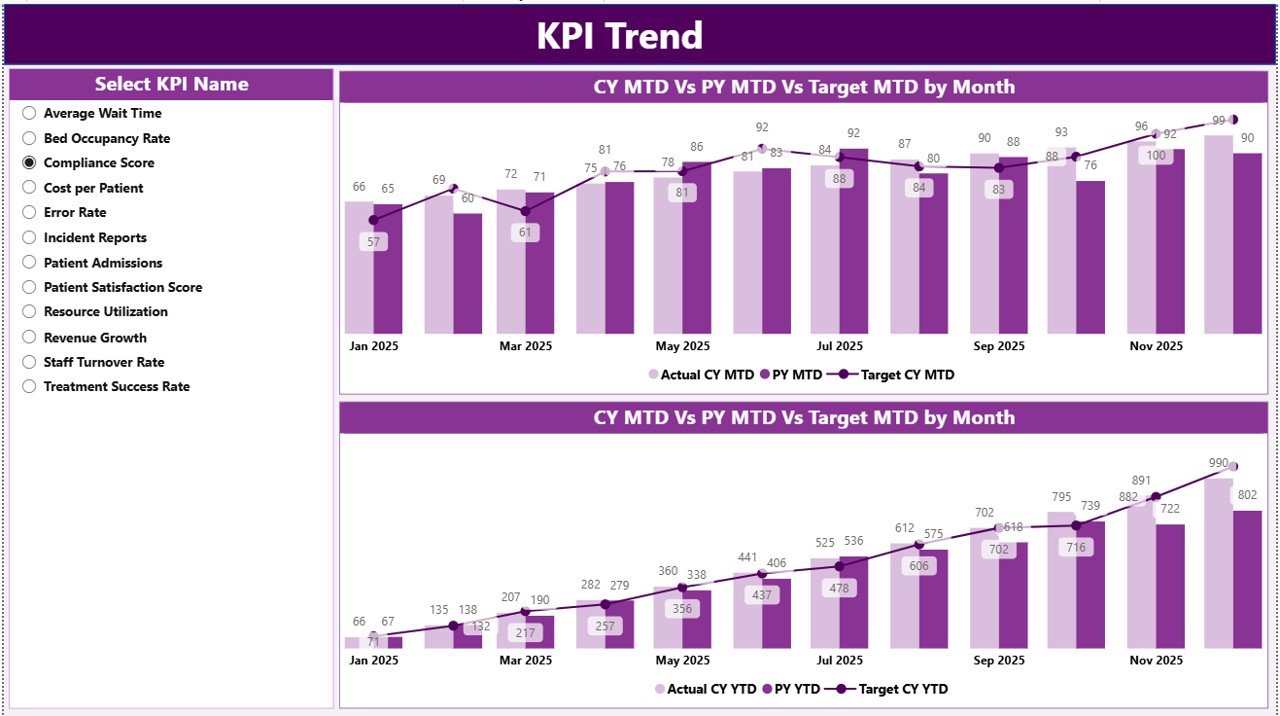
✨ 📊 KPI Trend Analysis – Analyze performance trends over time and compare with previous year data.
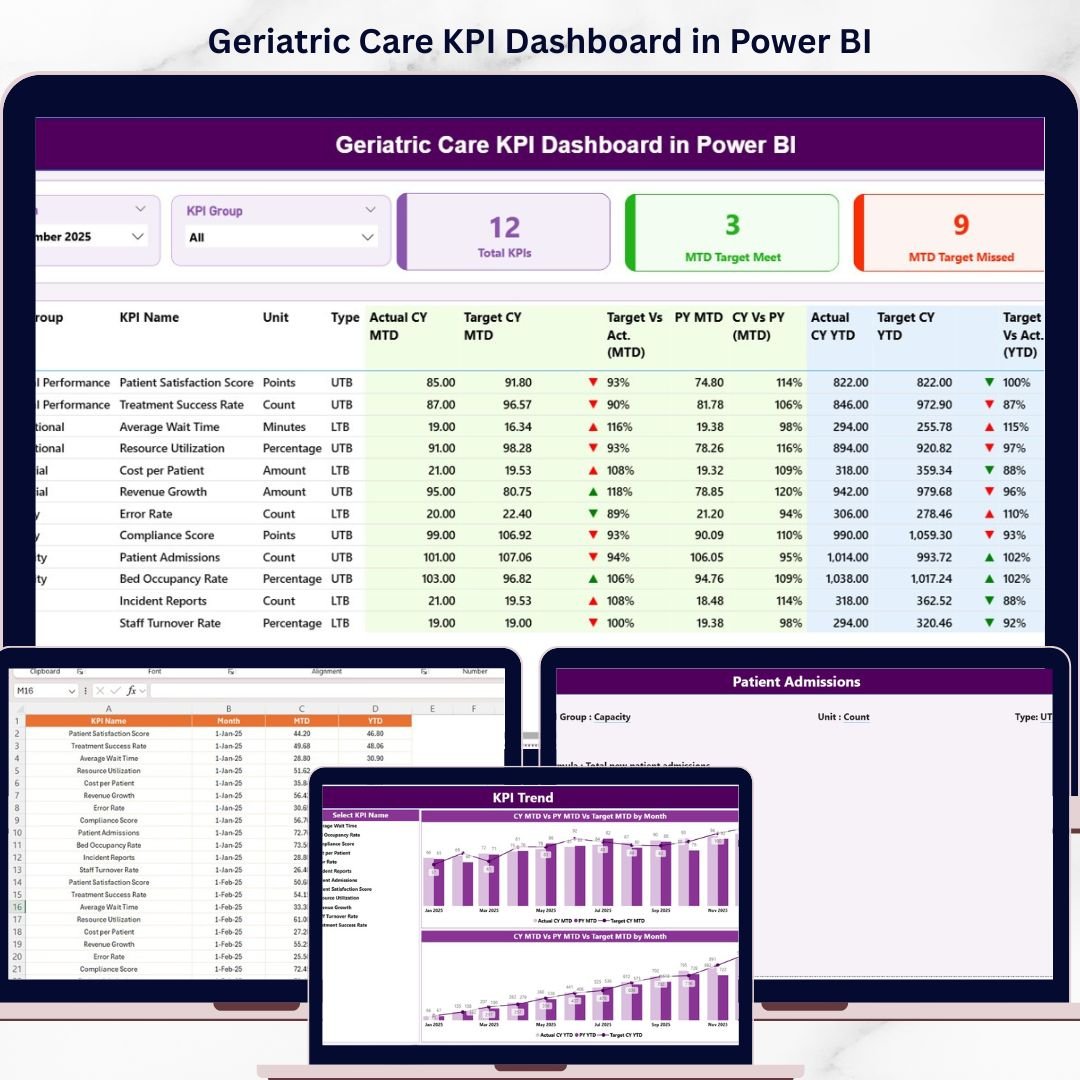
✨ 📋 Detailed KPI Table – Access complete KPI information including type, unit, and performance indicators.
✨ 🎛️ Interactive Slicers – Filter data by Month and KPI Group for deeper insights.
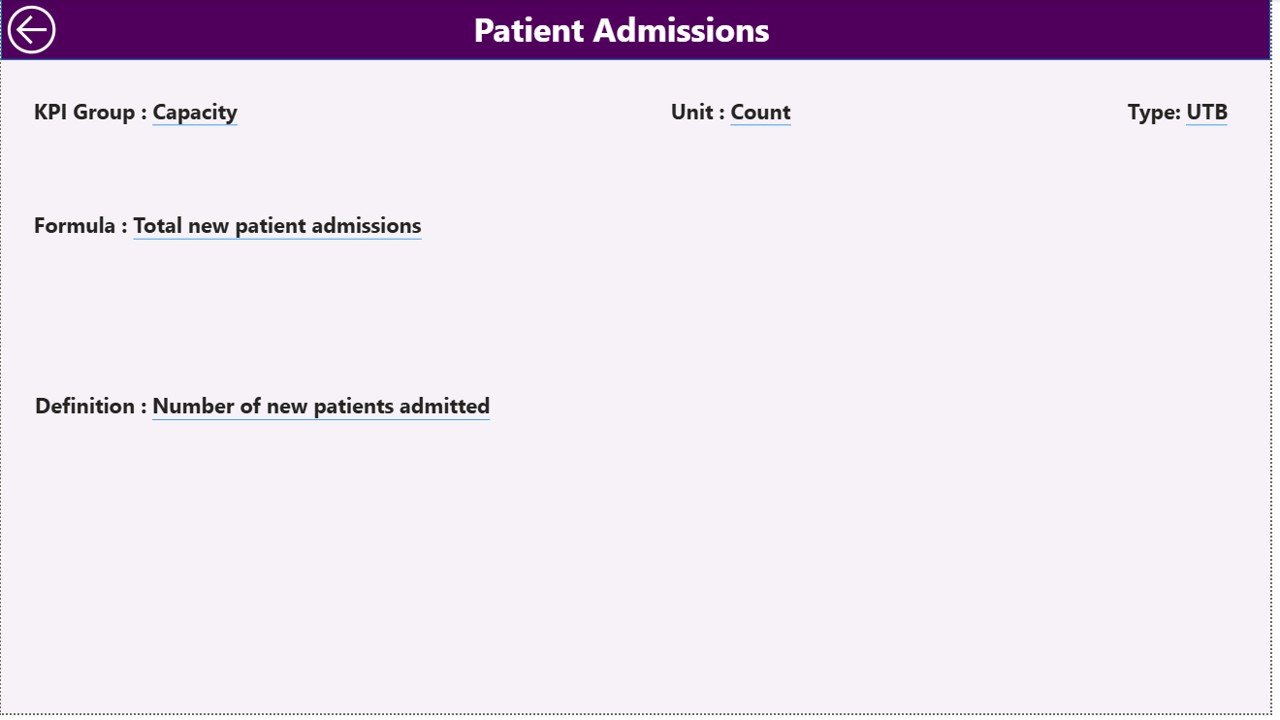
✨ 📘 KPI Definition Page – Understand KPI formulas and definitions with a dedicated drill-through page.
✨ ⚡ Automated Reporting – Eliminate manual reporting with auto-updating dashboards.
📂 What’s Inside the Geriatric Care KPI Dashboard in Power BI
📁 Summary Page – Central dashboard with KPI cards, slicers, and detailed KPI performance table.
📁 KPI Trend Page – Visualize MTD and YTD trends with combo charts (Actual vs Target vs Previous Year).
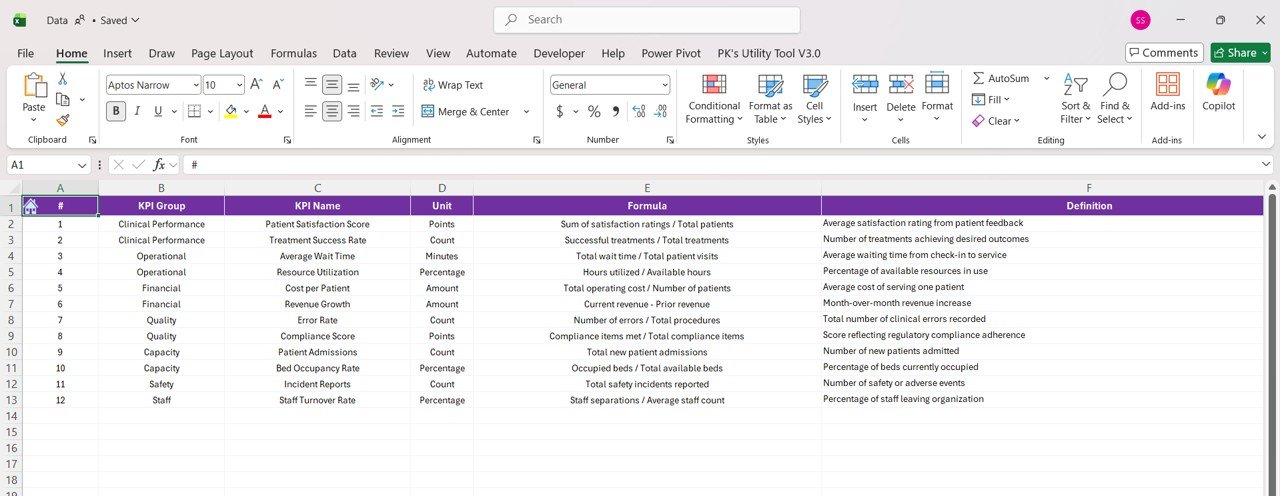
📁 KPI Definition Page – Drill-through page explaining KPI logic, formulas, and definitions.
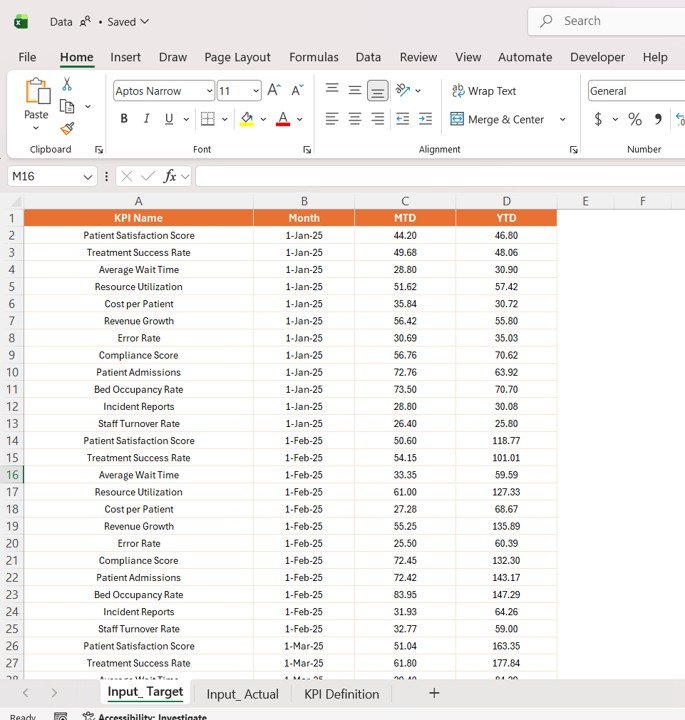
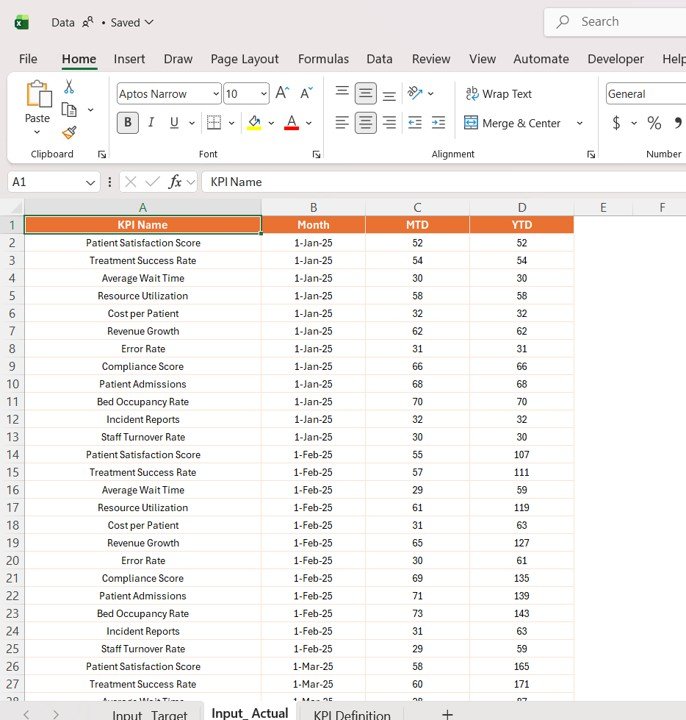
📁 Excel Data Source Files – Structured sheets for Actual, Target, and KPI Definitions.
📁 Dynamic Power BI Visuals – Fully automated charts and indicators for real-time insights.
🛠️ How to Use the Geriatric Care KPI Dashboard in Power BI
👉 Step 1: Enter KPI data into Excel input sheets (Actual & Target)
👉 Step 2: Define KPIs in the KPI Definition sheet
👉 Step 3: Load or refresh data in Power BI
👉 Step 4: Use slicers to filter KPIs by Month or Group
👉 Step 5: Analyze trends, performance, and care outcomes
💡 No advanced Power BI expertise required—simple, efficient, and powerful!
👥 Who Can Benefit from This Geriatric Care KPI Dashboard in Power BI
✔️ Hospitals & Clinics – Monitor geriatric care performance effectively
✔️ Healthcare Providers – Improve patient outcomes and service quality
✔️ Healthcare Analysts – Analyze complex healthcare data easily
✔️ Administrators – Enhance operational efficiency and reporting
✔️ Compliance Teams – Track KPIs and ensure healthcare standards
This dashboard is more than just a reporting tool—it’s a complete healthcare performance management solution. It helps you identify gaps in care, track improvements, and ensure high-quality services for elderly patients.
If you want to improve patient outcomes, enhance efficiency, and make smarter healthcare decisions, this dashboard is the perfect solution.
📖 Click here to read the Detailed blog post
🎥 Visit our YouTube channel to learn step-by-step video tutorials
Compatibility and Requirements
- Works in Power BI Desktop, which is free to download. Microsoft explains the install in Get Power BI Desktop.
- Your KPI data lives in Excel input sheets for Actual, Target and KPI Definitions, so you also need Excel to edit them.
Frequently Asked Questions
Which pages does the dashboard have?
Three pages: Summary, KPI Trend and KPI Definition. The download also includes the Excel data source files with sheets for Actual, Target and KPI Definitions.
Where do I enter my data?
Enter actual and target figures in the Excel input sheets and define each KPI in the KPI Definition sheet. Then refresh the data in Power BI.
Can I filter the KPIs?
Yes. The Summary page has slicers for Month and KPI Group.
Can I compare this year with last year?
Yes. The KPI Trend page shows MTD and YTD combo charts with Actual, Target and Previous Year.
How do I see how a KPI is calculated?
Drill through to the KPI Definition page, which explains the formula and definition for each KPI.
Is there an Excel or Google Sheets version?
There is an Excel version: Geriatric Care KPI Dashboard in Excel. For Google Sheets, see the Healthcare KPI Dashboard in Google Sheets.
Related Healthcare Templates
- Geriatric Care KPI Dashboard in Excel: the same KPIs in Excel
- Healthcare KPI Dashboard in Power BI: a general healthcare KPI view in Power BI
- Healthcare Dashboard in Power BI: an overview dashboard for healthcare data
- Healthcare Services Dashboard in Power BI: a service-level view in Power BI
- Healthcare Insurance KPI Dashboard Power BI: insurance KPIs in Power BI
Browse all Power BI KPI dashboards.