Transform the way you track virtual healthcare performance with the Telemedicine Platforms KPI Dashboard in Power BI — a powerful, ready-to-use solution built for modern healthcare organizations. In today’s fast-moving digital healthcare environment, telemedicine platforms handle a huge amount of performance data every day. From patient consultations and appointment success rates to response times, KPI targets, and growth trends, managing everything manually can quickly become overwhelming. That is why this dashboard is designed to simplify reporting, improve visibility, and help decision-makers take faster action with confidence. Instead of depending on scattered spreadsheets and time-consuming reports, you can monitor all critical KPIs in one centralized and interactive Power BI dashboard.
Key Feature of Telemedicine Platforms KPI Dashboard in Power BI
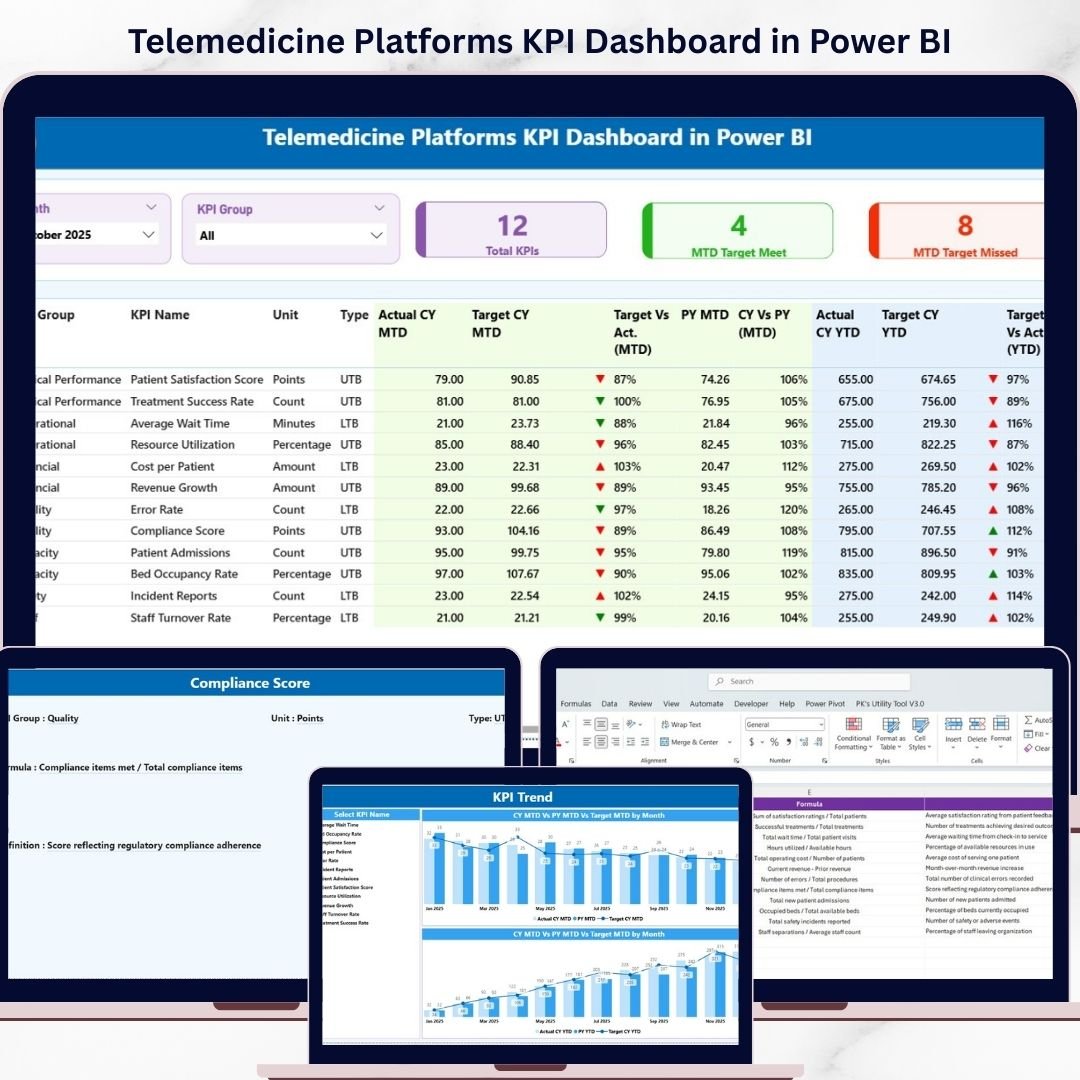
📊 3 Powerful Dashboard Pages – This dashboard includes three professionally designed pages: Summary Page, KPI Trend Page, and KPI Definition Page.
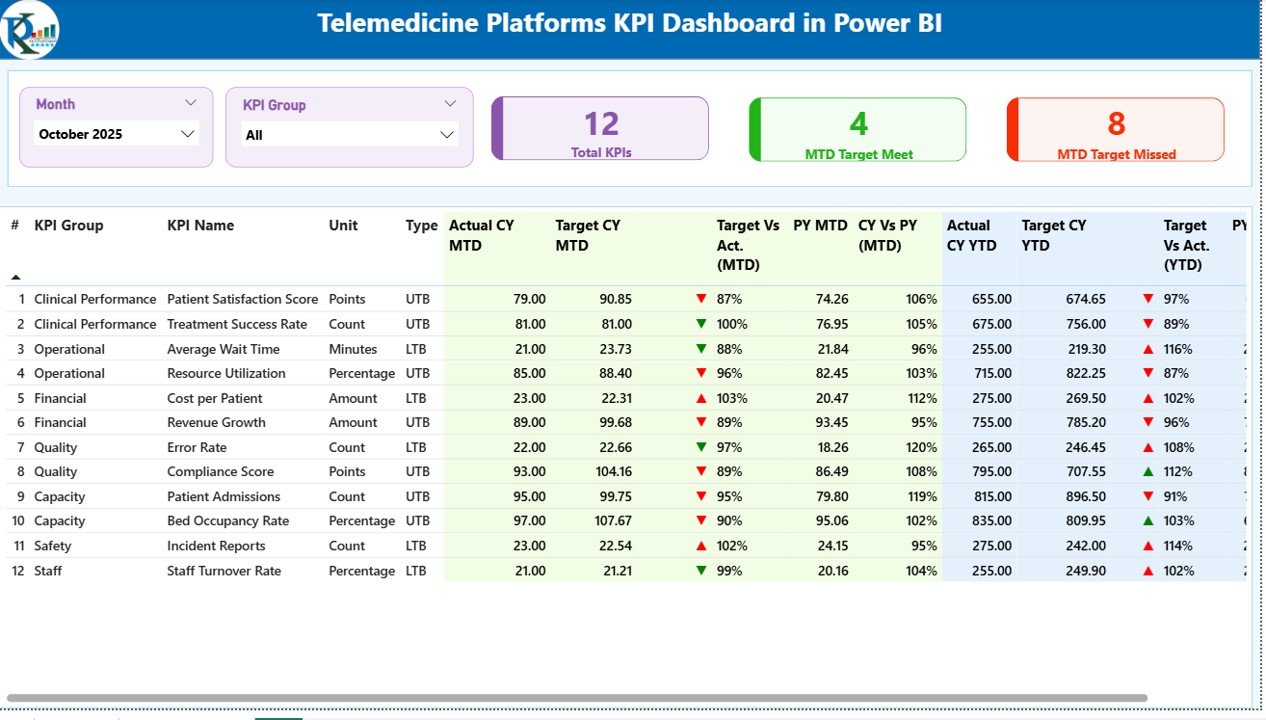
🎯 Complete KPI Summary View – The Summary Page gives you a full snapshot of KPI performance with month and KPI group slicers for easy filtering.
📌 Important KPI Cards – Quickly monitor Total KPIs Count, MTD Target Met Count, and MTD Target Missed Count in one glance.
📋 Detailed KPI Performance Table – Review KPI Number, KPI Group, KPI Name, Unit, KPI Type, Actual CY MTD, Target CY MTD, Previous Year MTD, Actual CY YTD, Target CY YTD, and more.
📈 Visual MTD and YTD Status Tracking – Instantly understand performance using status icons, target vs actual percentages, and current year vs previous year comparisons.
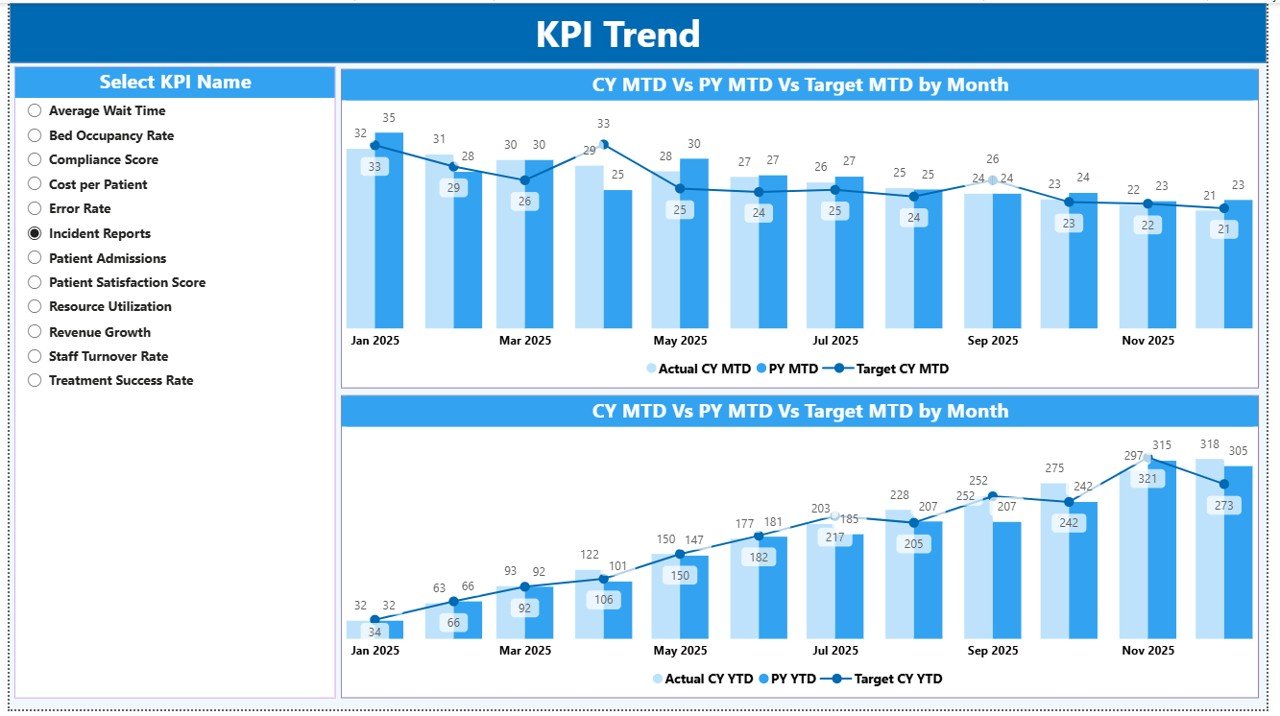
📉 KPI Trend Analysis Page – Analyze KPI performance over time using combo charts for MTD and YTD comparisons.
🔍 KPI Name Slicer for Focused Analysis – Filter individual KPIs and study their target achievement patterns and year-over-year movement.
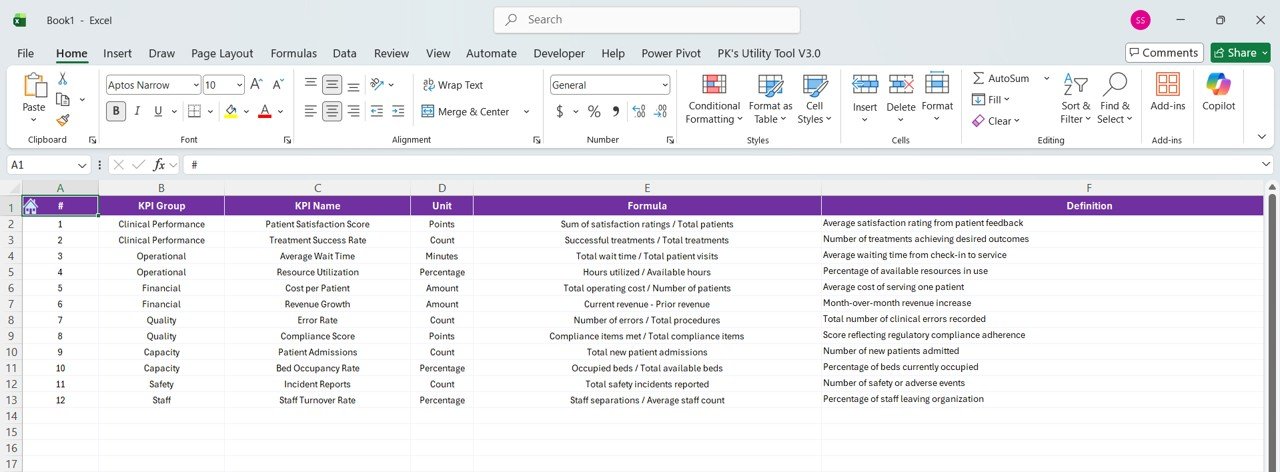
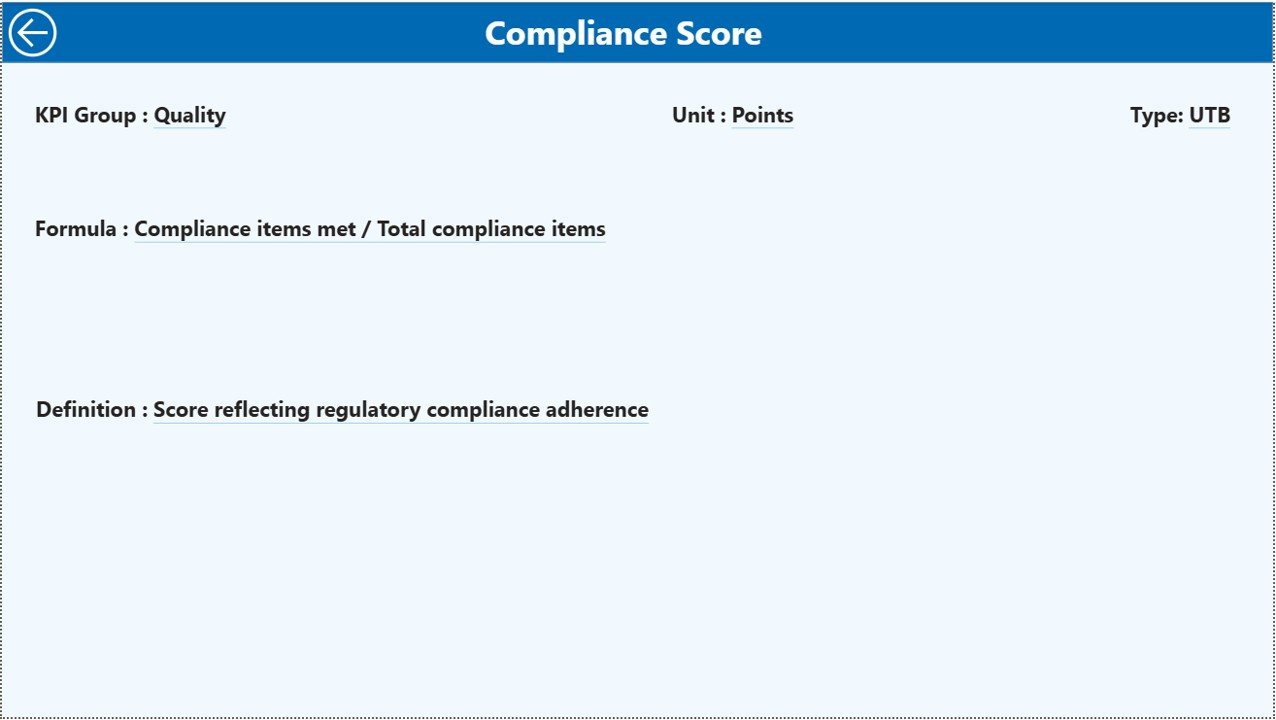
📘 KPI Definition Drill-Through Page – Understand each KPI clearly with dedicated fields for formula, definition, and KPI type.
⚡ Interactive Power BI Experience – Use dynamic visuals, slicers, and drill-through features to explore data in a faster and smarter way.
What’s Inside the Telemedicine Platforms KPI Dashboard in Power BI
Inside this digital product, you get a complete KPI monitoring dashboard designed for telemedicine and digital healthcare platforms. It is structured to help healthcare providers and managers track operational performance with clarity and speed.
The dashboard is built around three core analytical pages:
The Summary Page works as the main control center where users can filter by month and KPI group while reviewing KPI cards and a detailed KPI table with MTD and YTD insights.
The KPI Trend Page helps users study historical performance patterns through interactive combo charts that compare current year actuals, previous year actuals, and targets.
The KPI Definition Page is a drill-through page that provides full clarity on KPI formulas, definitions, and types, making it easier for teams to understand what each metric means.
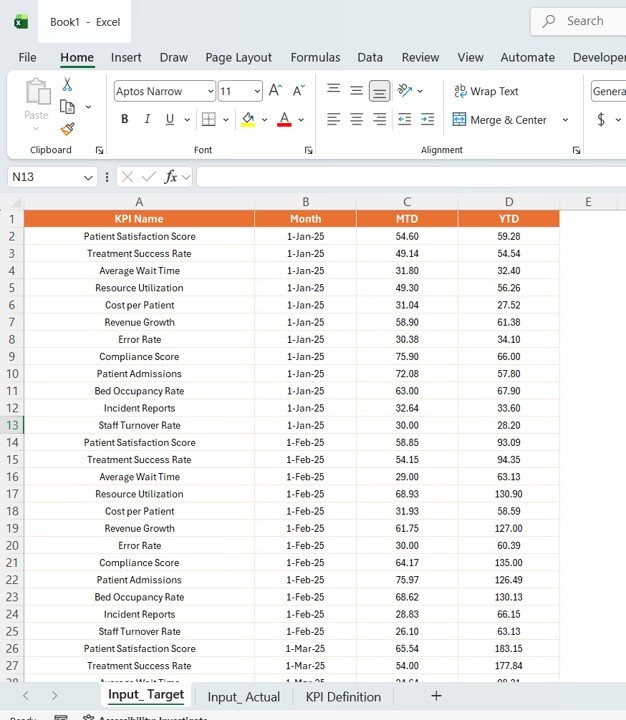
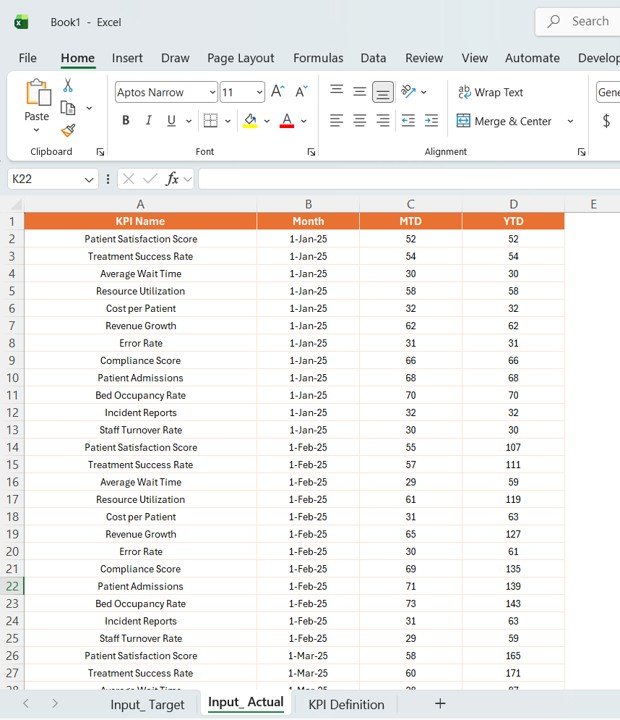
This dashboard also uses a structured Excel data source with:
-
Input_Actual Sheet for actual KPI values
-
Input_Target Sheet for target KPI values
-
KPI Definition Sheet for KPI details, formulas, units, and definitions
As a result, you get a professional, organized, and easy-to-manage KPI reporting system for telemedicine operations.
How to Use the Telemedicine Platforms KPI Dashboard in Power BI
🚀 Start by entering or connecting your data from the Excel source sheets. Add actual KPI values in the Input_Actual sheet, target values in the Input_Target sheet, and KPI metadata in the KPI Definition sheet.
📊 Refresh the Power BI dashboard so the visuals, KPI cards, and charts update automatically.
🎛️ Use the Month slicer and KPI Group slicer on the Summary Page to focus on the exact time period or KPI category you want to analyze.
📈 Move to the KPI Trend Page to review how a selected KPI is performing over time against target and previous year values.
📘 Use the drill-through feature from the Summary Page to open the KPI Definition Page and understand the formula, meaning, and KPI type behind each metric.
💡 Use the insights during team reviews, operational meetings, management discussions, and healthcare planning sessions to improve performance and decision-making.
Who Can Benefit from This Telemedicine Platforms KPI Dashboard in Power BI
🏥 Telemedicine Platform Owners who want complete KPI visibility in one dashboard
👨⚕️ Healthcare Operations Managers who need to monitor service quality and response time
📊 Healthcare Analysts who want better target vs actual tracking
🧠 Decision-Makers and Executives who need quick, visual, and accurate performance reporting
📋 Digital Health Consultants who support telehealth performance improvement
👩💼 Quality and Compliance Teams who monitor healthcare efficiency and KPI adherence
💻 Hospital and Clinic Management Teams who want to improve telemedicine service delivery
📈 Growth-Focused Healthcare Businesses looking to make smarter, data-driven decisions
This dashboard is a smart choice for any healthcare organization that wants to reduce manual reporting, improve KPI visibility, and strengthen telemedicine operations. It helps you move from scattered data to clear action. If you want faster reporting, better insights, and stronger performance tracking, this product is built for you.
Click hare to read the Detailed blog post
Explore the full blog post to understand the dashboard structure, KPI logic, benefits, and best practices in more detail.


