Pharmacies are at the heart of healthcare—dispensing medicines, safeguarding patient safety, managing compliance, and ensuring operational efficiency. But with increasing data complexity, relying on manual reporting is no longer enough. To stay competitive and compliant, pharmacies need a smarter solution.
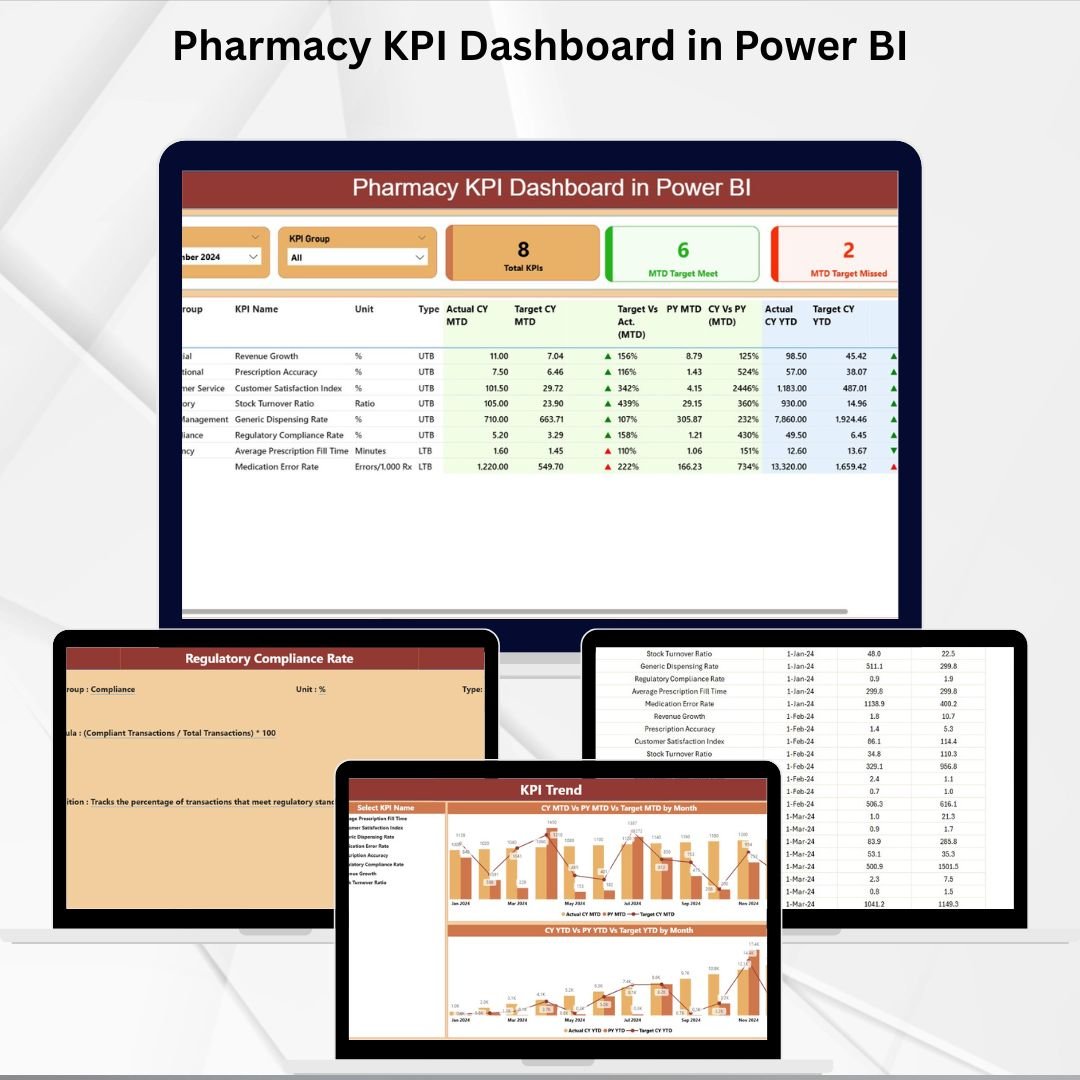
The Pharmacy KPI Dashboard in Power BI is a ready-to-use data visualization tool designed to help pharmacy owners, managers, and staff track performance, monitor compliance, and improve patient outcomes. By integrating pharmacy data into a single, interactive dashboard, this solution provides clarity and actionable insights that drive efficiency and growth.
✨ Key Features of the Pharmacy KPI Dashboard
-
📊 Three Powerful Pages – Summary, KPI Trend, and KPI Definition for complete visibility.
-
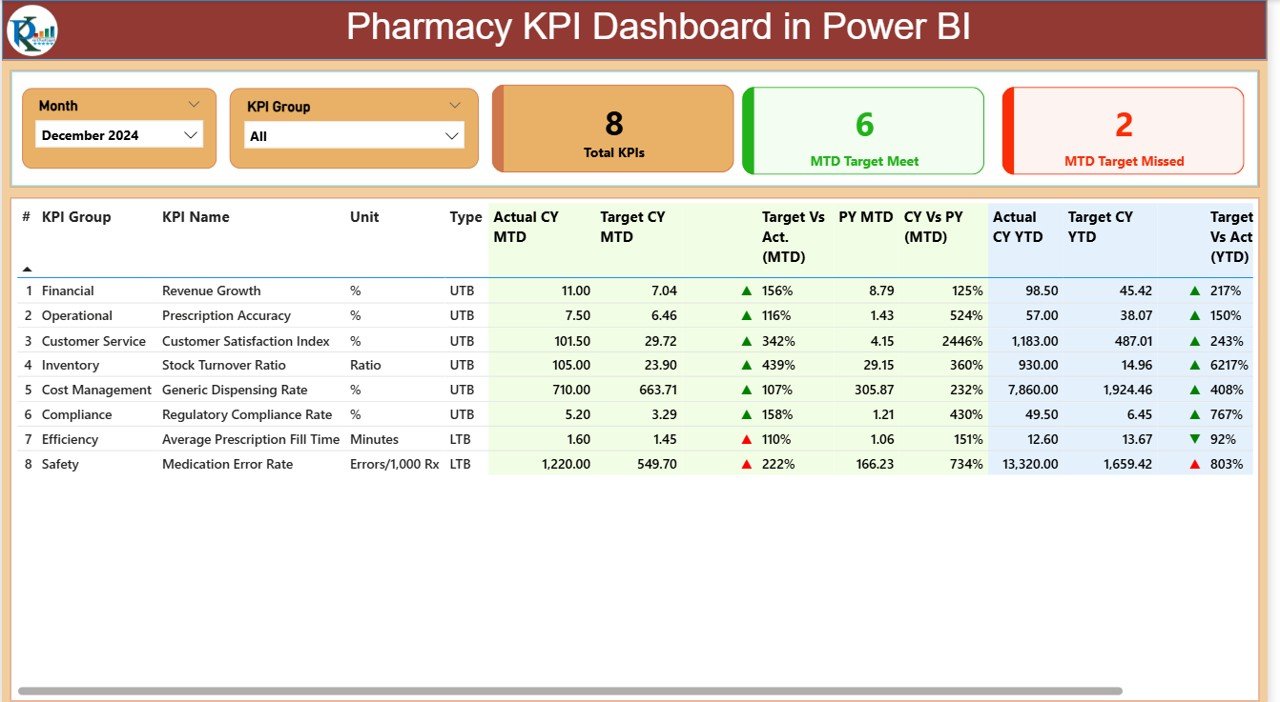
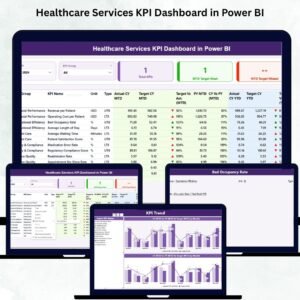
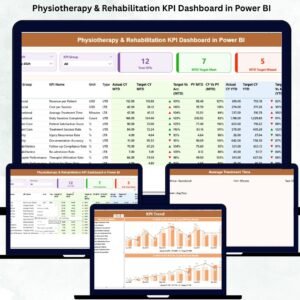
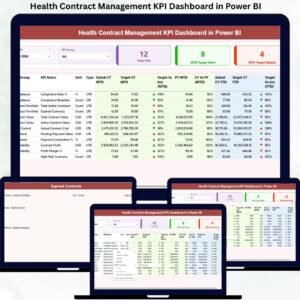
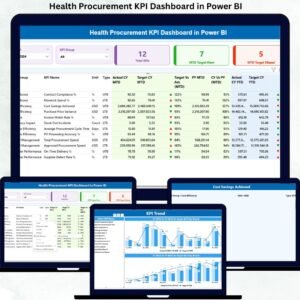
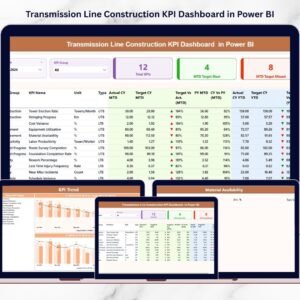
🎯 Summary Page – Provides KPI tables, MTD (Month-to-Date) & YTD (Year-to-Date) comparisons, quick insight cards, and green/red arrow icons for instant performance tracking.
-
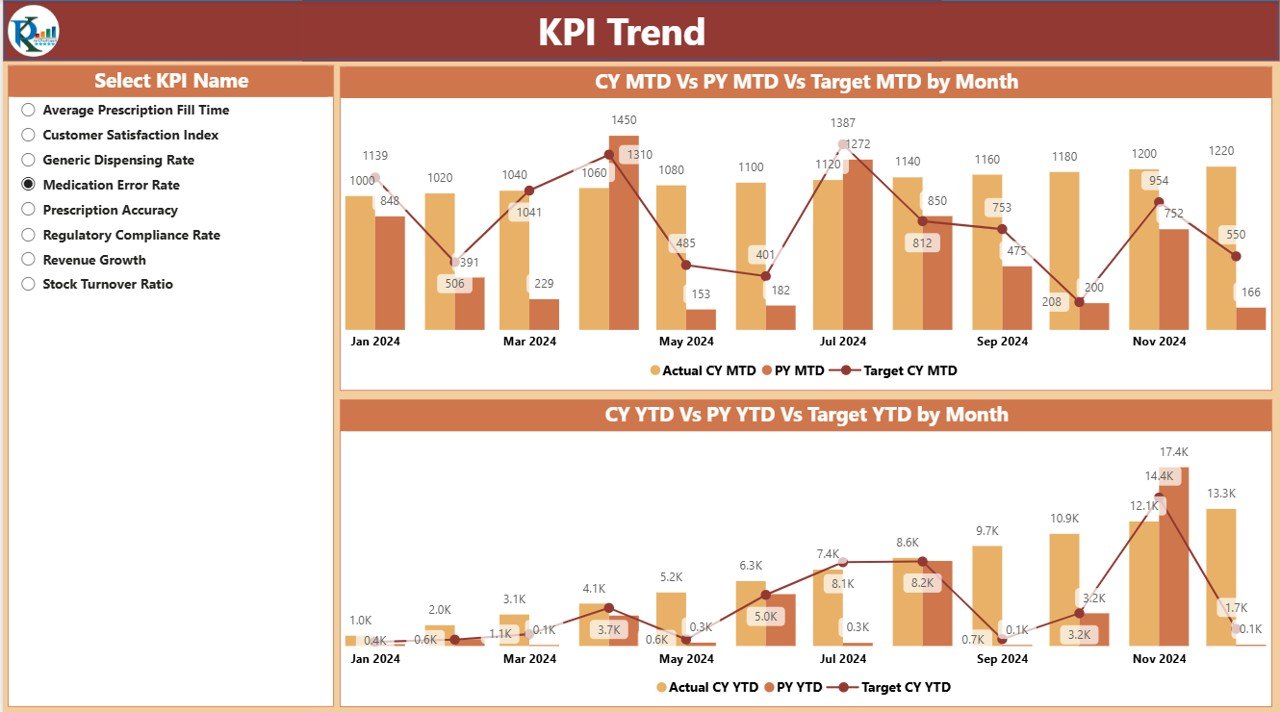
📈 KPI Trend Page – Combo charts to visualize trends across Actual, Target, and Previous Year data for both MTD and YTD.
-
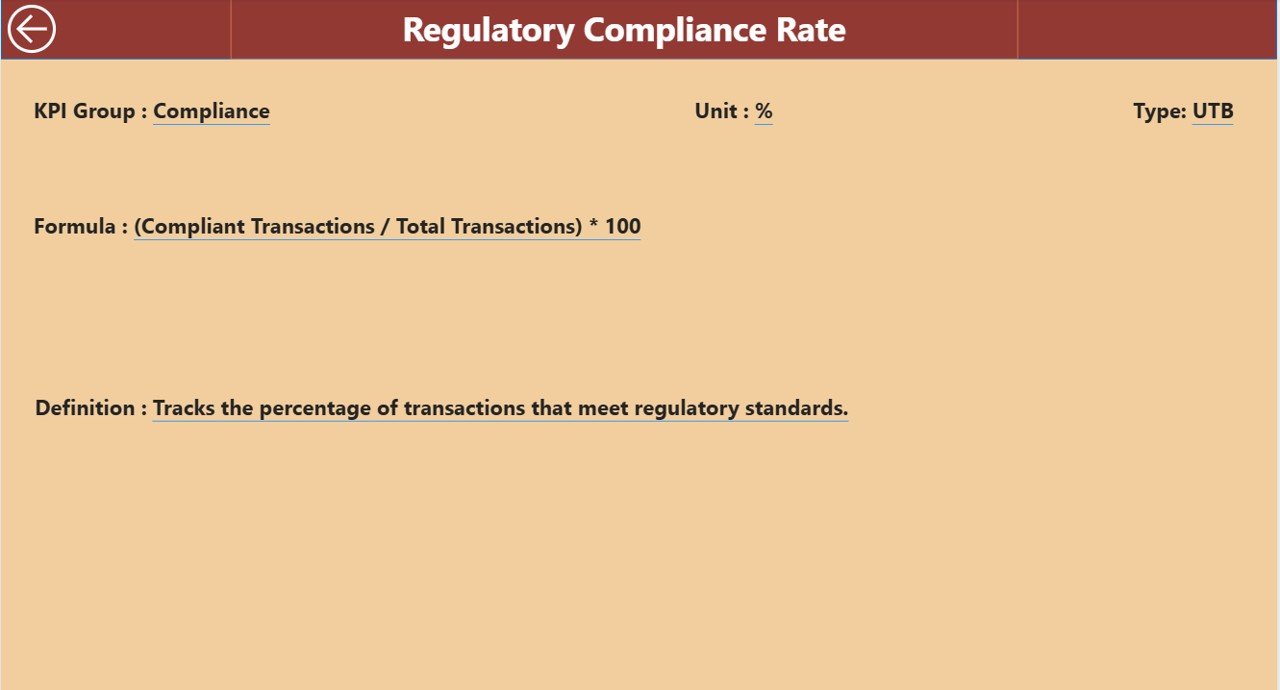
📖 KPI Definition Page – Drill-through details including formulas, definitions, units, and KPI types for accuracy and governance.
-
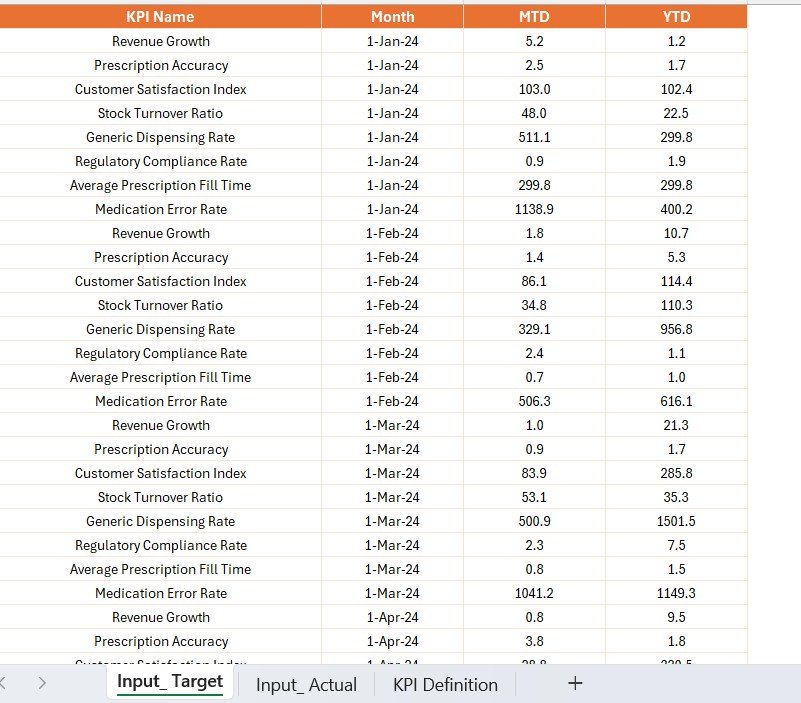
⚡ Excel-Integrated Data Source – Capture Actuals, Targets, and KPI Definitions in an easy-to-update Excel file.
-
🔍 Interactive Slicers – Filter by month, KPI group, or specific KPI for deeper analysis.
-
🛡️ Compliance-Friendly – Tracks KPIs that align with healthcare standards and safety requirements.
📦 What’s Inside the Dashboard
-
Summary Page
-
Month and KPI Group slicers.
-
KPI performance table with Actuals, Targets, % Achievements, and Previous Year comparisons.
-
Cards for quick stats: Total KPIs, MTD Target Met, MTD Target Missed.
-
-
KPI Trend Page
-
MTD and YTD combo charts showing Actual vs. Target vs. Previous Year.
-
Slicer to drill into specific KPIs.
-
Helps spot trends and areas needing attention.
-
-
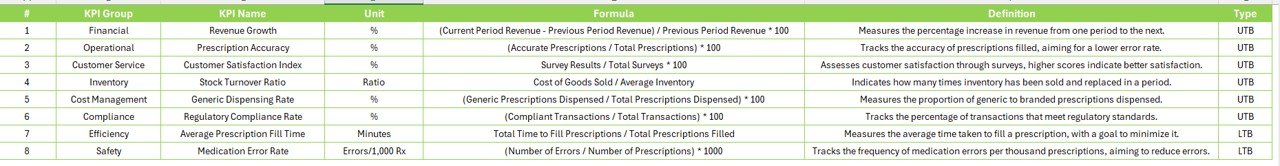
KPI Definition Page
-
KPI Number, Group, Name, Unit, Formula, Definition, and Type (UTB or LTB).
-
Ensures all stakeholders understand how KPIs are measured.
-
Drill-through from Summary Page for transparency.
-
-
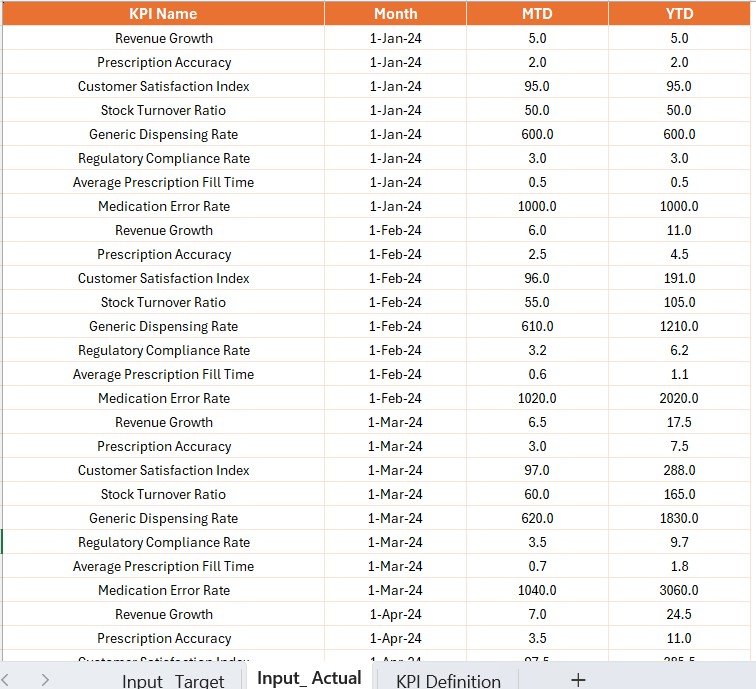
Excel Data Source
-
Input_Actual: Capture monthly and yearly actual performance.
-
Input_Target: Enter monthly and yearly targets for each KPI.
-
KPI Definition: Store detailed definitions, formulas, and unit details.
-
This structured approach makes updates simple and scalable, even for non-technical users.
🛠️ How to Use the Pharmacy KPI Dashboard
-
Update Data in Excel – Input monthly actuals, targets, and definitions.
-
Refresh Power BI – Sync data for real-time updates.
-
Navigate the Dashboard – Use slicers to filter by KPI group, month, or specific KPI.
-
Analyze Performance – Check variance vs. targets, trend analysis, and compliance tracking.
-
Drill Through for Details – View KPI definitions for governance and transparency.
-
Take Action – Use insights to improve efficiency, reduce costs, and enhance patient service.
👥 Who Can Benefit from This Dashboard
-
Pharmacy Owners & Managers – Track profitability, compliance, and performance trends.
-
Healthcare Administrators – Monitor KPIs for regulatory reporting and audit readiness.
-
Pharmacists – Ensure prescription accuracy, compliance, and patient satisfaction.
-
Financial Teams – Manage revenue, costs, and inventory efficiency.
-
Small & Large Pharmacies – Scalable for single-location pharmacies or large chains.
📖 Click here to read the Detailed blog post
🎥 Visit our YouTube channel to learn step-by-step video tutorials


Reviews
There are no reviews yet.