





In today’s regulatory environment, legal and compliance teams face increasing pressure to manage resources effectively, ensure accountability, and maintain transparency across operations. From monitoring compliance activities to analyzing department-wise contributions, businesses need a structured way to allocate resources, track performance, and align with both internal and external regulations.
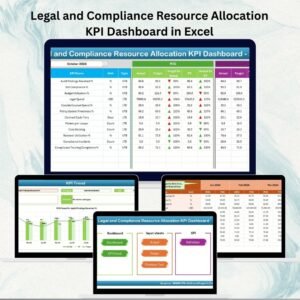
That’s where our Legal and Compliance Resource Allocation KPI Dashboard in Excel becomes indispensable. Built with automation, interactive charts, and structured data sheets, this ready-to-use tool transforms the way compliance and legal professionals monitor key performance indicators (KPIs).
Instead of juggling multiple spreadsheets, this dashboard consolidates everything into a single, easy-to-navigate Excel file—empowering decision-makers to track performance in real time and make informed resource allocation choices.
✨ Key Features of the Dashboard
🏠 Home Sheet
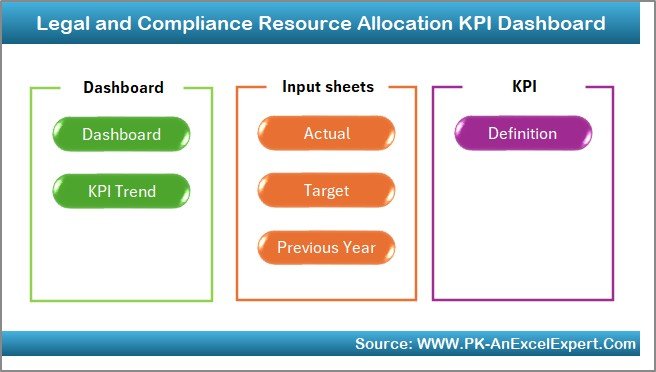
A clean index page with 6 navigation buttons.
One-click access to Dashboard, KPI Trends, Actual Numbers Input, Target Sheet, Previous Year Numbers, and KPI Definitions.
Simplifies user navigation and saves time.
📊 Dashboard Sheet

The central hub of the tool.
Select a month from the drop-down (cell D3) to update all numbers instantly.
Displays:
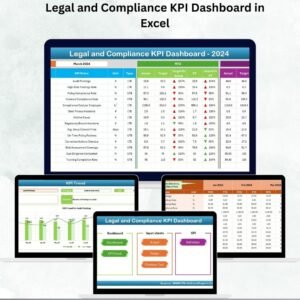
MTD (Month-to-Date) Actual, Target, and Previous Year Data
YTD (Year-to-Date) Actual, Target, and Previous Year Data
Visual Target vs. Actual and PY vs. Actual with conditional formatting arrows (green for improvement, red for gaps).
Offers instant visibility into compliance performance.
📈 KPI Trend Sheet
Analyze performance trends for individual KPIs.
Drop-down selection (cell C3) to choose KPIs.
Shows: KPI Group, Unit, Type (UTB – Upper the Better, LTB – Lower the Better), Formula, and Definition.
MTD and YTD trend charts to visualize progress over time.
📑 Actual Numbers Input Sheet
Enter monthly MTD and YTD actual performance data.
Linked to cell E1 for selecting the reporting year/month.
Keeps reporting structured and error-free.
🎯 Target Sheet
Set compliance benchmarks for MTD and YTD.
Helps managers compare against realistic goals and resource plans.
📂 Previous Year Numbers Sheet
Store last year’s compliance data for accurate benchmarking.
Enables year-over-year comparison to identify improvements or recurring issues.
📘 KPI Definition Sheet
Acts as a compliance KPI dictionary.
Includes KPI Name, Group, Unit, Formula, and Definition.
Ensures uniform understanding across departments and stakeholders.
📦 What’s Inside the Dashboard?
7 structured worksheet tabs (Home, Dashboard, KPI Trend, Actual Numbers Input, Target, Previous Year Numbers, KPI Definition).
Automated performance tracking (MTD & YTD).
Conditional formatting visuals with up/down arrows for quick insights.
User-friendly design—requires only basic Excel knowledge.
⚙️ How to Use the Dashboard
Start at the Home Sheet – Quickly navigate to your preferred section.
Input Actual Data – Enter monthly compliance metrics in the Actual Numbers Input sheet.
Set Targets – Add benchmarks in the Target sheet for fair comparisons.
Compare Results – Review Dashboard visuals and arrows for Target vs Actual and PY vs Actual analysis.
Track Trends – Use KPI Trend sheet to identify performance patterns.
Review Definitions – Check KPI definitions for clarity and consistency.
👥 Who Can Benefit?
Compliance Officers & Legal Teams – Monitor regulatory adherence.
HR & Audit Teams – Track compliance resource allocation.
Senior Executives – Gain transparent insights for strategic decisions.
Small & Medium Enterprises – Cost-effective compliance monitoring without expensive BI software.
Large Organizations – Benchmark department-level compliance across multiple years.
✅ Advantages of Using This Dashboard
Centralized reporting for legal & compliance KPIs.
Saves time with automated updates.
Improves accuracy by reducing manual entry errors.
Audit-ready reports with historical comparisons.
Scalable & customizable for your organization’s needs.
Cost-effective alternative to complex compliance systems.
📌 Best Practices
Update actuals monthly for accurate tracking.
Review trends in KPI Trend sheet to spot risks early.
Use KPI Definitions to align departments.
Maintain historical data for effective audit preparation.
Train key staff on dashboard navigation.
📖 Click here to read the Detailed Blog Post
🎥 Visit our YouTube channel to learn step-by-step video tutorials
Watch the step-by-step video tutorial:
Compatibility and Requirements
- Works in Microsoft Excel desktop (Excel 2016 or later, or Microsoft 365).
- You pick the month and the KPI from dropdown lists. Microsoft explains them in Create a drop-down list.
Frequently Asked Questions
Which worksheets are included?
Seven tabs: Home, Dashboard, KPI Trend, Actual Numbers Input, Target, Previous Year Numbers and KPI Definition.
How do I change the month shown on the Dashboard?
Select a month from the dropdown in cell D3 on the Dashboard sheet. The MTD and YTD figures update for that month.
How do I enter my own data?
Type your monthly MTD and YTD actuals in the Actual Numbers Input sheet and your benchmarks in the Target sheet. Last year’s figures go in the Previous Year Numbers sheet.
How do I see the trend for one KPI?
Open the KPI Trend sheet and choose a KPI from the dropdown in cell C3. It shows the KPI group, unit, type (UTB or LTB), formula and definition, with MTD and YTD trend charts.
Is there a Power BI version or a similar dashboard?
For a broader view of legal compliance metrics, see the Legal Compliance KPI Dashboard in Excel and the Legal Compliance KPI Dashboard in Power BI.
Related Legal and Resource Allocation Templates
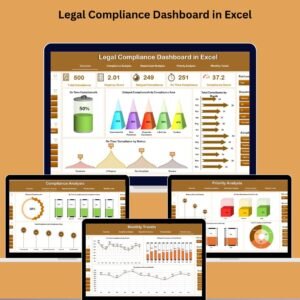
- Legal Compliance KPI Dashboard in Excel: KPIs for overall legal compliance
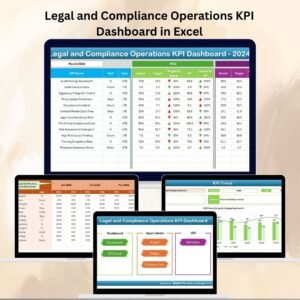
- Legal and Compliance Operations KPI Dashboard in Excel: the operations view for the same team
- Resource Allocation KPI Dashboard in Excel: resource allocation KPIs for any department
- Resource Allocation KPI Dashboard in Power BI: the Power BI edition
- Legal Compliance Calendar in Excel: a calendar for compliance dates
Browse all Excel KPI dashboards.
















Reviews
There are no reviews yet.