

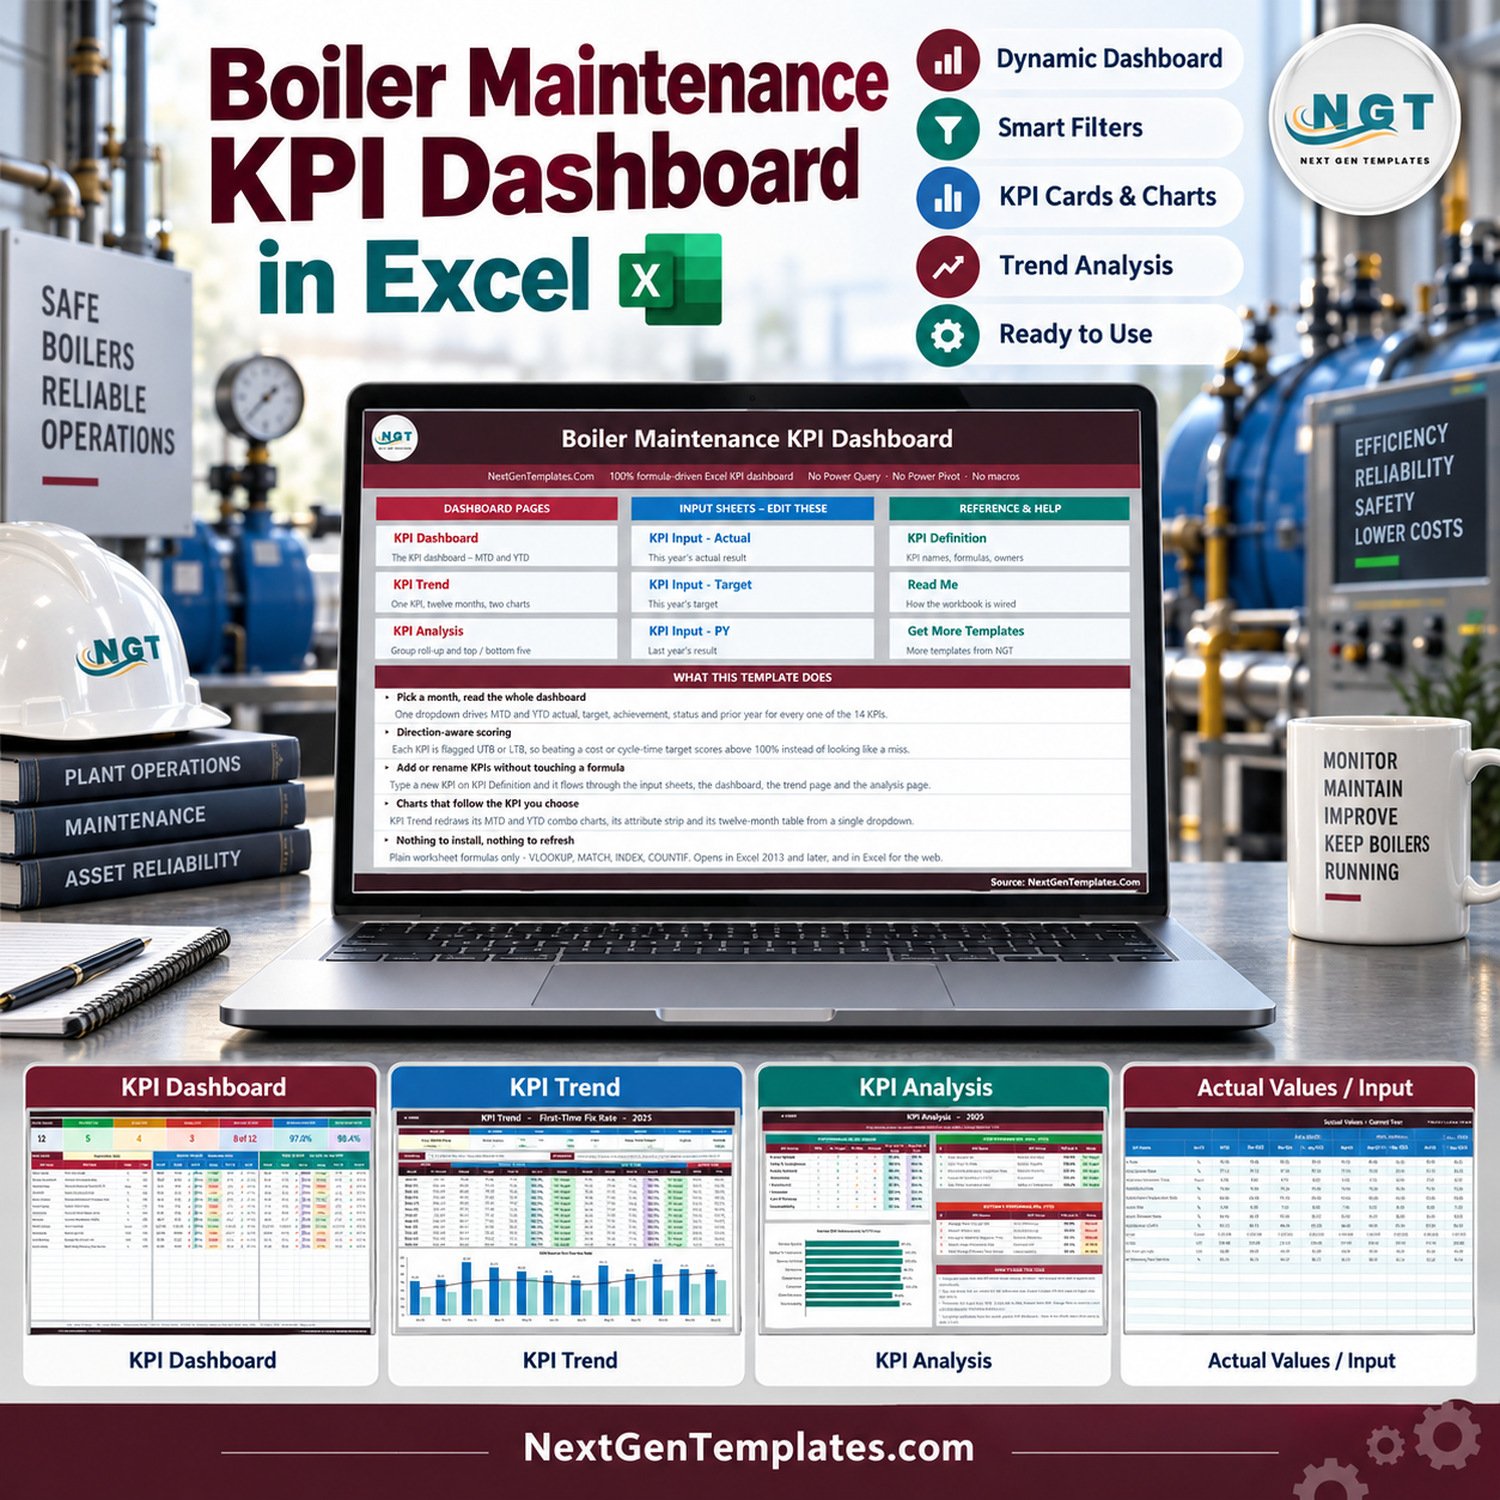
The Boiler Maintenance KPI Dashboard in Excel turns twelve monthly boiler-service KPIs into one readable MTD and YTD management view. Pick a month and the workbook recalculates actuals, targets, achievement, status, prior-year results and movement for every KPI. It ships with sample data, three editable input sheets, direction-aware UTB/LTB scoring, a twelve-month trend page and a top/bottom-five analysis page. There are no macros, no Power Query and no add-ins; every result uses ordinary worksheet formulas. Download once, replace the sample figures with your own, and keep a consistent monthly review without a recurring software subscription.
Dashboard, not scorecard: this product is the multi-page KPI dashboard with month selection, MTD/YTD comparisons, trend charts and KPI-group analysis. The separate Boiler Maintenance KPI Scorecard in Excel is a different, more compact scorecard product.
Key Features of the Boiler Maintenance KPI Dashboard in Excel
- Twelve boiler-service KPIs across service quality, safety and compliance, service delivery, workforce, commercial performance, customer experience, cost efficiency and sustainability.
- One month selector drives the KPI Dashboard and KPI Analysis pages.
- MTD and YTD reporting together with actual, target, achievement, status, prior year and year-on-year movement.
- Direction-aware scoring uses UTB or LTB per KPI, so lower response time or parts cost can score correctly.
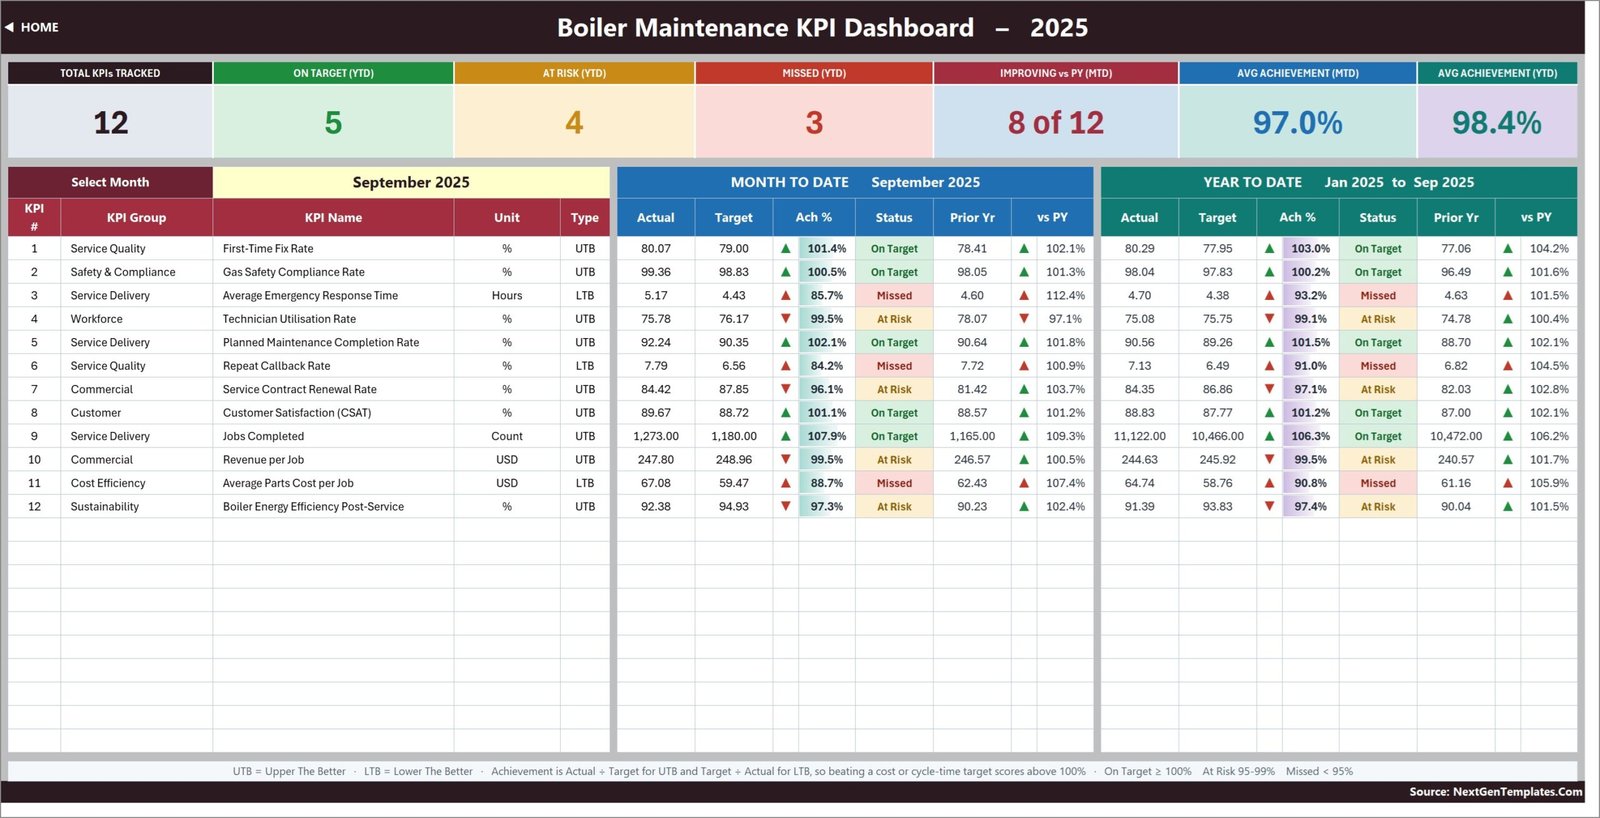
- Seven summary cards show KPIs tracked, on target, at risk, missed, improving versus prior year, and average MTD/YTD achievement.
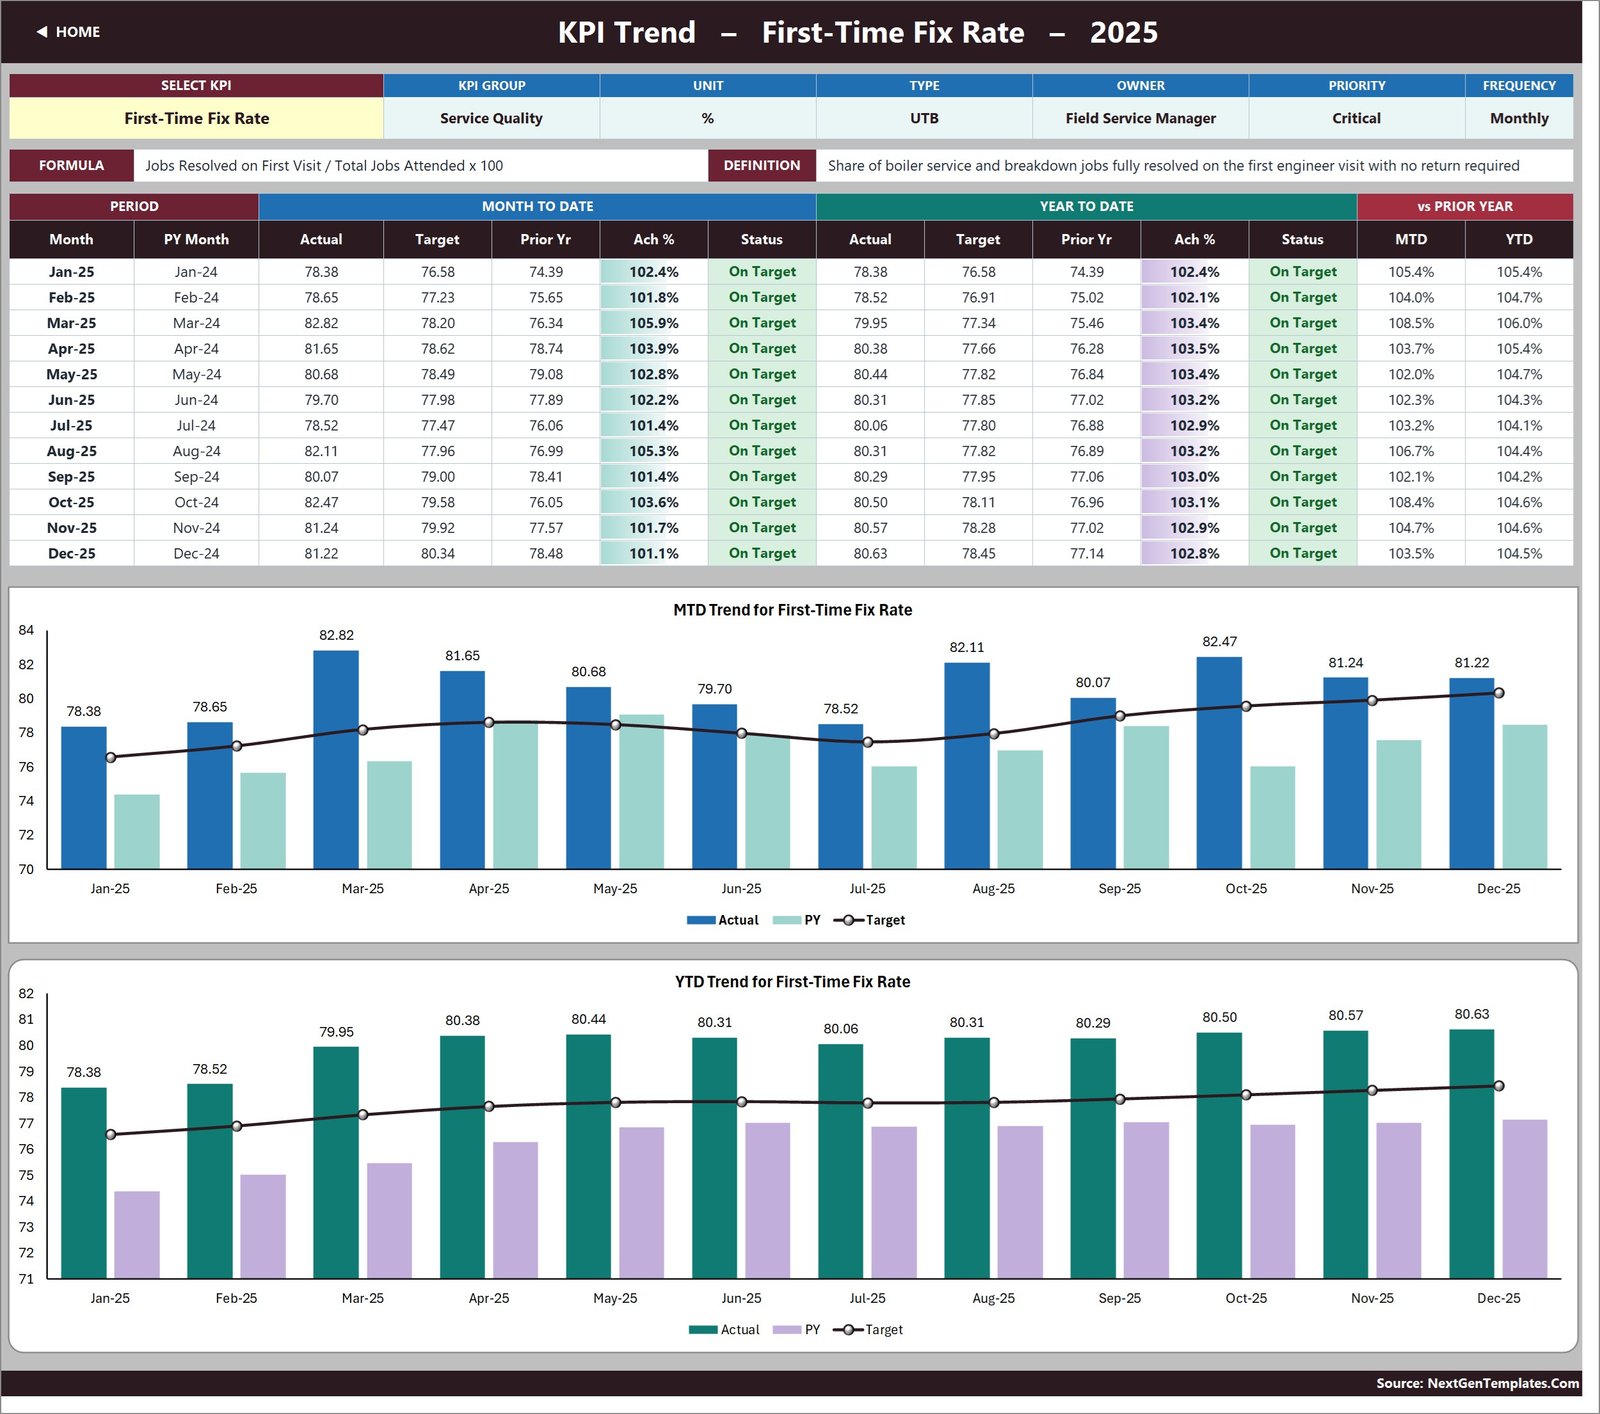
- KPI Trend page follows the selected metric with attributes, formula, definition, a twelve-month table and two charts.
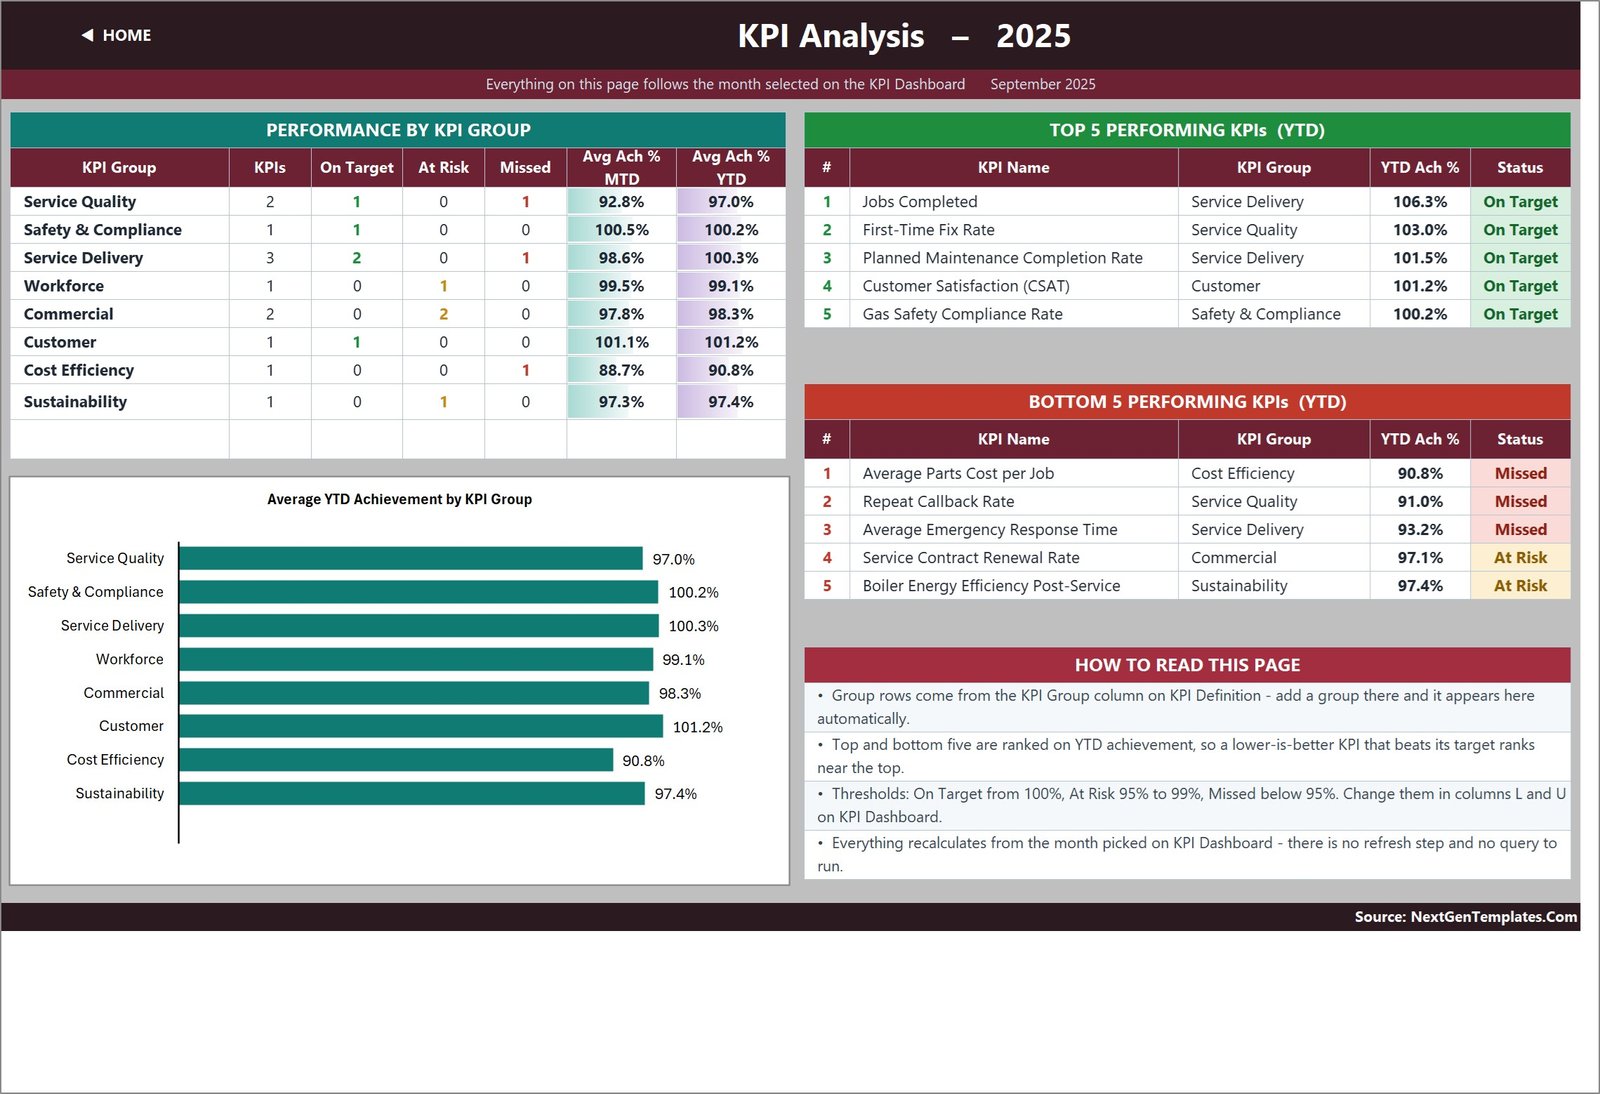
- KPI Analysis page rolls results up by group and lists the top five and bottom five YTD performers.
- Editable master KPI list lets you add, rename or remove KPIs without changing dashboard formulas; the workbook is wired for up to 22 KPI rows.
- Plain .xlsx file opens in Excel 2013 or later and Excel for the web.
What’s Inside the Boiler Maintenance KPI Dashboard in Excel
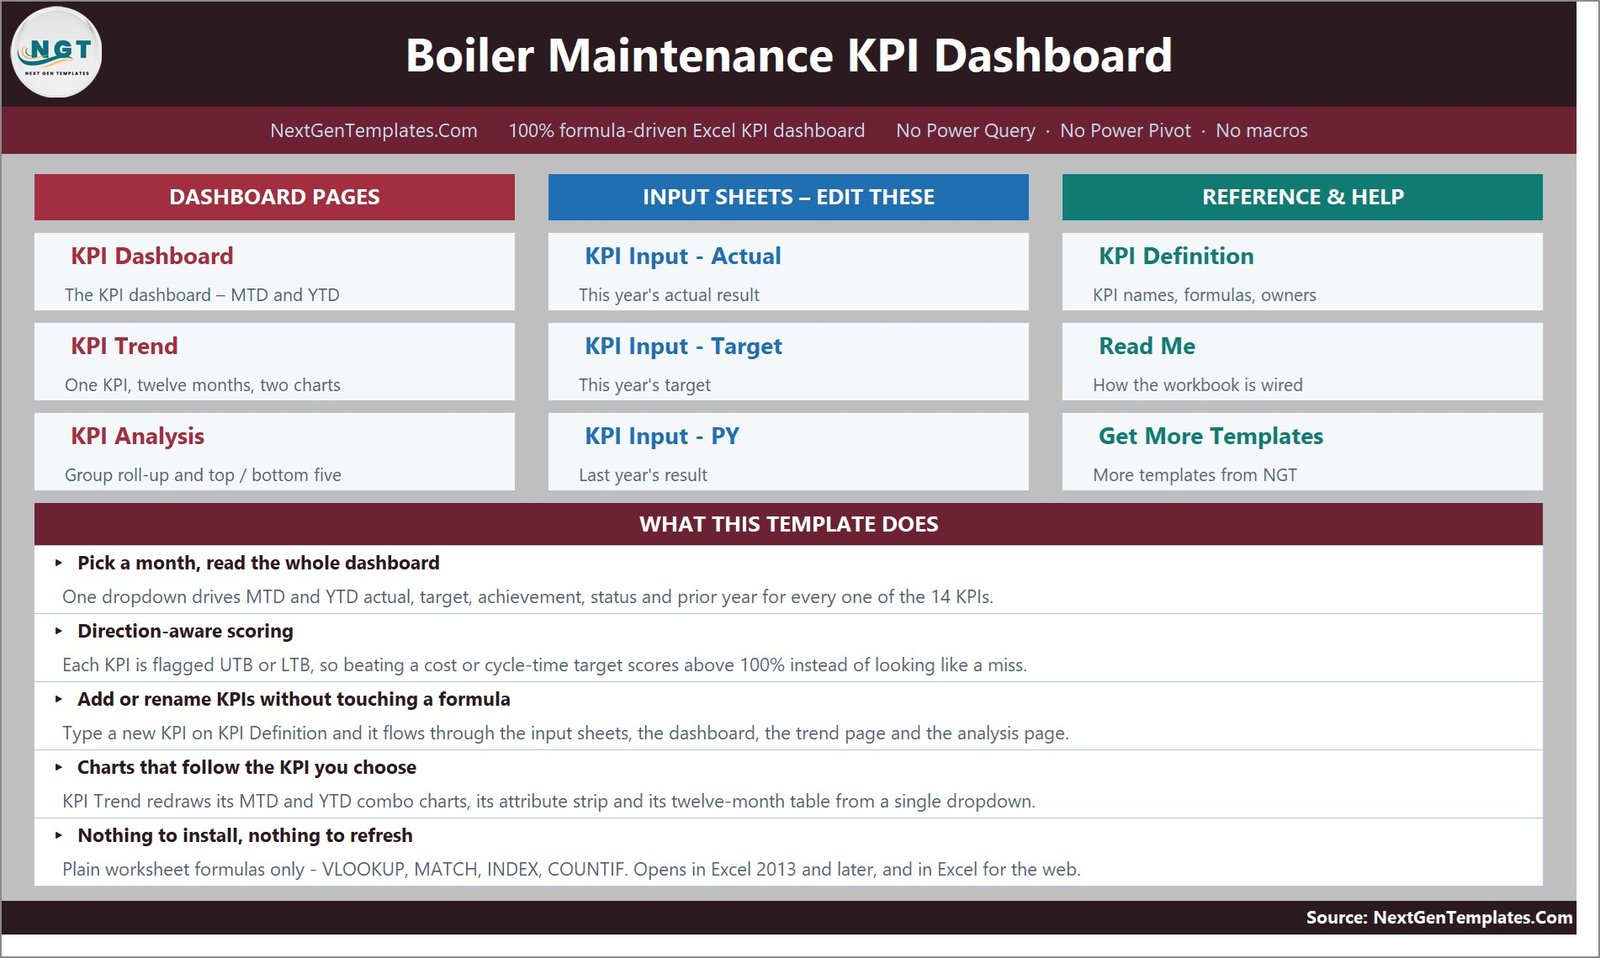
The workbook contains a navigation Home sheet plus the working pages below:
- KPI Dashboard: a month-driven table for twelve KPIs with MTD and YTD actuals, targets, achievement, status, prior-year figures and comparison arrows.
- KPI Trend: one selected KPI at a time, with group, unit, type, owner, priority, frequency, formula, definition, monthly results and MTD/YTD charts.
- KPI Analysis: group performance, average achievement, an achievement bar chart, and top/bottom-five YTD rankings.
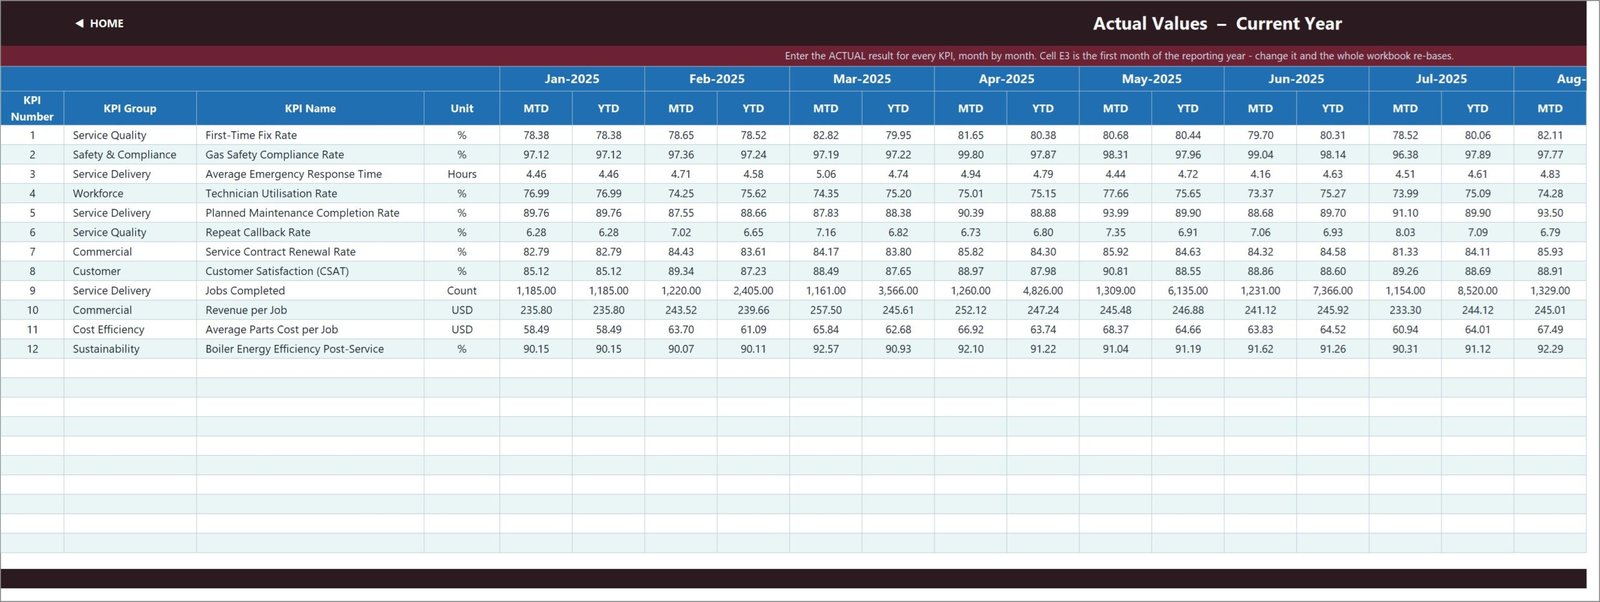
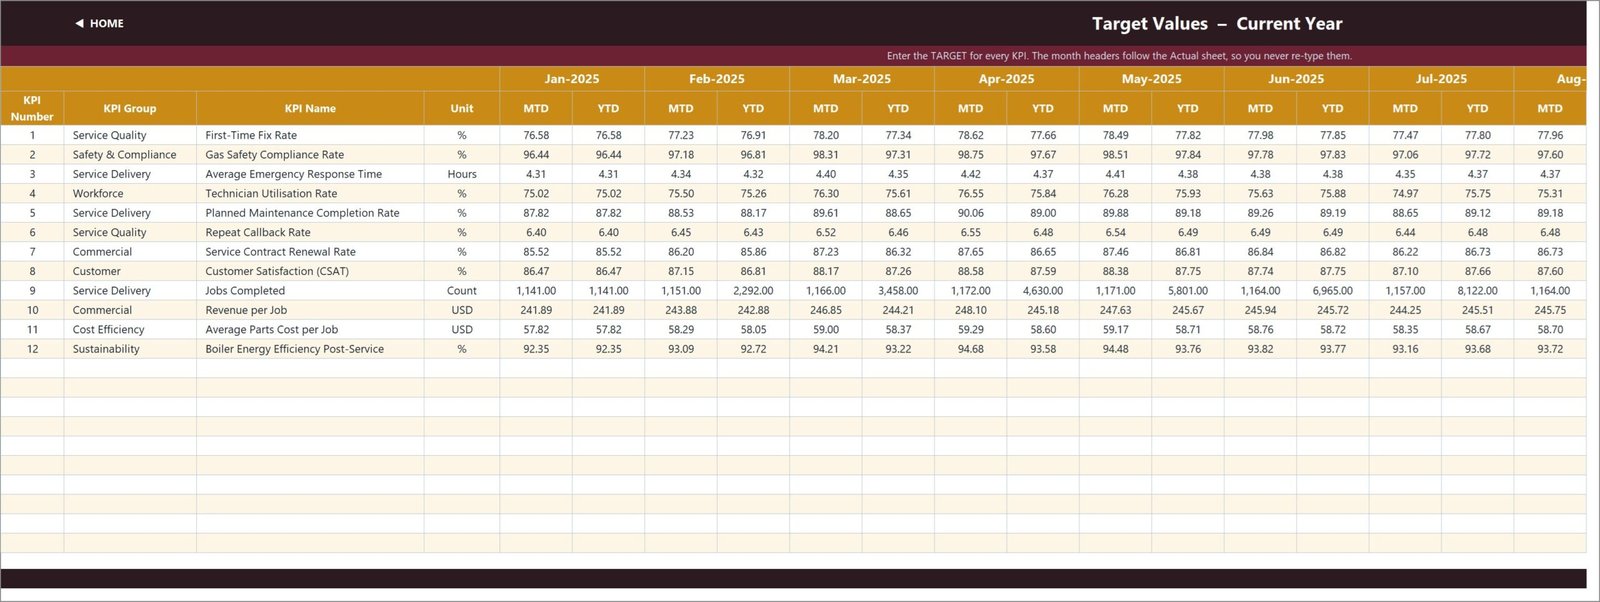
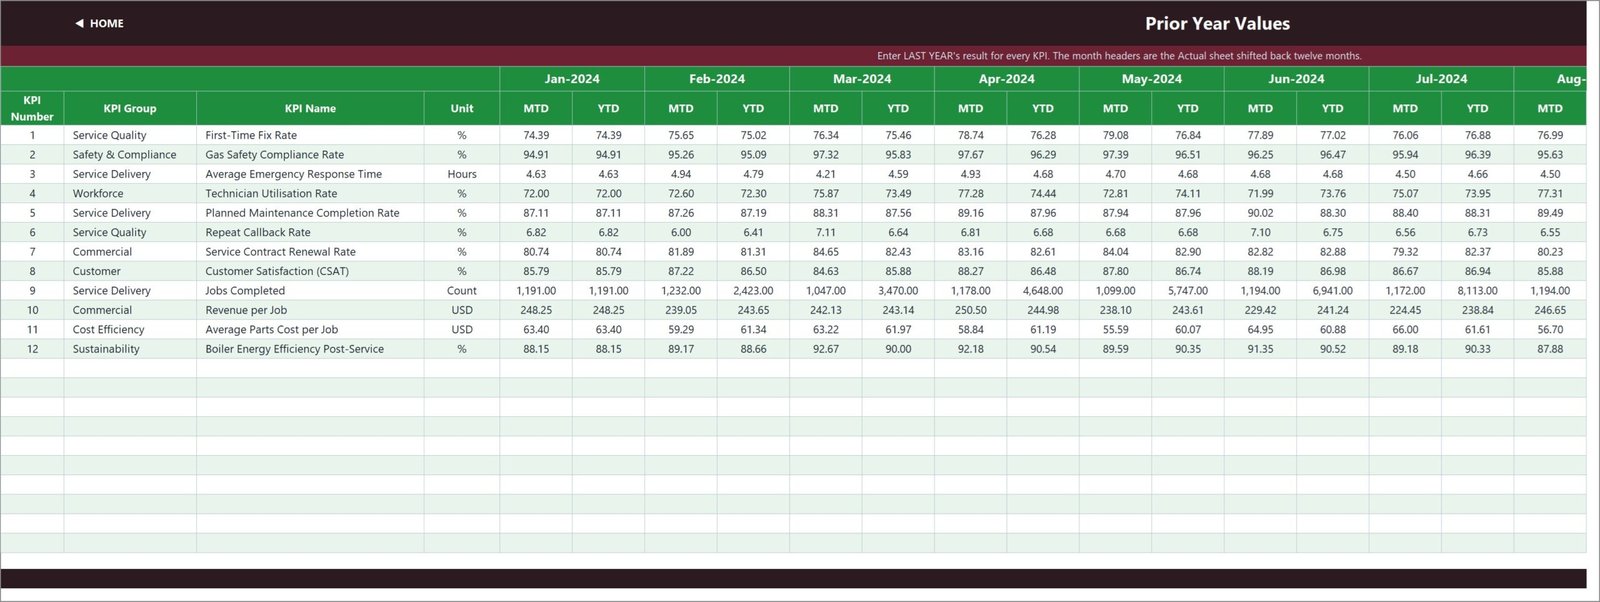
- KPI Input – Actual, Target and PY: the three sheets you normally edit. Each holds MTD and YTD values for every month.
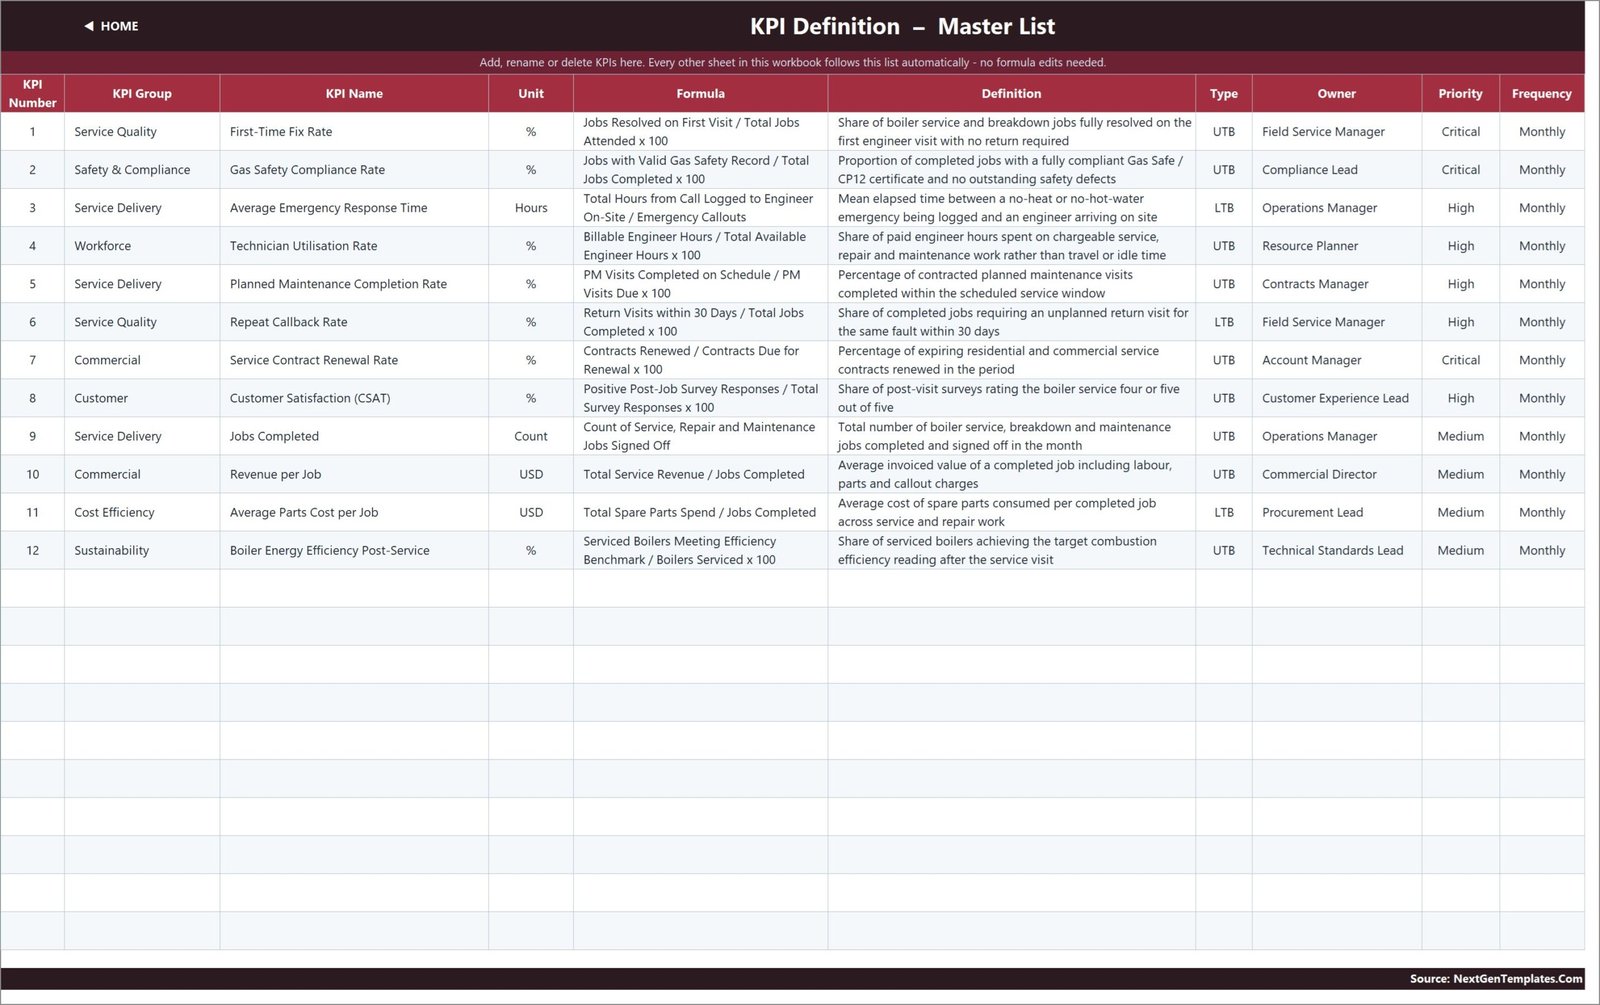
- KPI Definition: the master list for KPI number, group, name, unit, formula, definition, UTB/LTB type, owner, priority and frequency.
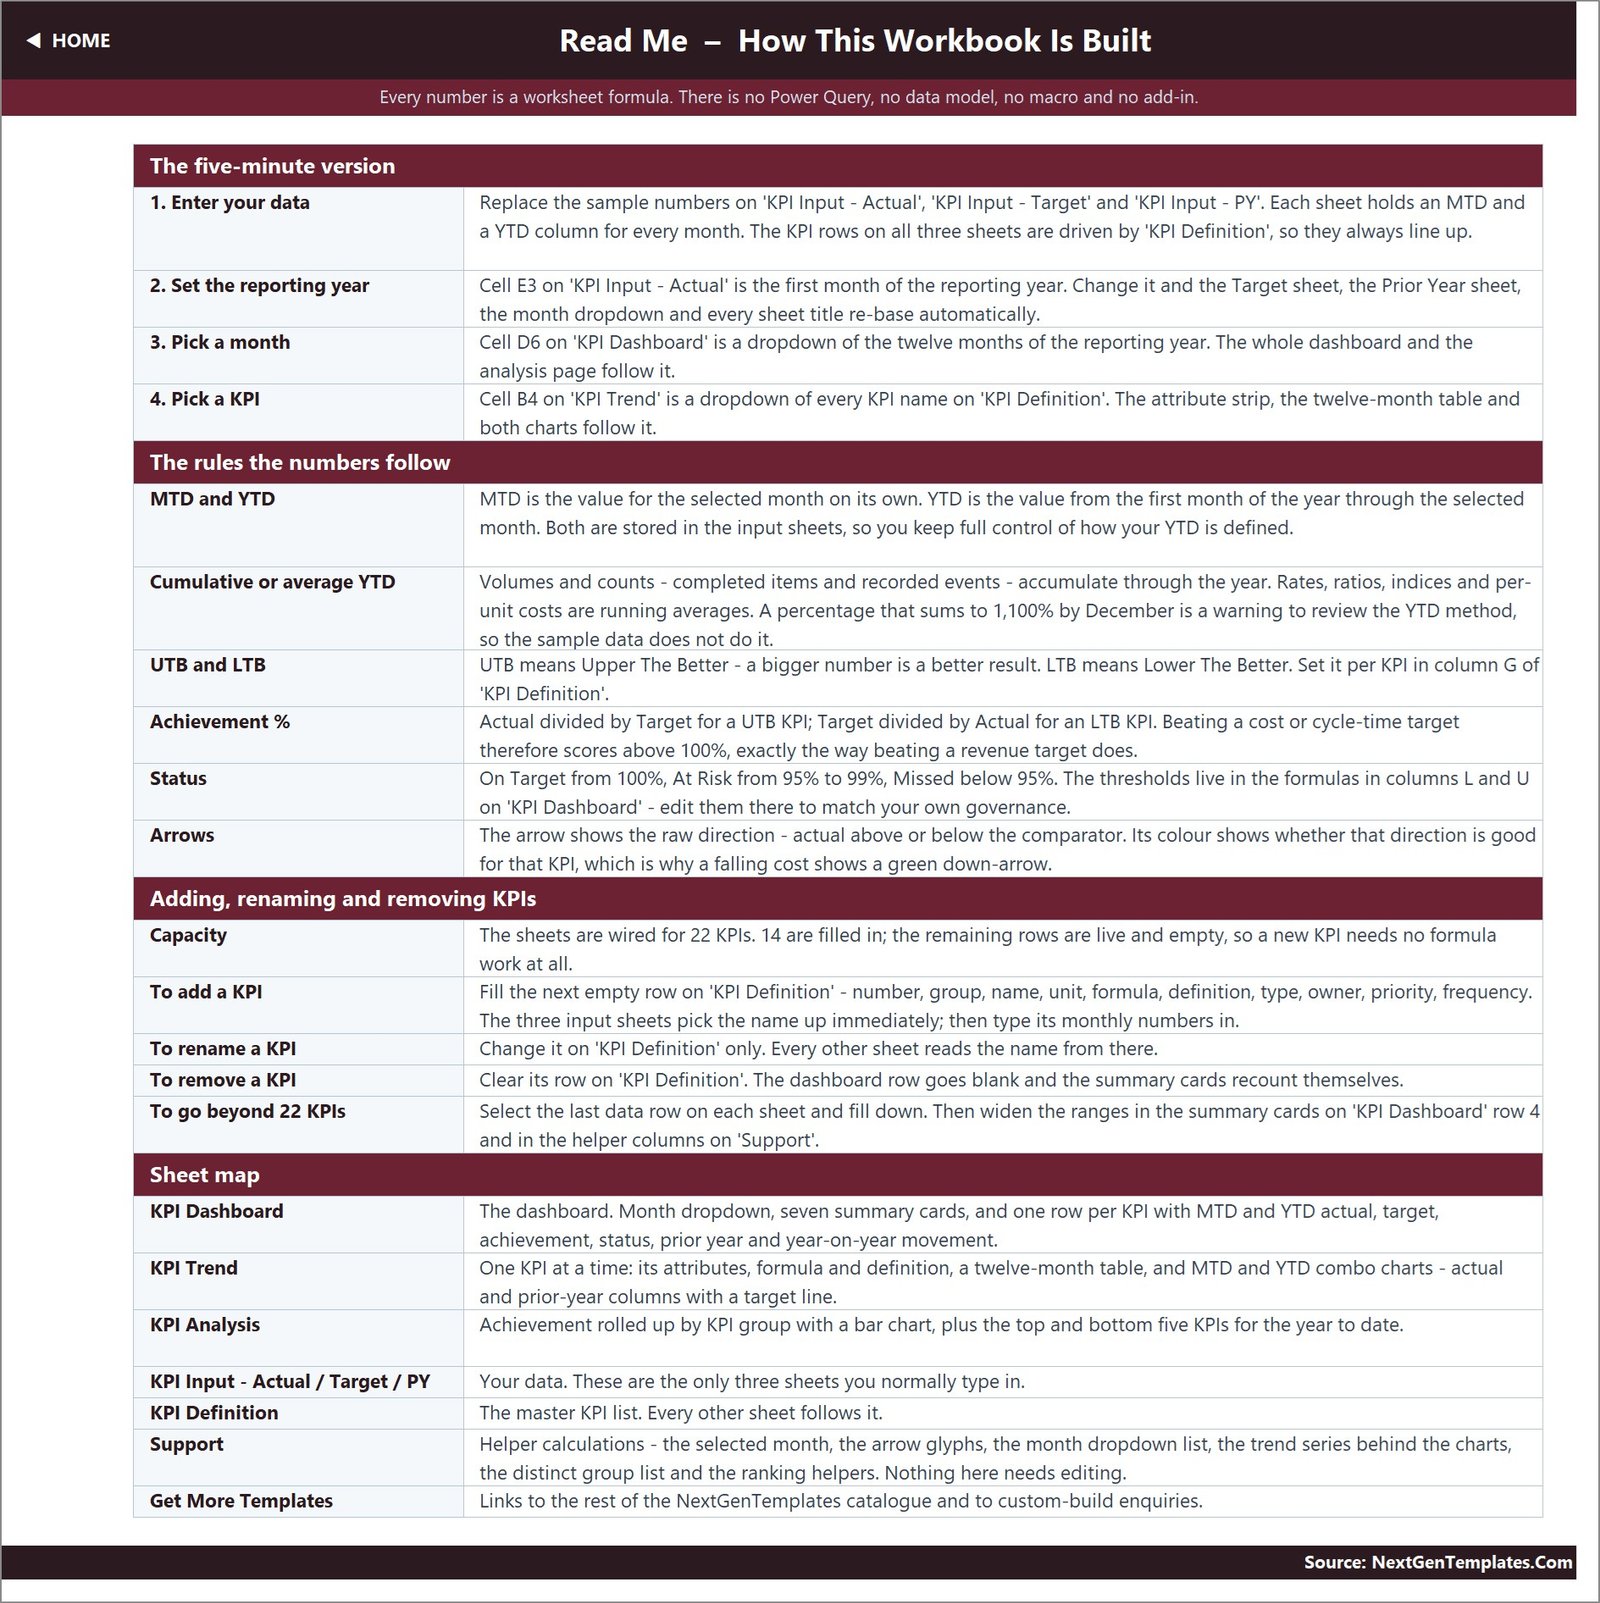
- Read Me: practical instructions for the reporting year, month and KPI selectors, achievement logic, status thresholds and worksheet map.
The included KPI list covers First-Time Fix Rate, Gas Safety Compliance Rate, Average Emergency Response Time, Technician Utilisation Rate, Planned Maintenance Completion Rate, Repeat Callback Rate, Service Contract Renewal Rate, Customer Satisfaction, Jobs Completed, Revenue per Job, Average Parts Cost per Job and Boiler Energy Efficiency Post-Service. These are editable examples, not legal or safety certifications.
Boiler Maintenance KPI Dashboard in Excel vs. Google Sheets vs. Paid Field-Service SaaS – Where This Fits
| Area | This Excel template | Google Sheets alternative | Paid field-service SaaS |
|---|---|---|---|
| Cost | 19.99 regular / 12.99 sale, one-off | Usually one-off template cost | Recurring subscription |
| Platform | Excel 2013+, Microsoft 365, Excel for the web | Browser-based Google Sheets | Vendor web and mobile apps |
| Setup | Replace the sample monthly values | Replace the sample values online | Configuration, import and staff onboarding |
| KPI customisation | Editable names, groups, formulas, owners and targets | Usually editable | Depends on vendor permissions |
| Team collaboration | OneDrive or SharePoint co-authoring | Native browser collaboration | Native collaboration |
| Work orders and dispatch | Not included | Not included | Often included |
| Best fit | Monthly KPI reporting from already-calculated values | Shared browser-first KPI reporting | End-to-end field-service operations |
Who This Template Is For – and Who It’s Not For
It is designed for boiler servicing businesses, heating contractors, service managers, compliance leads, operations managers and commercial teams that already know their monthly KPI values and need a consistent review pack. It also works as a boiler maintenance dashboard Excel file for branch meetings and contract-performance reviews.
It is not a job scheduler, customer database, invoice system, asset register or live equipment monitor. It does not calculate KPIs from raw work orders, connect to field-service software, issue compliance certificates or replace qualified safety review. For transaction-level operational analysis, see the published HVAC Service Dashboard in Excel. For work-order entry, see the Maintenance Work Order Data Entry System in Excel.
How to Use This Excel Boiler KPI Dashboard
- Open the .xlsx and review the sample year to understand every page.
- Set the first month of your reporting year on KPI Input – Actual; the connected month labels re-base automatically.
- Edit the KPI Definition sheet if your boiler-service measures, owners or priorities differ.
- Replace sample MTD and YTD values on KPI Input – Actual, KPI Input – Target and KPI Input – PY.
- Select a month on KPI Dashboard to review status, prior-year movement and summary cards.
- Select a KPI on KPI Trend, then use KPI Analysis to investigate group performance and the bottom-five list.
When adapting formulas, sharing through OneDrive or using Excel for the web, consult Microsoft Excel help and learning.
This Excel KPI dashboard for boiler services is a reporting layer: your team controls the source calculations and types the final monthly results. The boiler service KPI template does not infer safety or financial values.
Real-World Use Cases
A service manager can review first-time fix rate, callbacks, response time and jobs completed in one monthly meeting. A compliance lead can monitor the entered gas-safety compliance result beside the nominated owner and priority. A commercial manager can compare renewals, revenue per job and parts cost against target and prior year. In each case, the workbook visualises the values supplied by the business; it does not certify their accuracy.
Frequently Asked Questions
Does this workbook need macros?
No. It is a standard .xlsx workbook built with worksheet formulas only.
Can I change the twelve KPIs?
Yes. Edit the KPI Definition sheet. The connected input, dashboard, trend and analysis pages follow the master list, with capacity for up to 22 rows.
Does it import work orders automatically?
No. You enter already-calculated MTD and YTD KPI values on the three input sheets.
What is the difference between this dashboard and the scorecard?
This dashboard includes a full MTD/YTD grid, KPI Trend page and KPI Analysis page. The Boiler Maintenance KPI Scorecard in Excel is a separate compact scorecard product.
Are the included safety KPIs certifications?
No. They are editable reporting examples. The workbook does not conduct inspections, create certificates or replace competent compliance review.
Can it be used in Excel for the web?
Yes. The workbook uses ordinary formulas and contains no macros, Power Query or Power Pivot.
About the Author
Built by PK – Microsoft Certified Professional with 15+ years of Excel, Google Sheets, and Power BI experience. Founder of NextGenTemplates, reaching 300K+ subscribers across YouTube channels. Every template is hand-built and tested before release.
Explore Related Templates
- Boiler Maintenance KPI Scorecard in Excel – the distinct compact scorecard sibling.
- HVAC Contractor KPI Dashboard in Excel – KPI reporting for heating and cooling contractors.
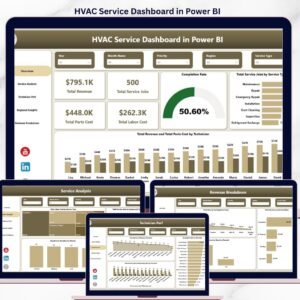
- HVAC Service Dashboard in Power BI – an analytical Power BI alternative.
- Browse the Excel KPI Dashboard collection and the MS Excel catalogue.
Start with the sample year, replace the values you already calculate, and make each monthly boiler-maintenance review faster to read and easier to repeat.
Last updated: 16 September 2026.



























Reviews
There are no reviews yet.