

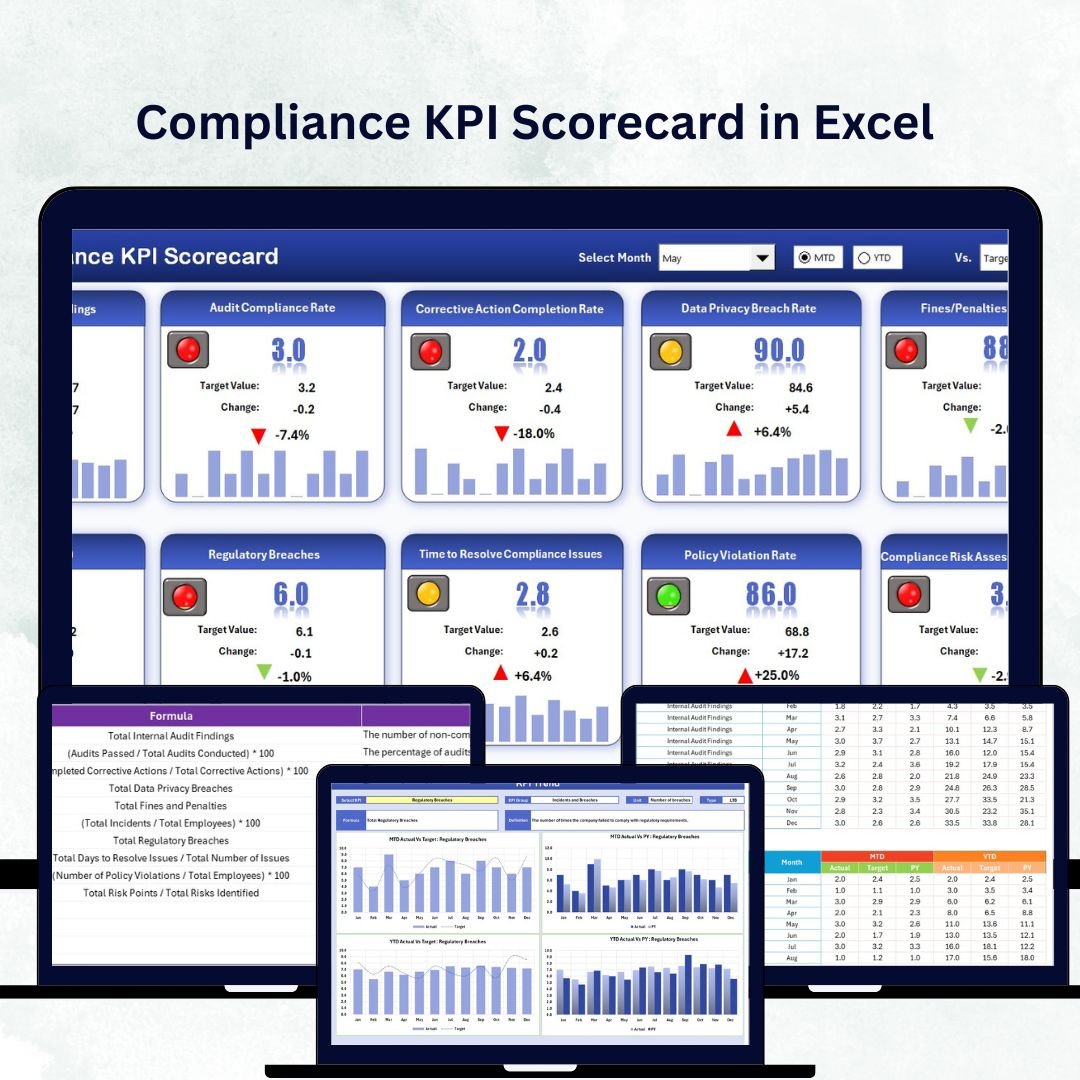


Staying compliant is no longer optional — it’s essential for every organization. Whether you’re in finance, healthcare, manufacturing, or education, compliance ensures that your operations align with internal policies and government regulations. Tracking those metrics manually, however, can be messy and time-consuming. That’s where the Compliance KPI Scorecard in Excel becomes your ultimate solution.Compliance KPI Scorecard in Excel
This ready-to-use template helps you measure, monitor, and visualize compliance performance with ease. It’s built for professionals who want real-time insights without investing in expensive compliance software.
With interactive dashboards, color-coded visuals, and automatic performance comparisons, this scorecard empowers managers to make data-driven decisions that improve transparency, accountability, and regulatory readiness.Compliance KPI Scorecard in Excel
✨ Key Features of the Compliance KPI Scorecard in Excel
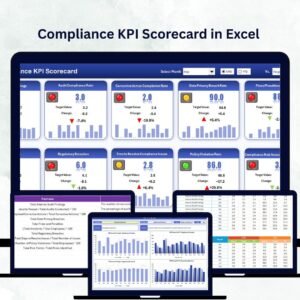
✅ Dynamic Dashboard View – Instantly see KPI performance through dropdowns that let you switch between Month-to-Date (MTD) and Year-to-Date (YTD) analyses.
📊 Actual vs Target Comparison – Visualize whether your compliance goals are being met, exceeded, or missed using conditional formatting and performance arrows.
🎯 Color-Coded Indicators – Gain at-a-glance insights with green (good), yellow (warning), and red (needs attention) indicators.
📈 Comprehensive KPI Tracking – Monitor up to 10 compliance KPIs in one clean view, each linked to its definition and target.
🔄 Automatic Data Updates – As you update new figures in the data sheet, the dashboard and trend visuals refresh automatically.
🧩 Multi-Sector Flexibility – Adaptable for finance, education, healthcare, manufacturing, and other industries with minimal changes.
🧠 Easy Customization – Modify KPI groups, formulas, and targets as per your organization’s standards.
📦 What’s Inside the Compliance KPI Scorecard in Excel
This Excel file is organized into four functional worksheets, each designed to make compliance tracking effortless:
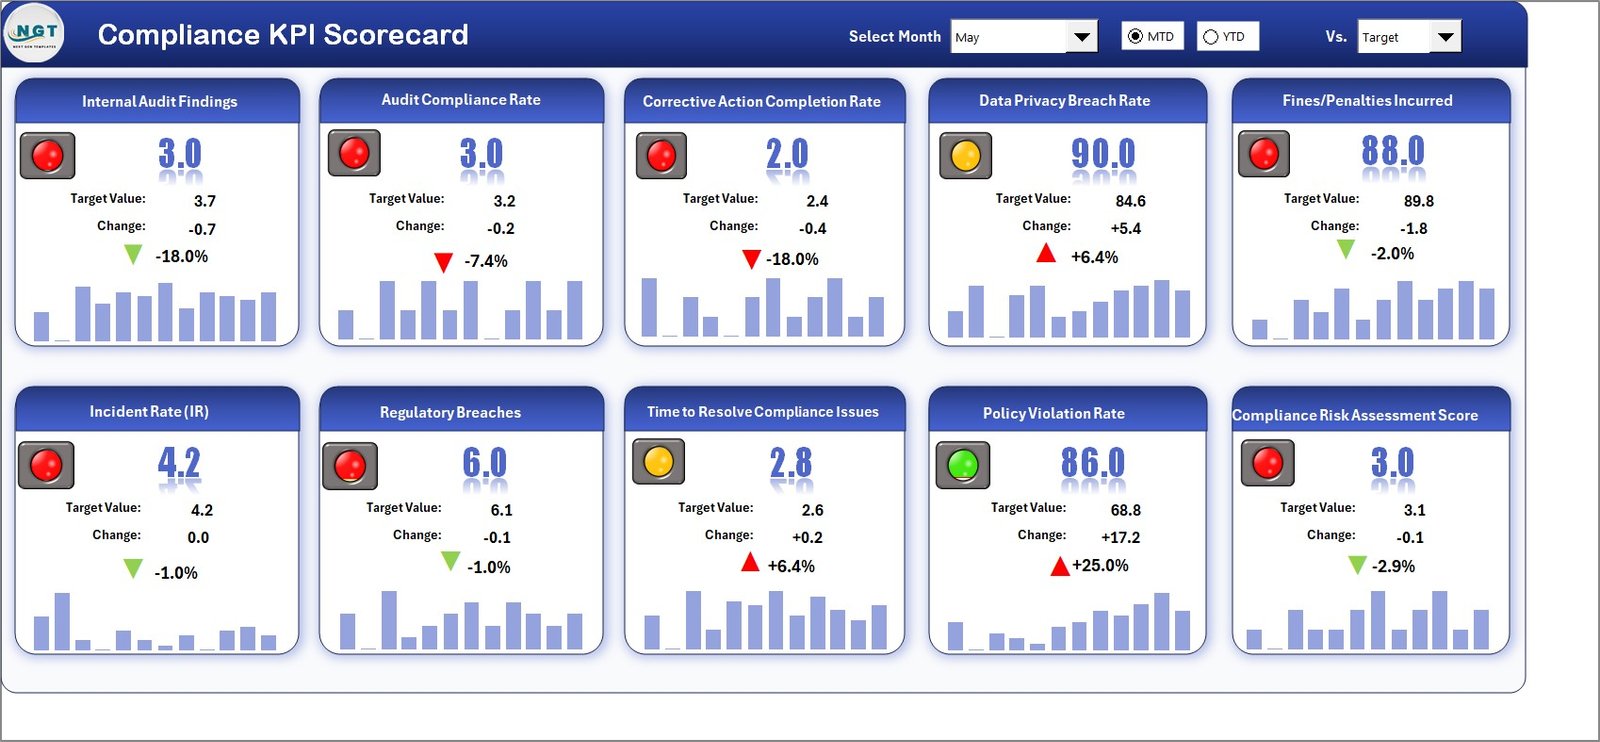
1️⃣ Scorecard Sheet (Main Dashboard)
Your one-stop visual dashboard showing MTD and YTD performance, comparisons with previous years, and dynamic conditional formatting.
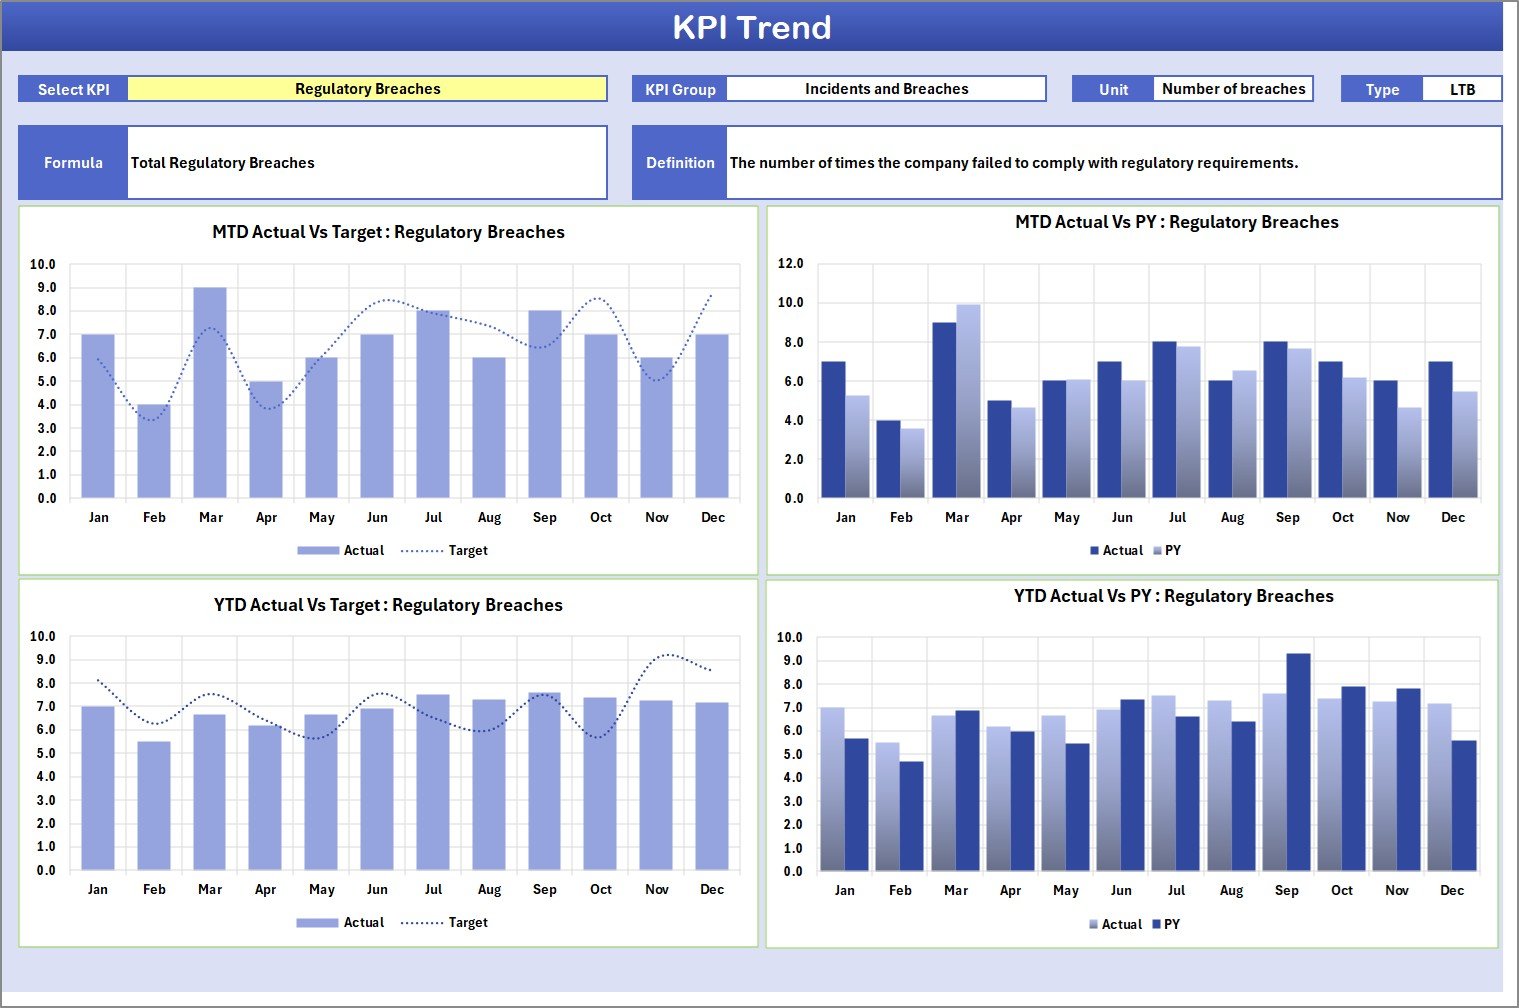
2️⃣ KPI Trend Sheet
Analyze KPI behavior over time. Select any KPI from the dropdown to view Actual vs Target vs Previous Year trends in graph format.
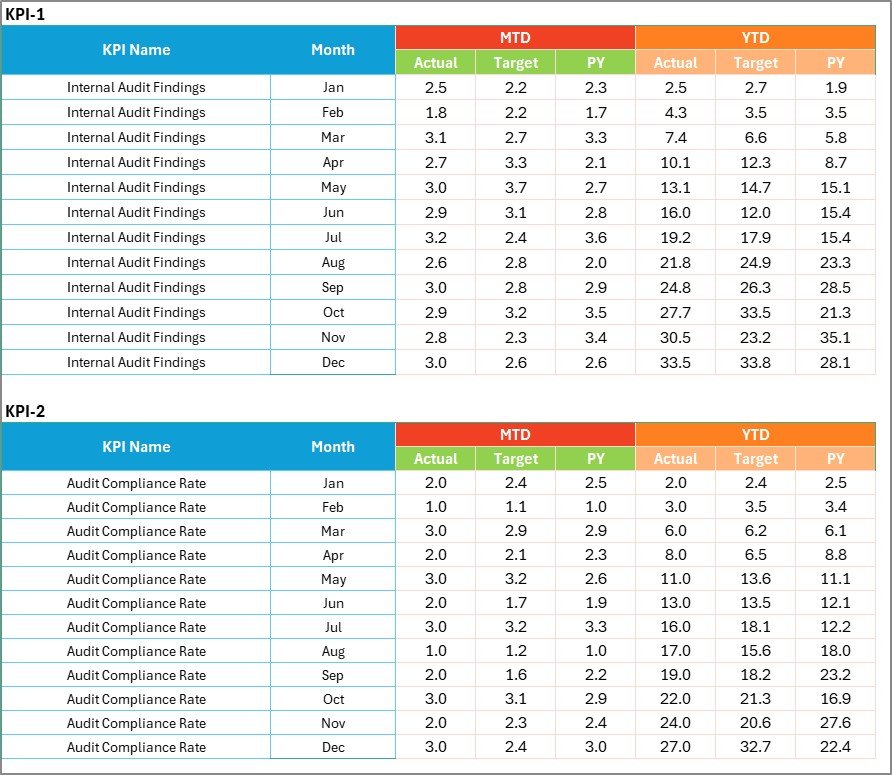
3️⃣ Input Data Sheet
Enter or update monthly results for each KPI. The dashboard auto-calculates all comparisons and trends.
4️⃣ KPI Definition Sheet
A knowledge base containing KPI Name, Group, Unit, Formula, and Definition — ensuring complete clarity across teams.
Together, these sheets form a fully functional compliance management system that brings clarity and confidence to your data-driven operations.
🧭 How to Use the Compliance KPI Scorecard in Excel
💡 Step 1: Open the Excel template.
💡 Step 2: Define your KPIs in the KPI Definition Sheet with their formulas, units, and type (UTB or LTB).
💡 Step 3: Add actual and target data in the Input Data Sheet monthly.
💡 Step 4: Review the Scorecard Sheet for instant KPI performance results.
💡 Step 5: Use the KPI Trend Sheet to track long-term progress and spot improvement areas.
That’s it! Your compliance monitoring system is now ready to deliver actionable insights — no complex setup or coding required.
👥 Who Can Benefit from This Compliance KPI Scorecard in Excel
🏢 Compliance Managers – Monitor audits, policies, and regulatory adherence.
🧾 Finance Teams – Track legal reporting accuracy and policy compliance.
🏥 Healthcare Administrators – Measure compliance in patient safety and staff training.
🏫 Educational Institutions – Track documentation, accreditation, and regulatory submissions.
🏭 Manufacturing Units – Ensure safety standards and process audits are always compliant.
💼 Consultants and Auditors – Use as a ready-to-present compliance reporting tool for clients.
This scorecard bridges the gap between raw compliance data and meaningful insights — all within the familiar environment of Excel.
Click here to read the Detailed Blog Post
Watch the step-by-step video tutorial:
Visit our YouTube channel to learn step-by-step video tutorials
Compatibility and Requirements
- Works in Microsoft Excel desktop (Excel 2016 or later, or Microsoft 365).
- The MTD/YTD switch and the KPI picker are dropdown lists. Microsoft explains how these work in Create a drop-down list.
Frequently Asked Questions
What sheets are in the Compliance KPI Scorecard?
Four: the Scorecard sheet (main dashboard), a KPI Trend sheet, an Input Data sheet and a KPI Definition sheet.
How many KPIs can it track?
The scorecard shows up to 10 compliance KPIs in one view, each linked to its definition and target.
How do I switch between MTD and YTD?
Use the dropdown on the Scorecard sheet to switch between month to date and year to date results.
What do the colors mean?
Green means good, yellow is a warning and red needs attention. Arrows show whether each KPI beat or missed its target.
Can I use it outside finance?
Yes. The KPI groups, formulas and targets can be changed, so it works for healthcare, education, manufacturing and other sectors.
Related Compliance Templates
- Compliance KPI Dashboard in Power BI: compliance KPIs in Power BI.
- Compliance KPI Dashboard in Google Sheets: compliance KPIs in Google Sheets.
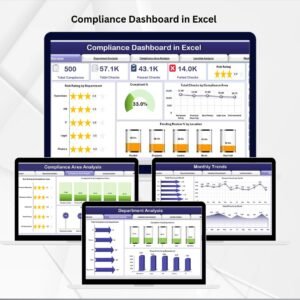
- Compliance Dashboard in Excel: a wider compliance dashboard with charts and filters.
- Legal Compliance KPI Dashboard in Excel: KPIs for legal and regulatory teams.
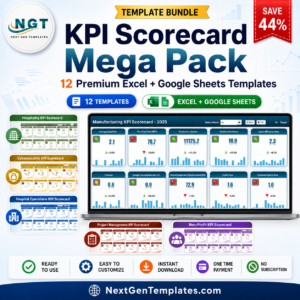
- KPI Scorecard Mega Pack: 12 Excel and Google Sheets KPI scorecards in one bundle.
Browse all Excel KPI dashboard templates or the Excel quality control templates.





















Reviews
There are no reviews yet.