



Are you struggling to measure the impact of your content marketing efforts? Want to know what’s working, what’s not, and where to focus next?
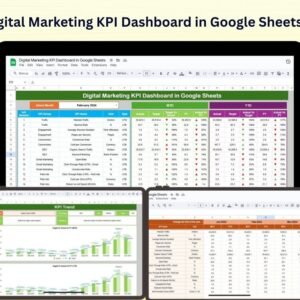
Introducing the Content Marketing KPI Dashboard in Google Sheets — your all-in-one toolkit to track real-time performance, compare results, and optimize your strategy without paying for expensive software.
Built for digital marketers, agencies, solopreneurs, and content teams, this dashboard turns raw data into actionable insights using the power of Google Sheets. From blog performance to lead generation metrics, it captures everything you need to grow smarter and faster. 📈

✨ Key Features of the Content Marketing KPI Dashboard in Google Sheets
✅ 1. Interactive Dashboard Sheet
🎯 Select a month from a dropdown (Cell D3)
📅 View Month-to-Date (MTD) and Year-to-Date (YTD) performance
📉 Compare Actual vs. Target & Actual vs. Previous Year
📊 Visual cues (green/red arrows) make trends easy to understand
This is the main control room for your content performance.
✅ 2. KPI Trend Sheet
🔄 Pick any KPI from the dropdown (Cell C3)
📈 Analyze monthly trends via auto-generated line charts
🧮 See KPI Group, Unit, Formula, and whether it’s UTB or LTB
🧠 Understand each KPI’s purpose at a glance
Perfect for long-term tracking and monthly performance reviews.
✅ 3. Actual Number Sheet
📥 Enter monthly performance numbers (e.g., Blog Views, Leads, Conversions)
🗓️ Change starting month in Cell E1 to align reporting periods
🔄 All changes instantly reflect in the Dashboard and Trend views
Simple, structured, and ready for your data input.
✅ 4. Target Sheet
🎯 Define MTD and YTD goals for each KPI
📍 Helps you set SMART content goals (Specific, Measurable, Achievable, Relevant, Time-bound)
Measure progress against realistic benchmarks.
✅ 5. Previous Year Number Sheet
🕰️ Enter last year’s performance data
🔁 Compare year-over-year results for trend analysis
🧭 Make better future predictions based on past insights
YoY comparisons made easy!
✅ 6. KPI Definition Sheet
🗂️ Central reference for every KPI in the system
📚 Add KPI Group, Unit, Formula, Definition, and Type (UTB or LTB)
🔧 Customize or expand KPIs based on your content strategy
No guesswork—just clarity and control.
📦 What’s Inside the Content Marketing KPI Dashboard
6 professionally formatted Google Sheets tabs
Editable formulas and conditional formatting
Monthly and yearly performance breakdown
Visual trend lines and up/down indicators
Room for unlimited KPI customization
Ready for mobile, desktop, and team sharing
No coding or plugin required. Just open, input, and go!
🧑💼 How to Use the Content Marketing KPI Dashboard
Open the Google Sheet and make a copy
Input your KPIs in the Definition tab
Enter actual numbers month by month
Set targets that align with business goals
Track trends and performance with dashboards and charts
Review regularly with your team
It’s as easy as managing a spreadsheet—no learning curve.
👥 Who Can Benefit from This Dashboard?
This template is designed for anyone managing content performance:
🧑💻 Content Marketers – Track blog traffic, lead forms, and conversions
📱 Social Media Managers – Monitor content engagement
📈 Marketing Agencies – Share performance data with clients
🛒 Ecommerce Brands – Evaluate ROI of content-driven sales
🧑🏫 Educators and Course Creators – Measure audience reach
🧑🎤 Freelancers and Influencers – Showcase growth to partners
If you produce content, you need this dashboard.
🏆 Why Choose This Google Sheets Dashboard?
🆓 Free of monthly software fees
🔓 Fully customizable for your KPIs
👥 Real-time collaboration for teams
📲 Works across all devices
📊 Professional-grade visuals without expensive tools
📌 Click here to read the detailed blog post
Watch the step-by-step video Demo:
👉 Visit our YouTube channel to learn step-by-step video tutorials
Compatibility and Requirements
- Works in Google Sheets. You need a free Google account and a web browser.
- You pick the month on the Dashboard sheet and the KPI on the KPI Trend sheet from dropdowns. Google explains dropdowns in Create an in-cell dropdown list.
Frequently Asked Questions
Which sheets are included?
Six sheets: Dashboard, KPI Trend, Actual Number, Target, Previous Year Number and KPI Definition.
How do I update the dashboard?
Enter your monthly figures on the Actual Number sheet and your MTD and YTD goals on the Target sheet. Then choose a month from the dropdown on the Dashboard sheet and the results update.
Can I compare this year with last year?
Yes. Enter last year’s figures on the Previous Year Number sheet. The Dashboard then compares Actual against Target and Actual against the previous year.
Can I add my own KPIs?
Yes. The KPI Definition sheet holds the KPI group, unit, formula, definition and type (UTB or LTB) for each KPI, and you can customize or expand it for your content strategy.
Is there an Excel or Power BI version?
Yes. See the Content Marketing KPI Dashboard in Excel and the Content Marketing KPI Dashboard in Power BI.
Related Marketing Templates
- Content Marketing KPI Dashboard in Excel: the same dashboard in Excel
- Content Marketing KPI Dashboard in Power BI: the Power BI edition
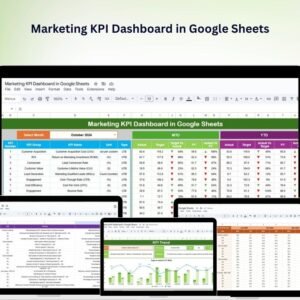
- Marketing KPI Dashboard in Google Sheets: KPIs for your wider marketing work
- Content Planning Calendar in Google Sheets: plan the content you track here
- Marketing and Social Media Analytics Kit: 7 marketing templates in one download
Browse all Google Sheets KPI dashboards.






Reviews
There are no reviews yet.