
Stop Guessing Your ERP Performance. Start Controlling It. 🚀
Running an ERP consulting firm without structured KPIs is like managing a project without a roadmap. You might move forward, but you will never know if you are moving in the right direction.
The ERP Consulting KPI Dashboard in Excel is a powerful, ready-to-use performance management system designed specifically for ERP consulting firms. It transforms scattered data into structured, visual, and actionable insights — all inside Microsoft Excel.
No complex BI tools. No expensive software. Just smart Excel automation.
Whether you manage ERP implementations, consulting teams, or enterprise transformation projects, this dashboard gives you clarity, control, and confidence.
Key Feature of ERP Consulting KPI Dashboard in Excel 📊
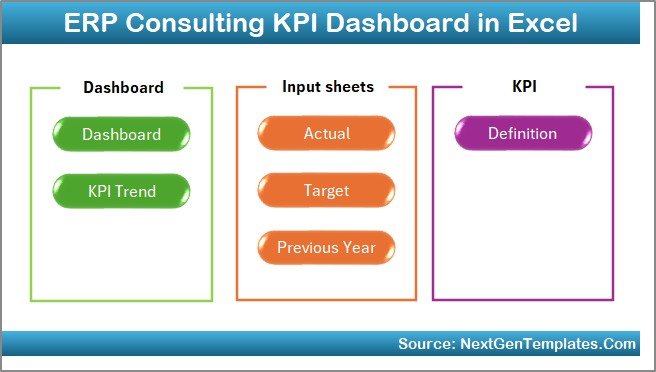
This dashboard includes 7 structured worksheets that work together seamlessly:
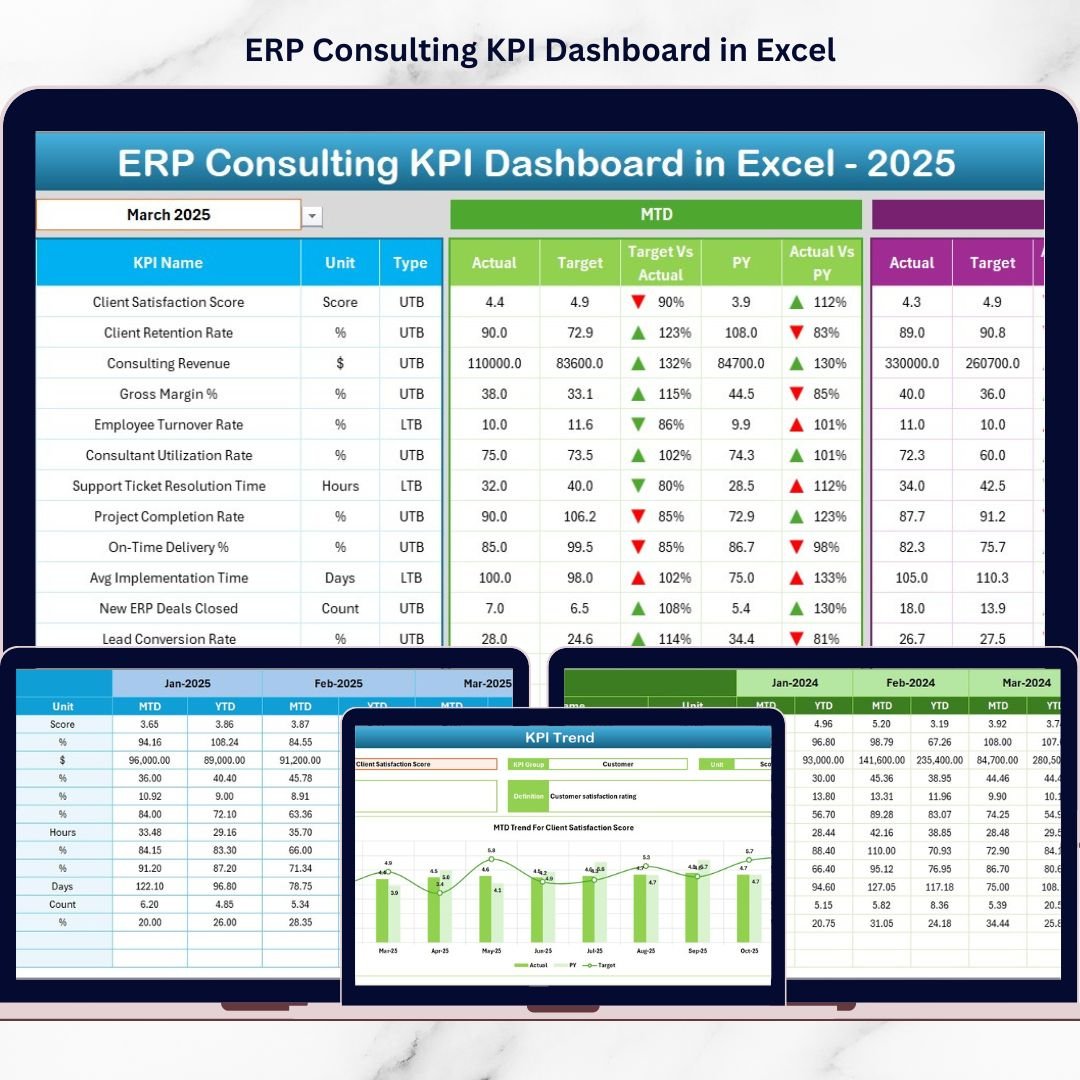
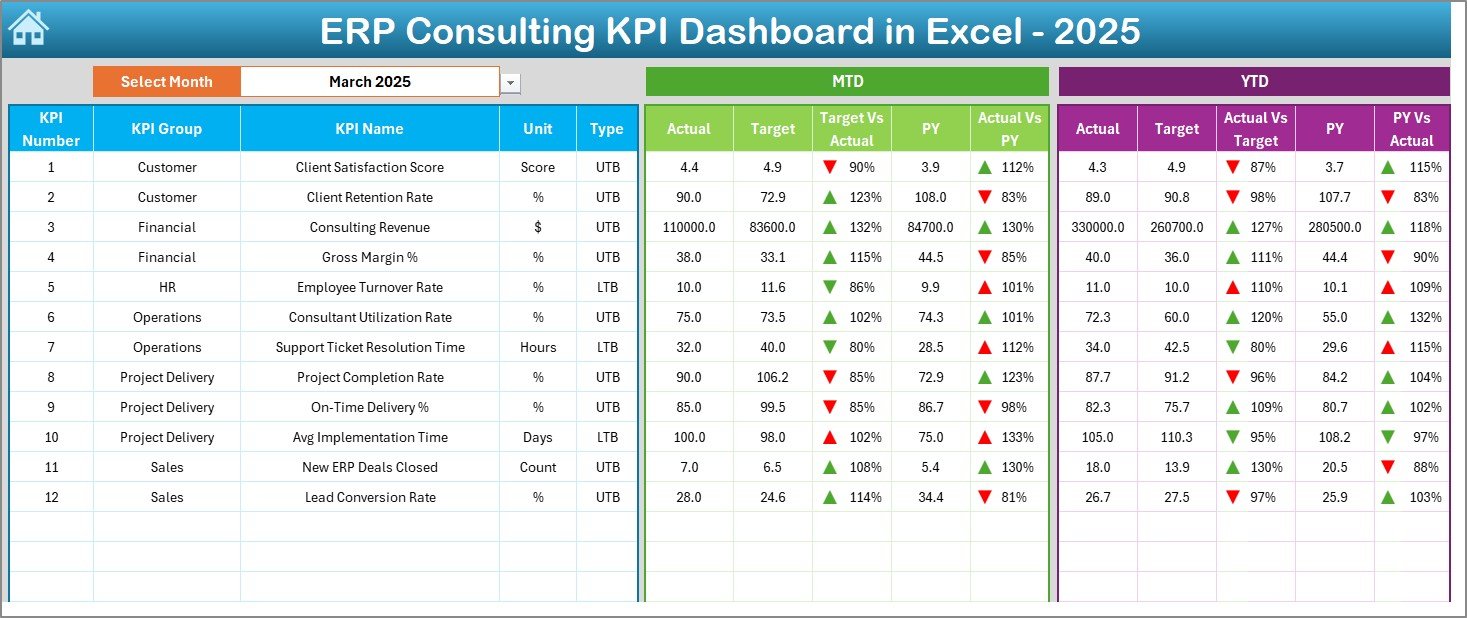
✅ Dynamic Month Selection – Select any month from dropdown (Cell D3) and the entire dashboard updates automatically.
✅ Complete MTD & YTD Analysis – Track Month-to-Date and Year-to-Date performance instantly.
✅ Target vs Actual Comparison – Identify gaps and act before profits decline.
✅ Previous Year Comparison – Measure growth trends and seasonal patterns.
✅ Conditional Formatting Arrows – Instantly see performance improvement or decline.
✅ KPI Classification Logic – Supports LTB (Lower the Better) and UTB (Upper the Better).
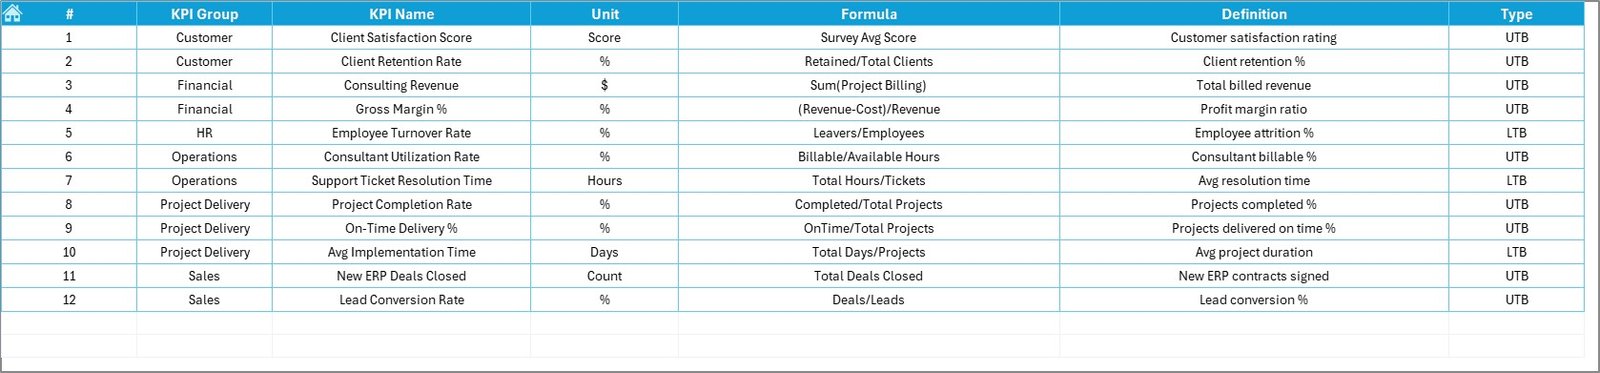
✅ Structured KPI Documentation – Clear definitions, formulas, and KPI groups.
From revenue per consultant to utilization rate, billing efficiency, and project profitability — everything is measurable and visible.
What’s Inside the ERP Consulting KPI Dashboard in Excel 📁
You receive a fully structured Excel workbook containing:
🏠 Home Sheet
An interactive navigation hub with 6 buttons for easy access.
📈 Dashboard Sheet
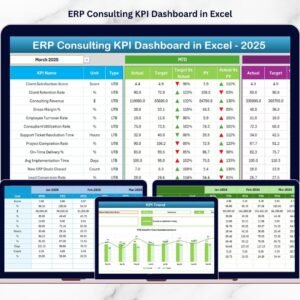
The main performance overview showing:
MTD Actual, Target, Previous Year
YTD Actual, Target, Previous Year
Target vs Actual %
Previous Year vs Actual %
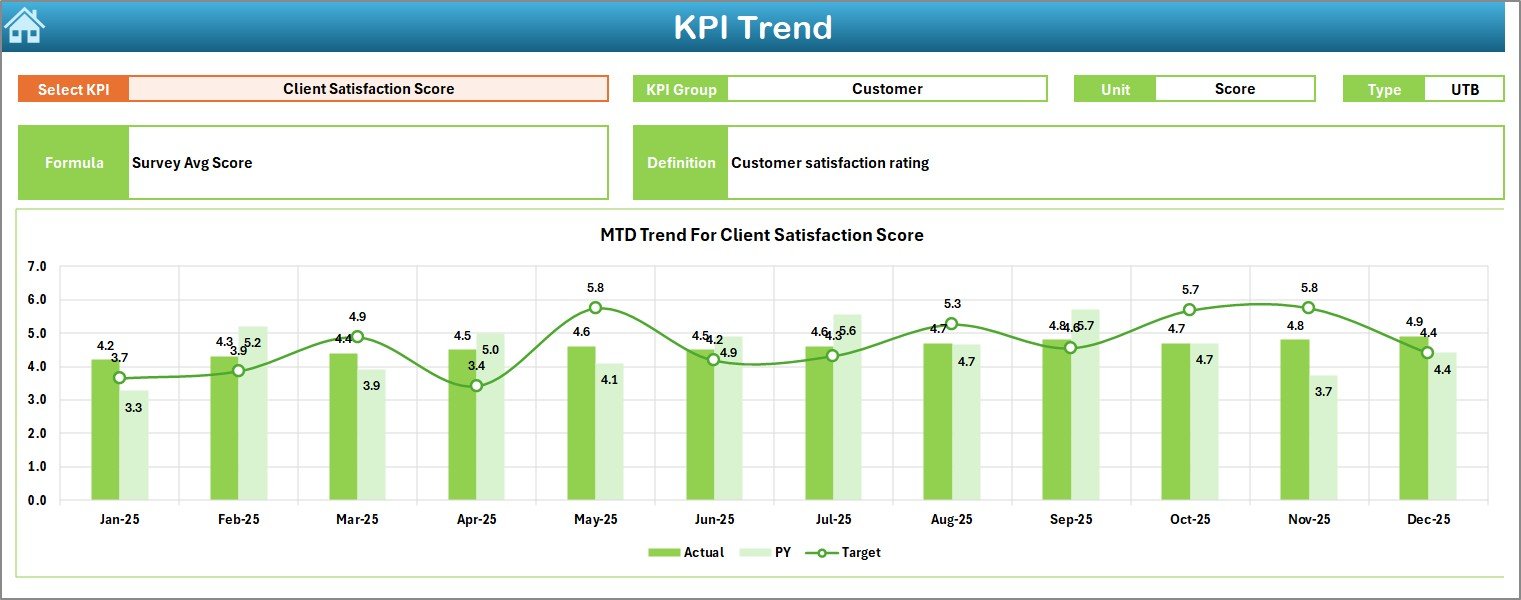
📊 KPI Trend Sheet
Select any KPI from dropdown and analyze:
KPI Group
Unit
Formula
Definition
MTD Trend Chart
YTD Trend Chart
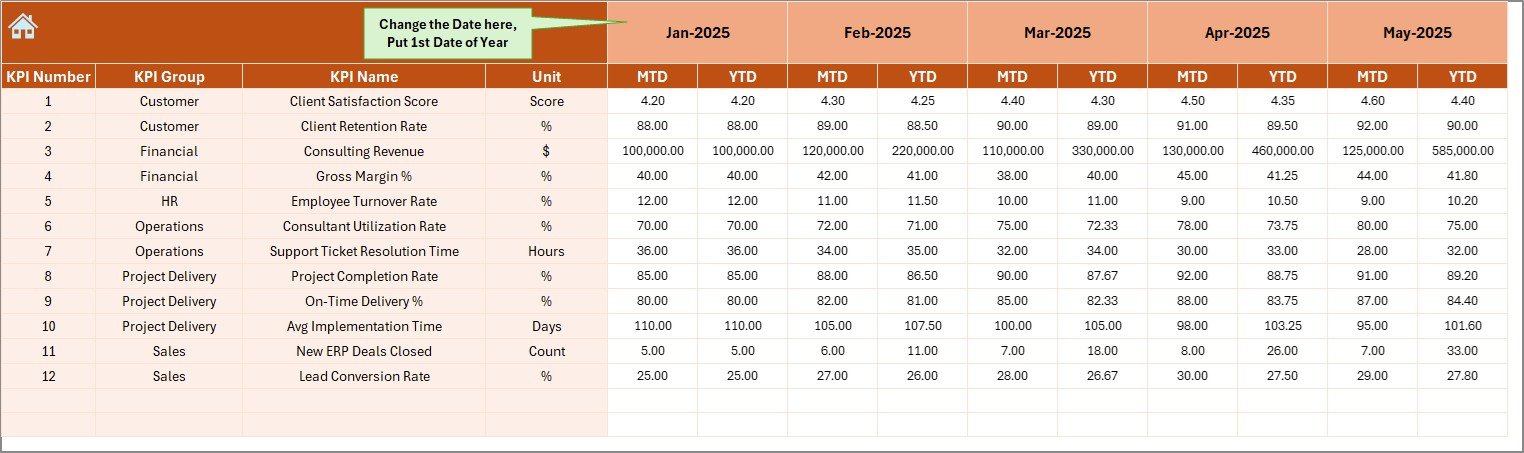
📝 Actual Input Sheet
Enter monthly actual data. Dashboard updates automatically.
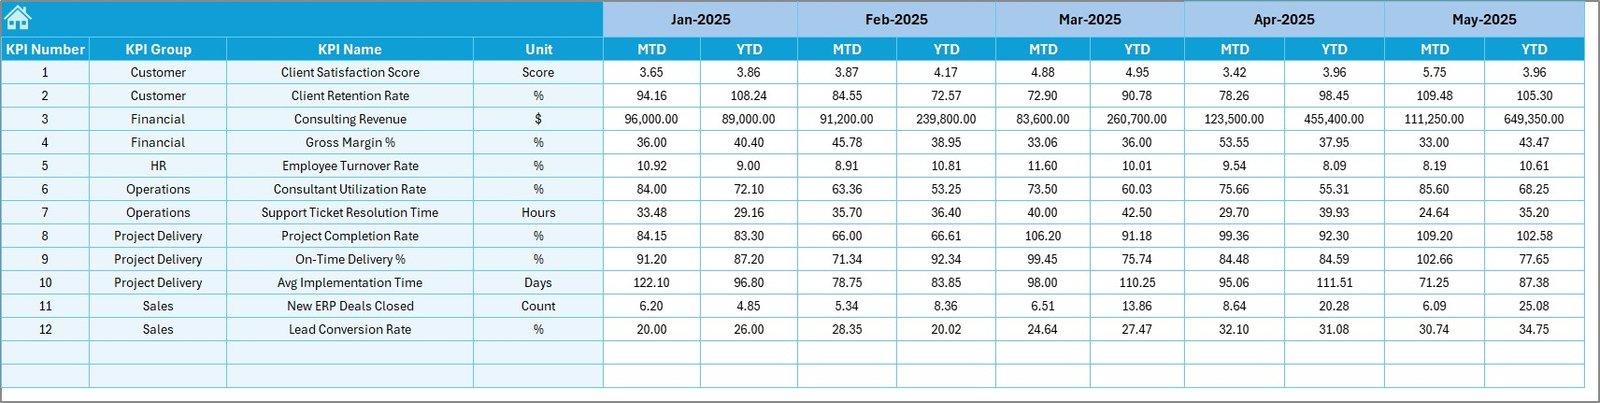
🎯 Target Sheet
Define monthly MTD and YTD targets.
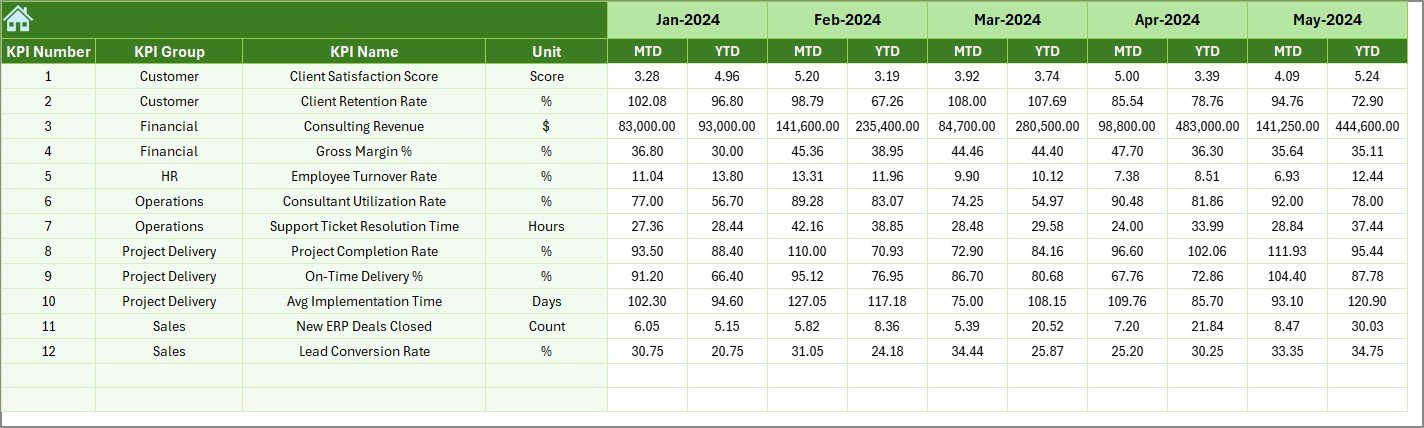
📆 Previous Year Sheet
Enter historical numbers for comparison.
📘 KPI Definition Sheet
Document KPI name, group, formula, and business logic.
Everything is structured for professional ERP consulting performance tracking.
How to Use the ERP Consulting KPI Dashboard in Excel ⚙️
Using this dashboard is simple:
Step 1: Define Your KPIs
Enter KPIs in the KPI Definition sheet aligned with your strategy.
Step 2: Enter Monthly Data
Update Actual, Target, and Previous Year sheets.
Step 3: Select Month
Choose the required month from the dropdown in D3.
Step 4: Analyze Performance
Review dashboard indicators, arrows, and percentages.
Step 5: Take Action
Identify gaps in utilization, profitability, or delivery efficiency and implement improvements.
Within minutes, you move from confusion to clarity.
Who Can Benefit from This ERP Consulting KPI Dashboard in Excel 👥
This dashboard is ideal for:
✔ ERP Consulting Firm Owners
✔ Project Managers
✔ Finance Heads
✔ Operations Managers
✔ Delivery Managers
✔ Strategy Leaders
If you want to improve consultant utilization, reduce cost overruns, increase project success rate, and boost profitability — this tool is built for you.
It provides financial, operational, and client performance insights in one centralized system.
This dashboard helps you:
🔹 Increase utilization rates
🔹 Reduce billing leakage
🔹 Control project margins
🔹 Improve on-time delivery
🔹 Strengthen strategic planning
🔹 Enhance client satisfaction
Instead of reacting late, you act early.
Instead of assumptions, you use data.
Instead of scattered reports, you gain structured clarity.
If profitability, efficiency, and performance matter to your ERP consulting business — this Excel dashboard is a smart investment.
Click here to read the Detailed blog post
Visit our YouTube channel to learn step-by-step video tutorials:
👉 YouTube.com/@PKAnExcelExpert
Watch the step-by-step video tutorial:
Compatibility and Requirements
- Works in Microsoft Excel desktop (Excel 2016 or later, or Microsoft 365).
- You pick the month and the KPI from dropdown lists. Microsoft explains them in Create a drop-down list.
Frequently Asked Questions
Which sheets are included?
Seven sheets: Home, Dashboard, KPI Trend, Actual Input, Target, Previous Year and KPI Definition.
How do I change the month shown on the dashboard?
Select the month from the dropdown in cell D3 on the Dashboard sheet. The whole dashboard updates for that month.
How do I update the numbers?
Enter your monthly figures in the Actual Input sheet, your goals in the Target sheet and last year’s figures in the Previous Year sheet.
What do LTB and UTB mean?
LTB means Lower the Better and UTB means Upper the Better. Each KPI is classed one way or the other so the arrows show whether performance improved or declined.
Is there a Power BI or Google Sheets version?
There is a Power BI edition: see the ERP Consulting KPI Dashboard in Power BI.
Related ERP and Consulting Templates
- ERP Consulting KPI Dashboard in Power BI: the same KPIs in Power BI
- Consulting KPI Dashboard in Excel: a general consulting KPI view
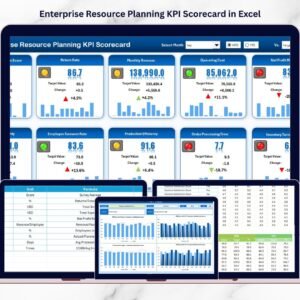
- Enterprise Resource Planning KPI Scorecard in Excel: a scorecard view for ERP metrics
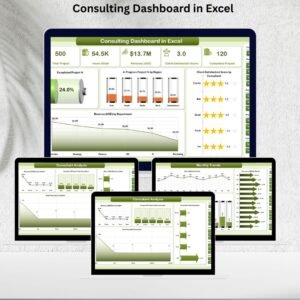
- Consulting Dashboard in Excel: a wider consulting dashboard
- Consultant’s Toolkit: 10 templates for consultants in one download
Browse all Excel KPI dashboards.