


Insurance success depends on precision—and this dashboard delivers it. The Insurance Dashboard in Power BI is a ready-to-use, interactive analytics tool built to help insurers visualize KPIs like policy performance, claims status, premium collection, and sales agent productivity.
With real-time insights and dynamic visuals, this dashboard empowers teams to make faster, smarter decisions, reduce claim processing time, and enhance operational efficiency across regions, policy types, and customer segments.
📊 Key Features of the Insurance Dashboard in Power BI
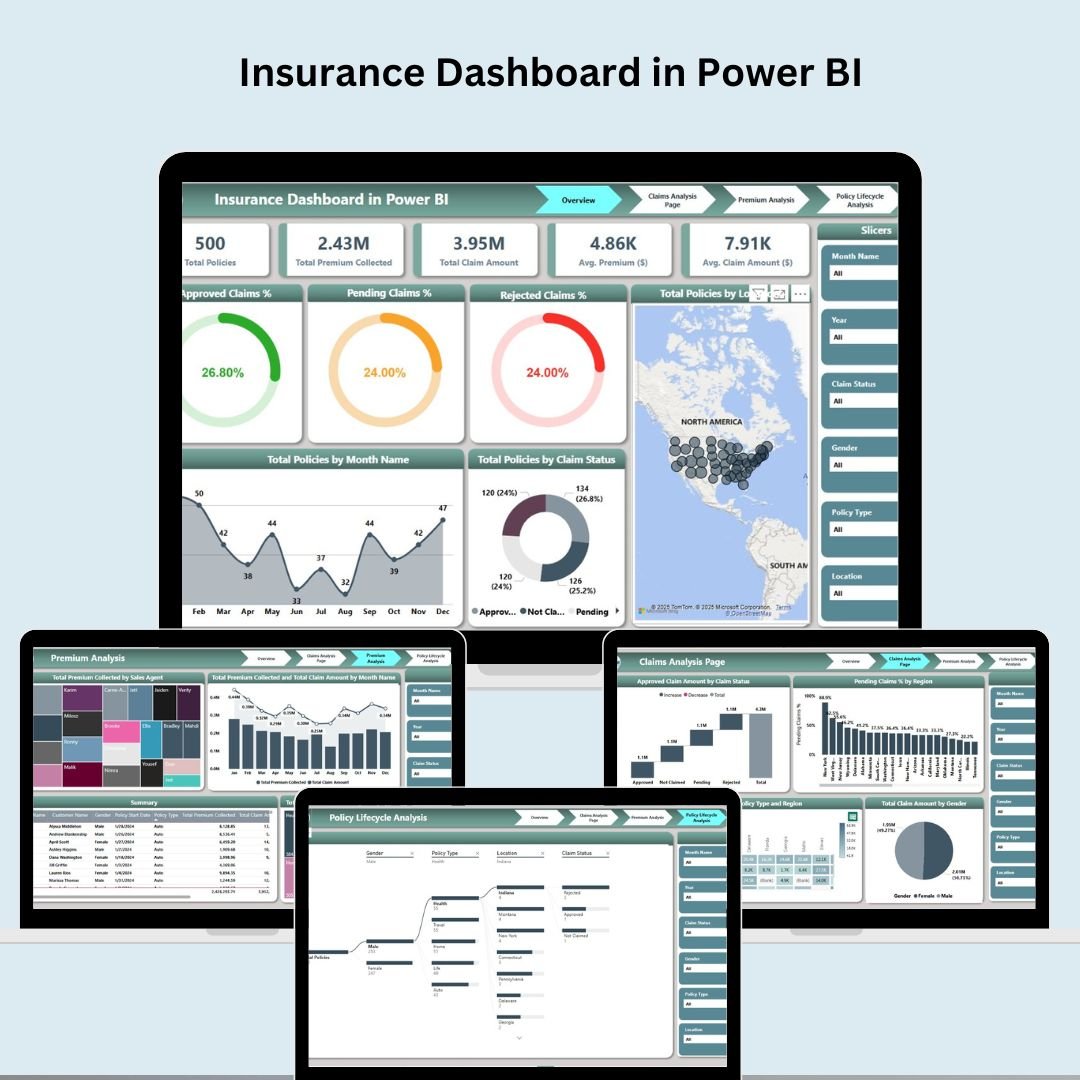
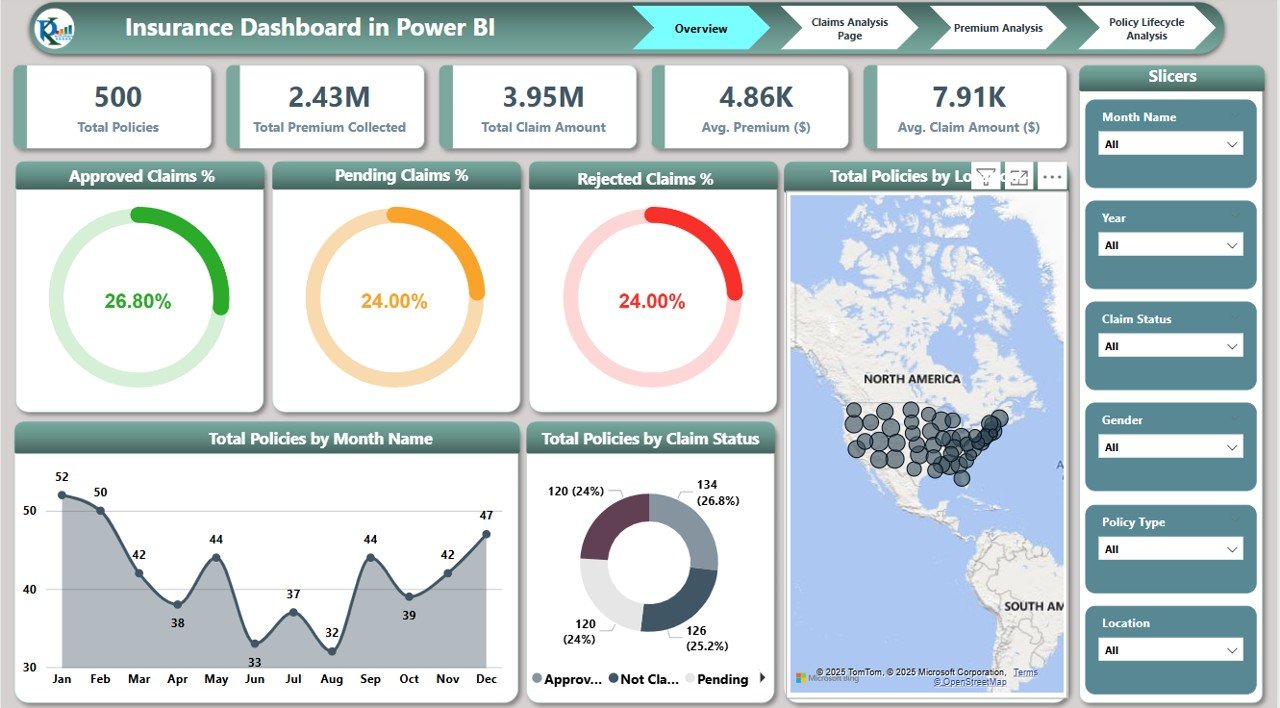
💡 Overview Page – One-Glance Insights
Get a snapshot of the business with dynamic cards and charts:
Total Policies
Total Premium Collected
Total Claim Amount
Avg. Premium ($)
Avg. Claim Amount ($)
Interactive charts include:
Approved, Pending & Rejected Claims %
Policies by Month
Policies by Claim Status
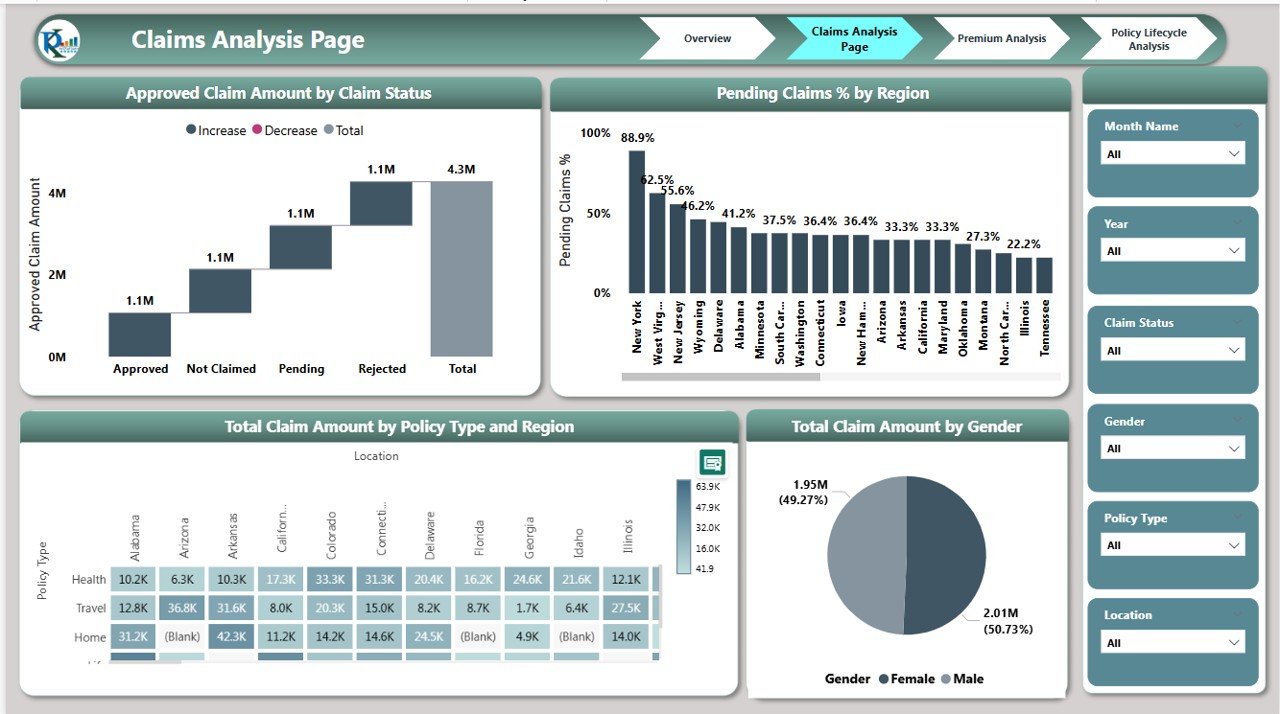
🔍 Claims Analysis Page
Drill into claim details:
Approved Claim Amount by Status
Pending Claims % by Region
Total Claims by Policy Type & Gender
Regional Breakdown of Claim Amounts
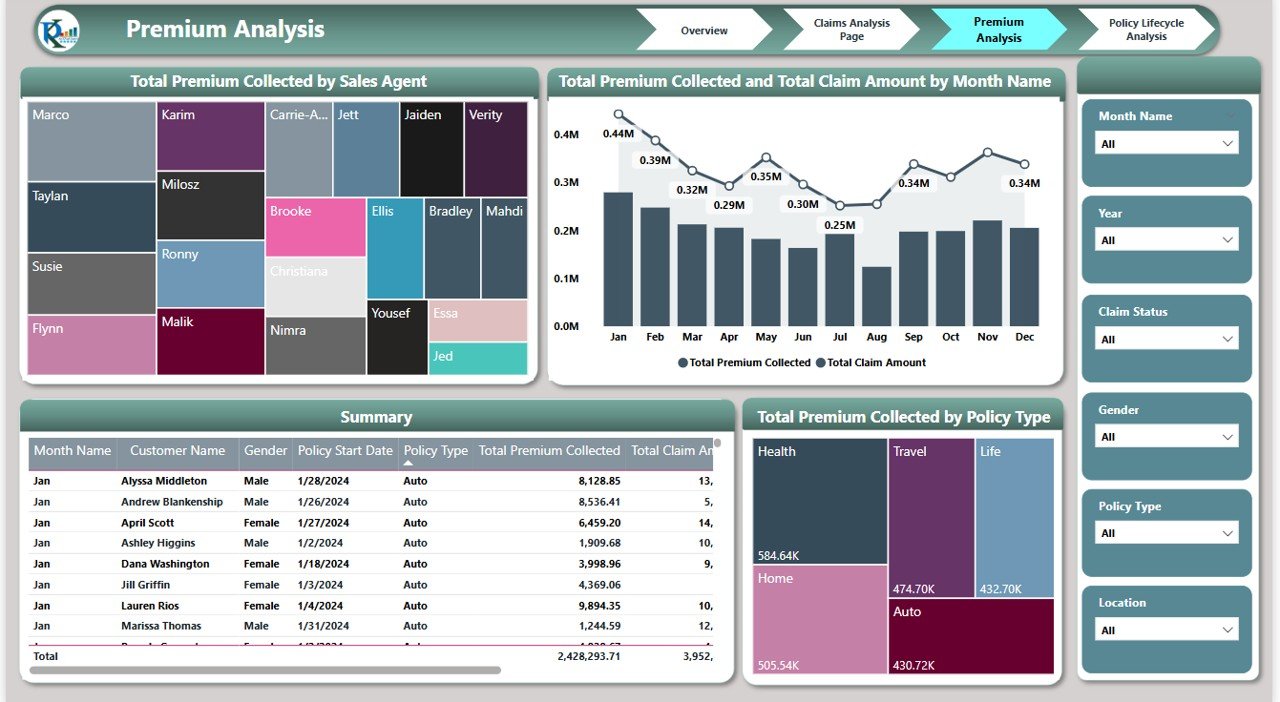
💰 Premium Analysis Page
Track financial flows:
Premium Collected by Agent
Premium vs Claims by Month
Premium Collection by Policy Type
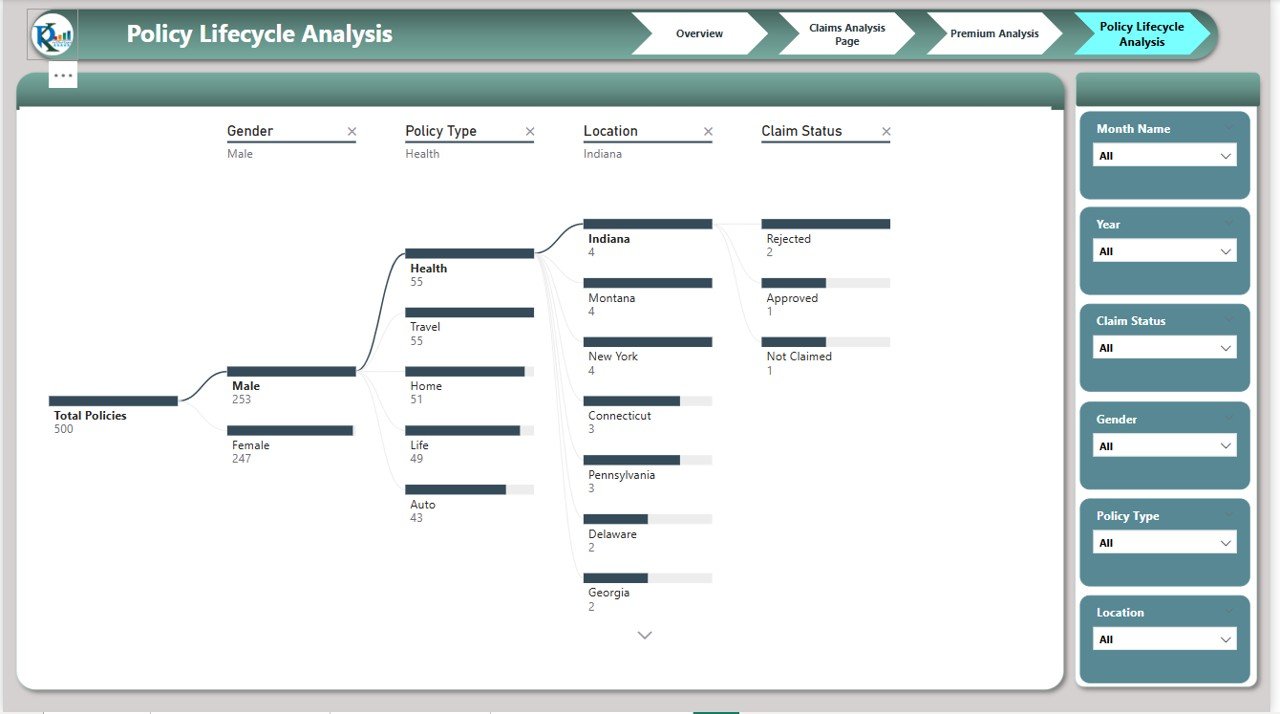
🌐 Policy Lifecycle Analysis Page
Visualize the entire policy journey with a Decomposition Tree:
Monitor active, expired, and canceled policies
Detect drop-offs and optimize lifecycle stages
📦 What’s Inside the Dashboard?
You get four powerful, fully interactive pages:
Overview – Cards & KPIs for instant performance insight
Claims Analysis – Status, type, region & gender visualizations
Premium Analysis – Financial flow trends and agent tracking
Policy Lifecycle – Decomposition tree for status breakdown
🎛️ All pages are equipped with slicers for dynamic filtering by:
Policy Type
Claim Status
Gender
Region
Month
Agent
📌 How to Use the Insurance Dashboard in Power BI
🗂️ Step 1: Connect your insurance dataset (Excel, SQL, CSV, etc.)
📊 Step 2: Explore overview metrics and policy trends
🔍 Step 3: Use slicers to analyze claims, premiums, and agents
📈 Step 4: Track policy lifecycles via decomposition tree
⚙️ Step 5: Customize charts and pages as needed for business KPIs
No code. No fuss. Just drag, filter, and explore.
👥 Who Should Use This Dashboard?
🏢 Insurance Managers – Monitor premium collection and policy growth
🧾 Claims Processing Teams – Identify delays, analyze outcomes
📈 Finance & Actuarial Analysts – Assess risk, payouts, and revenue
👨💼 Sales Directors & Team Leads – Track agent performance
🧑💻 Business Analysts – Provide real-time reporting and forecasting
✅ Why This Power BI Dashboard is a Game-Changer
✔ Real-Time Data Refresh
✔ Slicers for Multi-Dimensional Filtering
✔ Fully Customizable Layout & KPIs
✔ Clean Visuals for Stakeholder Reporting
✔ Designed for Business Users—No Tech Needed
✔ Actionable Insights for Decision-Making
From claim processing delays to regional premium performance—this dashboard helps you spot the issues, track the wins, and steer growth.
🔁 Click here to read the Detailed blog post
Click here to read the Detailed blog post
Watch the step-by-step video Demo:
🎥 Visit our YouTube channel to learn step-by-step video tutorials
Compatibility and Requirements
- Opens in Power BI Desktop, which is free from Microsoft. See Get Power BI Desktop.
- It supports Excel, SQL and CSV files as data sources you can connect.
Frequently Asked Questions
Which pages does the insurance dashboard include?
Four pages: Overview, Claims Analysis, Premium Analysis and Policy Lifecycle.
Which slicers can I use?
Every page filters by policy type, claim status, gender, region, month and agent.
What does the overview page show?
Total policies, total premium collected, total claim amount, average premium and average claim amount, plus claim status and monthly policy charts.
How is the policy lifecycle shown?
A decomposition tree breaks policies down into active, expired and canceled so you can see where drop-offs happen.
Related Insurance Templates
- Insurance Dashboard in Excel: the same insurance dashboard in Excel
- Insurance Dashboard in Google Sheets: the insurance dashboard in Google Sheets
- Insurance Claim Dashboard in Power BI: focuses on insurance claims in Power BI
- Insurance KPI Dashboard in Power BI: insurance KPIs in Power BI
- Power BI Dashboard Mega Collection: fifteen Power BI dashboards in one collection
Browse all Power BI dashboards or the Power BI KPI dashboards.

























Reviews
There are no reviews yet.