


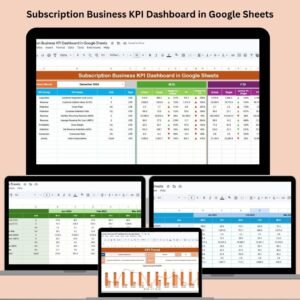
Running a subscription-based business requires constant tracking of performance metrics to ensure growth, retention, and profitability. Our Subscription Business KPI Dashboard in Google Sheets is your all-in-one tool for real-time performance tracking, decision-making, and business scaling. Whether you’re managing SaaS subscriptions, digital memberships, or subscription boxes, this dashboard helps you make data-driven decisions with confidence. 📊💼
🚀 Key Features of the Subscription Business KPI Dashboard
This powerful dashboard template is packed with everything a modern subscription business needs:
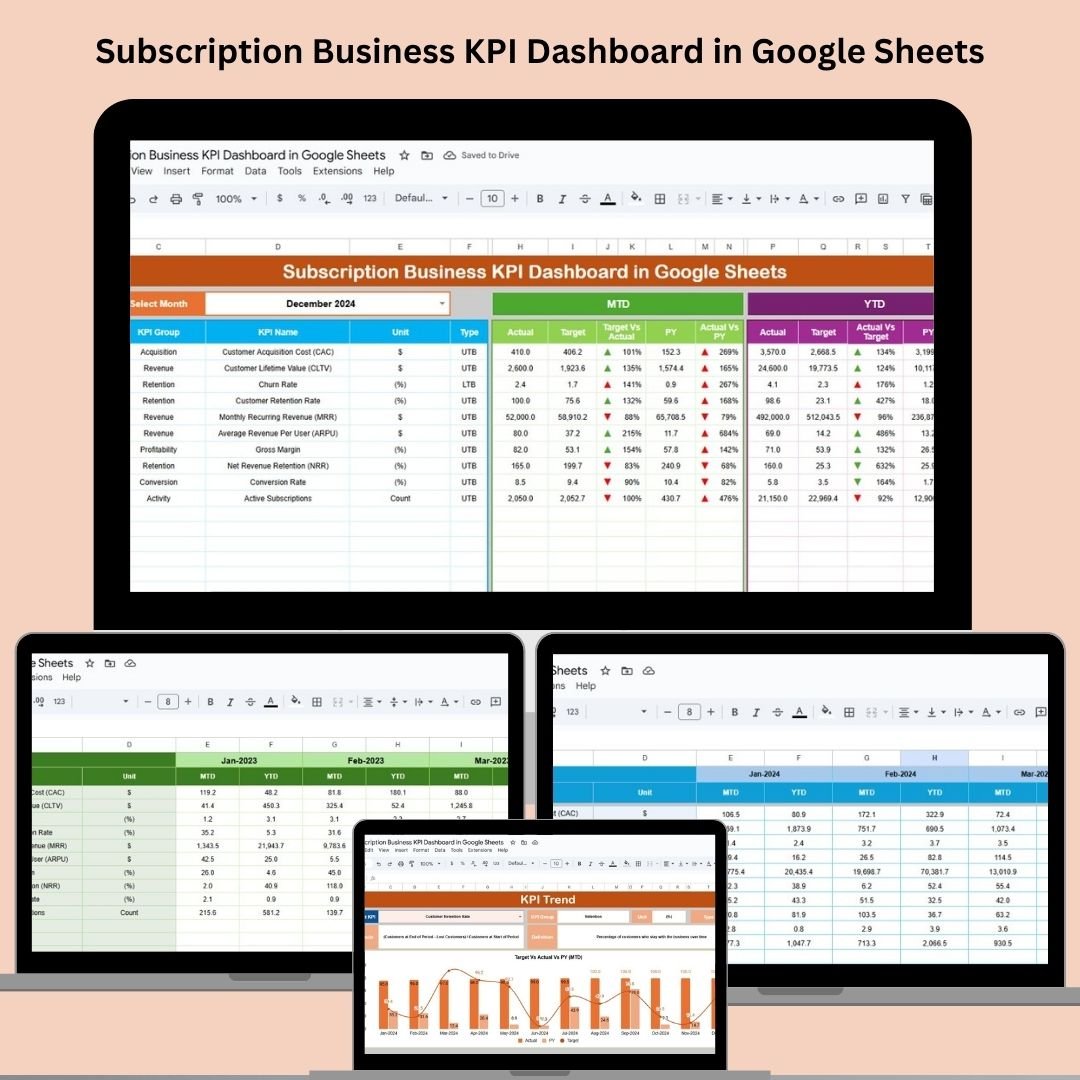
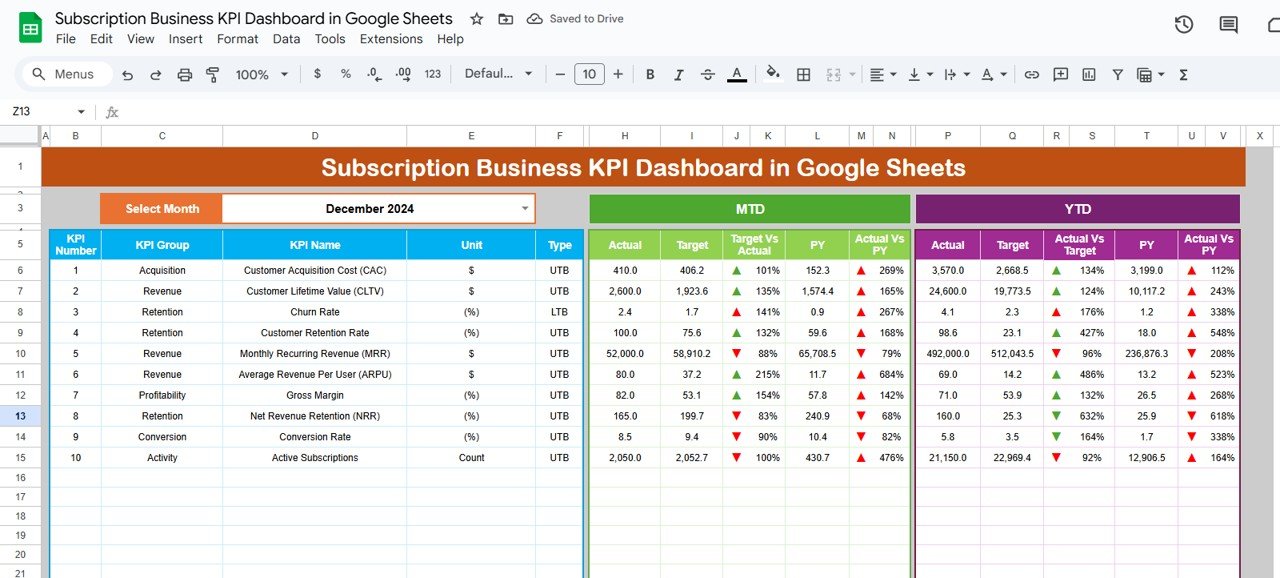
📊 Dashboard Sheet Tab
📅 MTD & YTD Tracking: Monitor month-to-date and year-to-date actuals with one glance.
🎯 Target vs. Actual View: Compare actual performance to set goals.
📈 PY vs. Actual: View comparisons with last year’s performance with up/down indicators.
📍 Select Your Month from a dropdown and see all charts and metrics update instantly.
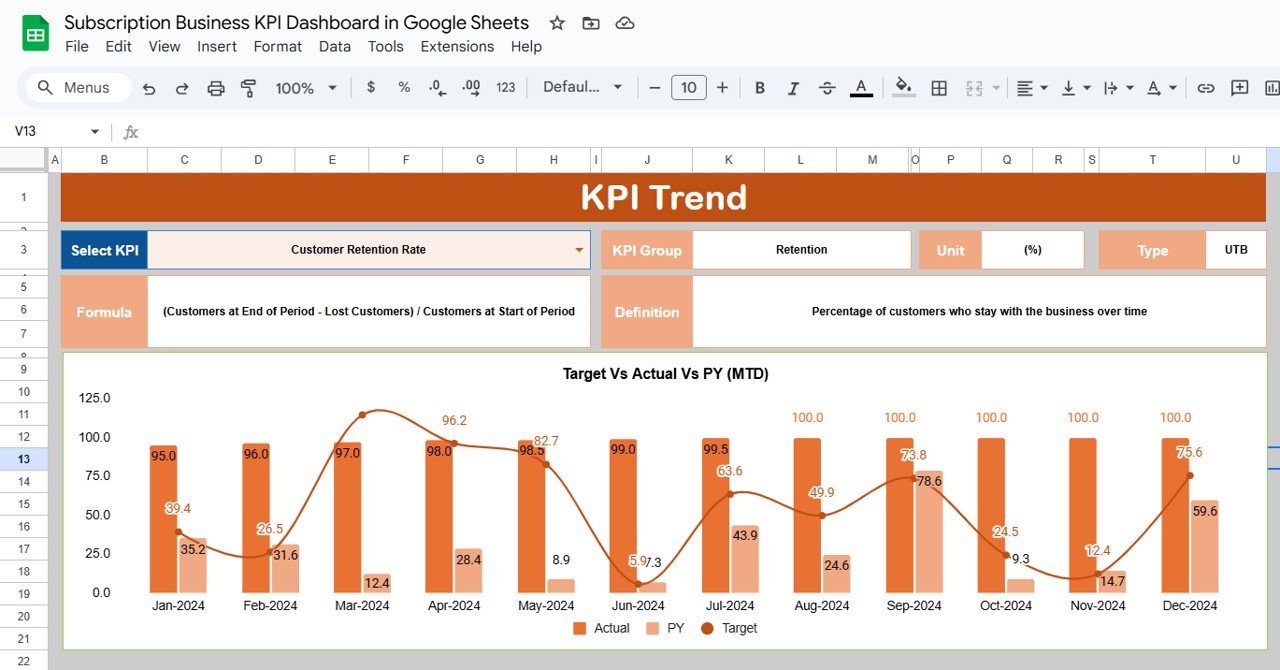
📉 KPI Trend Sheet Tab
📌 Drill-Down by KPI: Select individual KPIs and view trend lines and calculations.
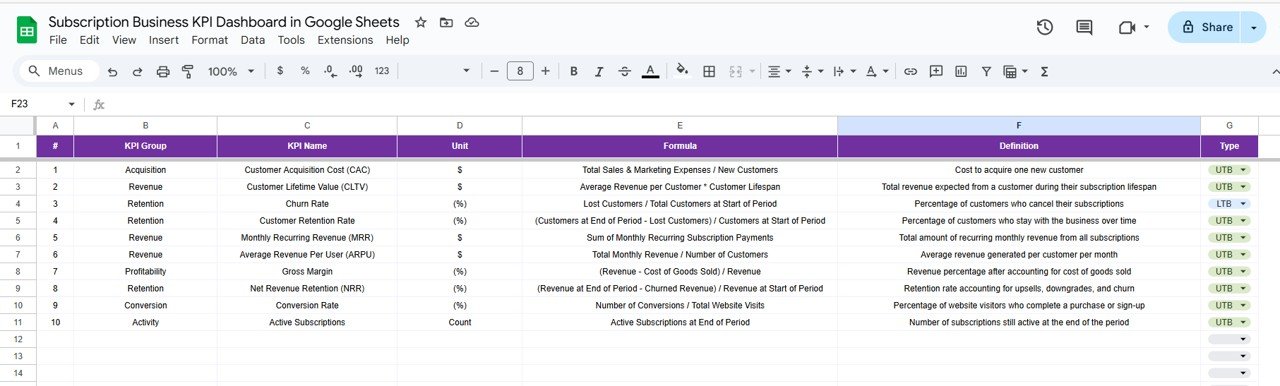
📚 Definitions & Formulas: Know exactly what you’re tracking and how it’s calculated.
🔎 KPI Types: Identify whether each metric is “Lower the Better” (LTB) or “Upper the Better” (UTB).
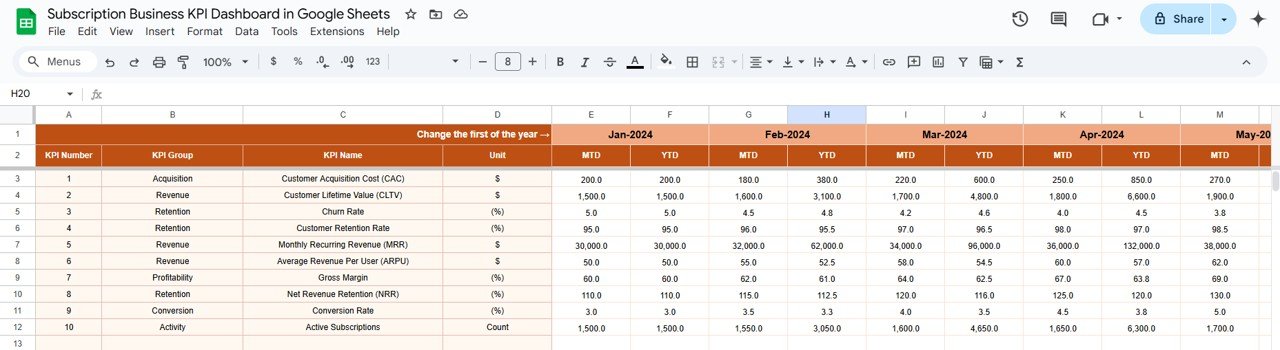
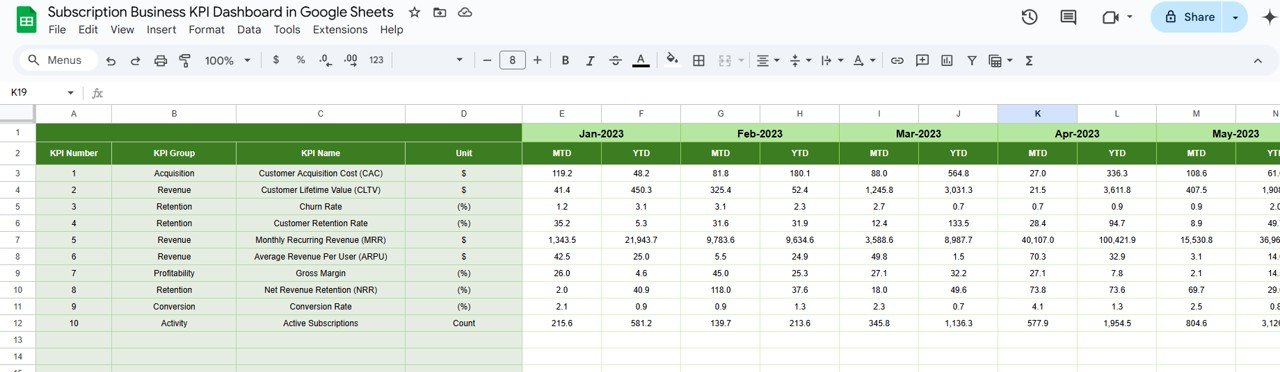
📋 Actual Numbers Sheet Tab
Input your actual values for each KPI—both MTD and YTD.
The dashboard auto-updates as you enter new data.
🎯 Target Sheet Tab
Enter performance targets for each KPI.
Set realistic and trackable goals for your subscription business.
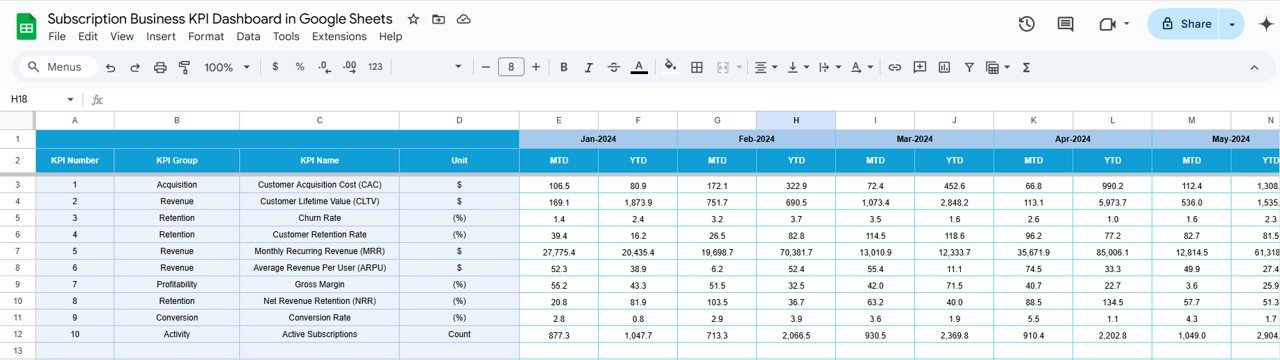
📆 Previous Year Numbers Sheet
Maintain year-over-year comparisons to monitor growth.
Spot performance improvements or areas of concern quickly.
📘 KPI Definition Sheet Tab
Centralized list of KPIs with:
KPI Name
Group
Unit of Measurement
Formula
Description
Perfect for team training and onboarding.
📦 What’s Inside the Subscription Business KPI Dashboard?
✅ 6 Pre-Built Sheets
✅ Easy Dropdown Month Selector
✅ KPI Categories like MRR, CAC, CLTV, Churn
✅ Conditional Formatting (Up/Down Arrows)
✅ Trend Charts, Comparisons, and Performance Cards
✅ Ready for Google Sheets – No Extra Tools Needed
✅ Customizable to Fit Any Subscription Model
🛠️ How to Use the Dashboard?
🔢 Input Your Actual Data in the “Actual Numbers” tab.
🎯 Set Monthly and Yearly Targets in the “Target” sheet.
🔄 Update Monthly for accurate comparisons.
📈 Analyze Performance Trends in the “KPI Trend” tab.
🧠 Use Insights to refine acquisition and retention strategies.
👥 Who Can Benefit from This Dashboard?
🎯 SaaS Companies – Track recurring revenue, churn, and growth.
📦 Subscription Boxes – Monitor retention, CAC, and fulfillment.
🎥 Digital Membership Sites – Evaluate content impact on renewals.
🧾 Service Subscriptions – Improve customer LTV and reduce churn.
📊 Startup Founders & Growth Marketers – Gain a data-backed advantage.
⭐ Why You’ll Love It
✅ Instant Access – Just open in Google Sheets
🧠 No Learning Curve – Simple, intuitive design
📈 Visualize Success – Color-coded cards & trend lines
🎯 Stay Accountable – Track goals, targets, and gaps
💬 Perfect for Reports – Use in team reviews and investor decks
🛠 Fully Customizable – Add your KPIs, charts, or brand colors
📘 Click here to read the Detailed blog post
Watch the step-by-step video Demo:
📺 Visit our YouTube channel to learn step-by-step video tutorials
YouTube.com/@NeotechNavigators
Compatibility and Requirements
- Works in Google Sheets with a free Google account and a web browser.
- Make a copy to your own Google Drive, then share it with your team if you want to work on it together.
- New to Sheets? Google’s guide How to use Google Sheets covers the basics.
Frequently Asked Questions
Which KPIs does the Subscription Business KPI Dashboard in Google Sheets cover?
KPI categories include MRR, CAC, CLTV and churn, with MTD and YTD actuals, targets and previous year values.
How many sheets does it have?
Six: Dashboard, KPI Trend, Actual Numbers, Target, Previous Year Numbers and KPI Definition.
How do I change the month?
Select the month from the dropdown on the Dashboard sheet and all charts and metrics update.
Can I add my own KPIs?
Yes. Add them on the KPI Definition sheet with a name, group, unit, formula and description.
Related Subscription and SaaS Templates
- Subscription Business KPI Dashboard in Excel: the Excel version
- Subscription Business KPI Dashboard in Power BI: the Power BI version
- Subscription Retention KPI Dashboard in Google Sheets: focus on retention
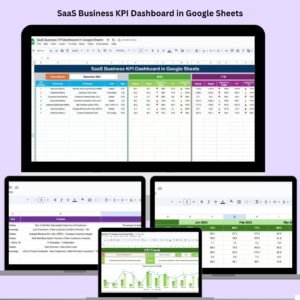
- SaaS Business KPI Dashboard in Google Sheets: KPIs for SaaS companies
Browse all Google Sheets KPI dashboards or the Google Sheets sales and marketing templates.










Reviews
There are no reviews yet.