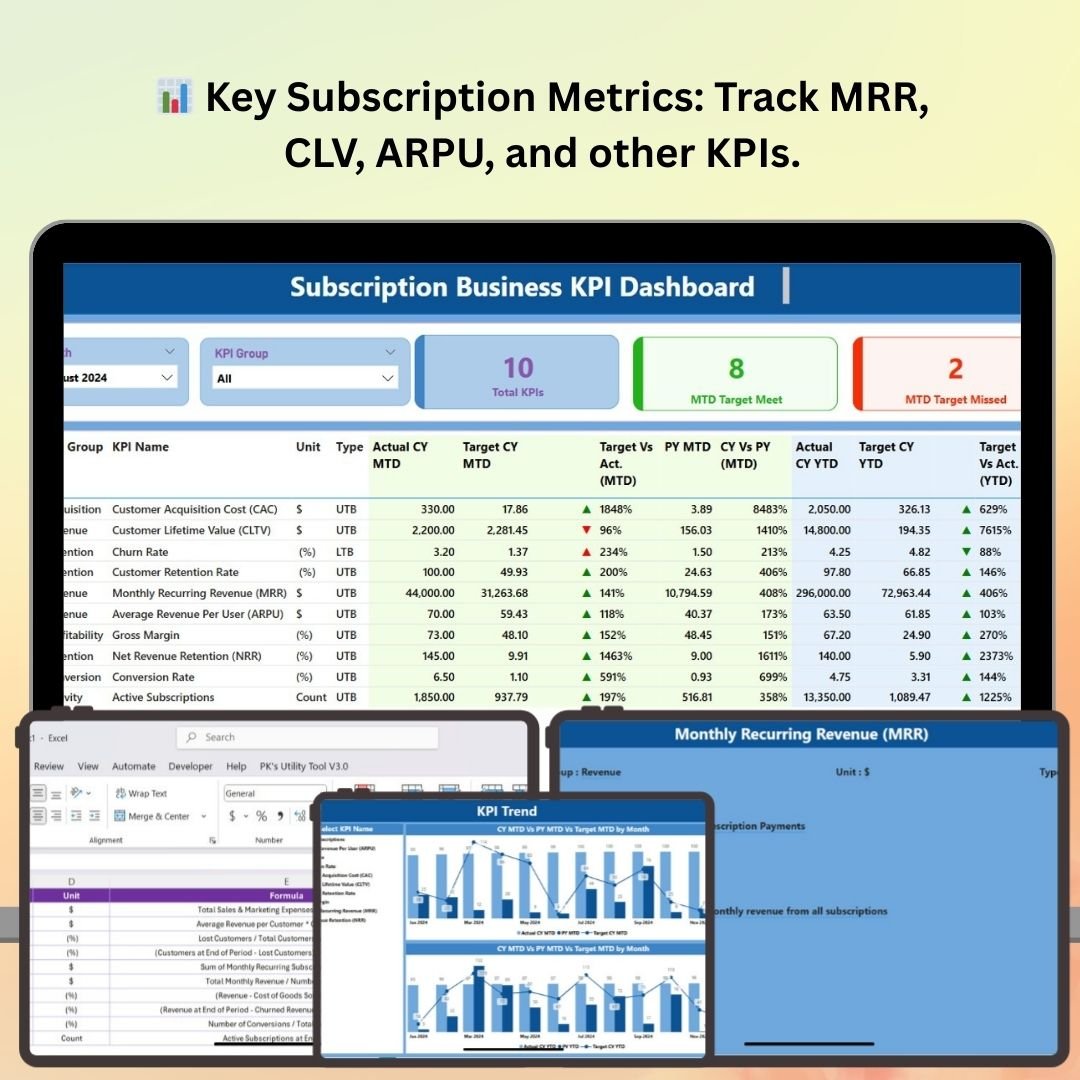
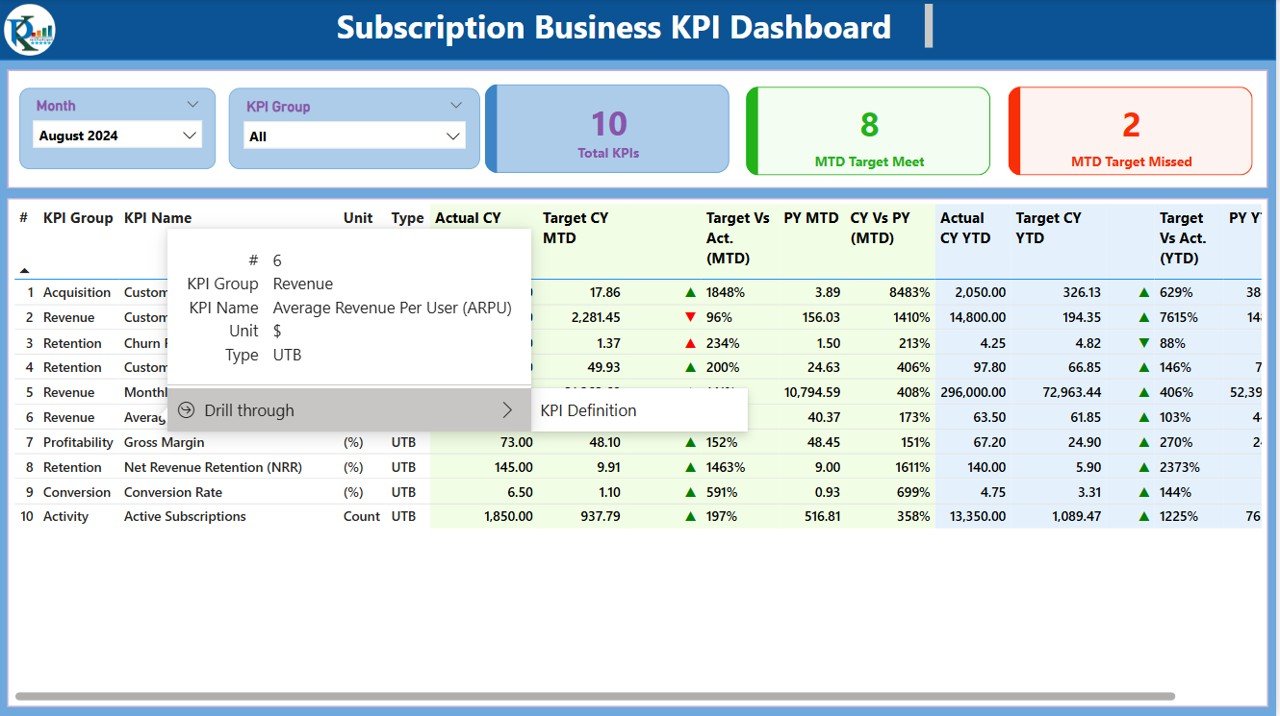
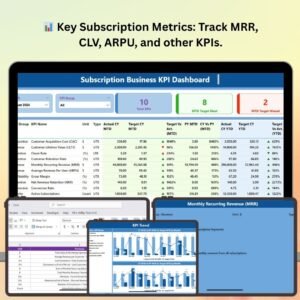
The Subscription Business KPI Dashboard in Power BI is an advanced tool designed to help subscription-based businesses track, analyze, and optimize their performance. With a focus on key subscription metrics such as Monthly Recurring Revenue (MRR), customer churn rate, Customer Lifetime Value (CLV), and subscription growth, this dashboard allows you to gain actionable insights and improve your decision-making process.
This Power BI dashboard integrates real-time data from various sources, providing you with a comprehensive view of your subscription business’s health. With dynamic visualizations and customizable features, you can tailor the dashboard to fit your business needs and ensure your subscription-based operations run efficiently.
Key Features of the Subscription Business KPI Dashboard in Power BI
📊 Key Subscription Metrics Tracking
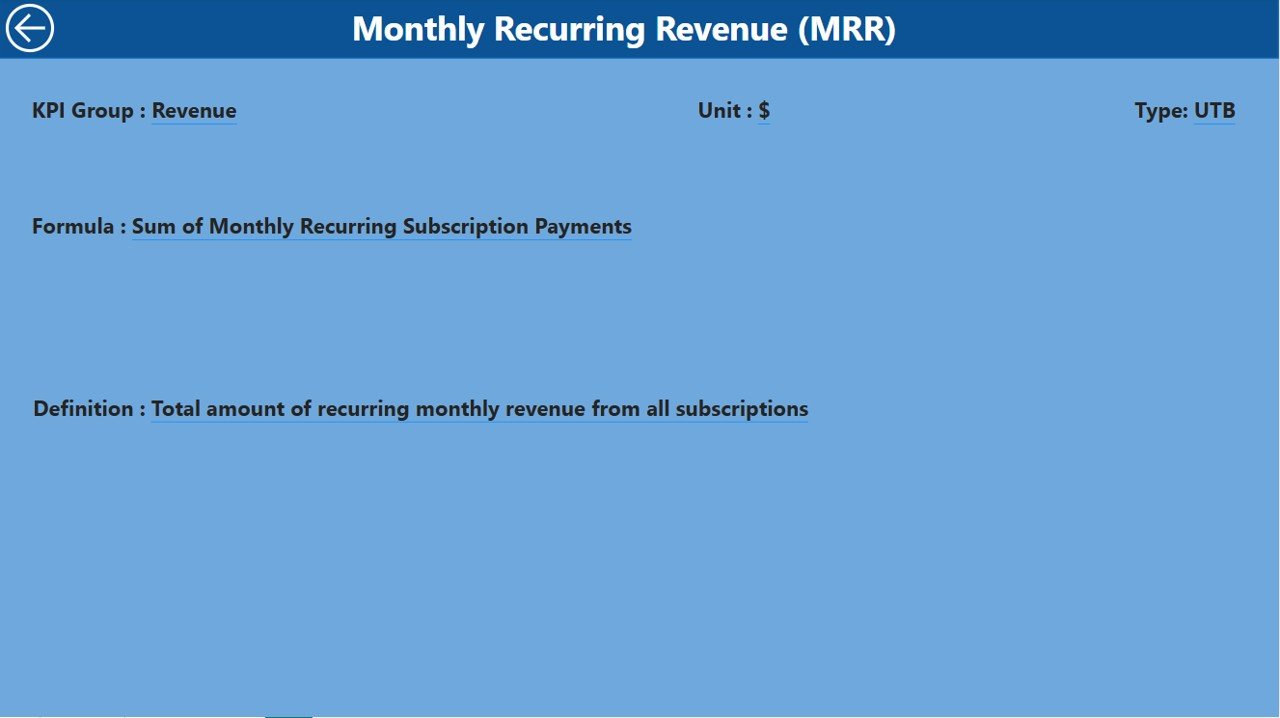
Monitor crucial subscription metrics like Monthly Recurring Revenue (MRR), Customer Lifetime Value (CLV), and Average Revenue per User (ARPU). Track your business’s financial health and predict future revenue growth.
📈 Customer Churn & Retention Analysis
Evaluate customer churn rates and retention patterns to identify opportunities for improving customer satisfaction and reducing churn. Use historical data to predict future retention trends and take proactive actions.
💡 Subscription Growth Insights
Analyze subscription growth trends and track new customer sign-ups, renewals, and cancellations. Visualize the impact of marketing campaigns and pricing changes on growth over time.
🔑 Customer Segmentation & Behavior Tracking
Segment your customers based on behavior, such as subscription plans, usage frequency, and payment patterns. Use these insights to improve personalization and enhance customer experiences.
⚙️ Customizable KPIs & Metrics
Tailor the dashboard to include KPIs that are specific to your subscription model. Add metrics like customer acquisition cost (CAC), user engagement, or refund rates to gain deeper insights.
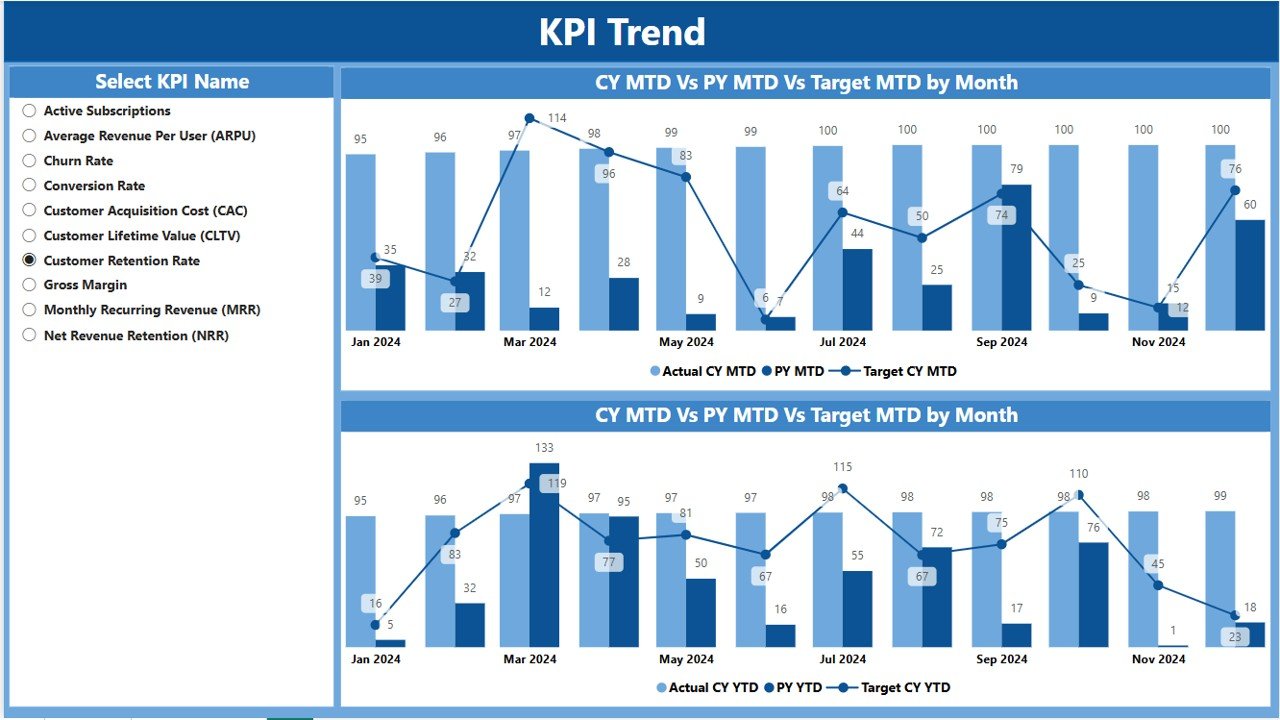
📅 Time-Based Performance Analysis
Track your subscription KPIs over various time periods, such as monthly, quarterly, or yearly. Use time-based visualizations to identify seasonal patterns and trends in customer behavior.
Why You’ll Love the Subscription Business KPI Dashboard in Power BI

✅ Track Essential Subscription Metrics
Monitor key KPIs like MRR, churn rate, and CLV in real time to keep your business on track and optimize performance.
✅ Improve Retention & Reduce Churn
Analyze churn and retention rates to identify trends and improve your customer retention strategies.
✅ Optimize Customer Acquisition & Growth
Track new sign-ups, cancellations, and renewals to understand the effectiveness of marketing campaigns, pricing strategies, and product offerings.
✅ Make Data-Driven Decisions
Leverage actionable insights from the dashboard to make informed decisions that can optimize your subscription model and increase profitability.
✅ Scalable & Customizable
The dashboard is scalable and customizable to meet the unique needs of your subscription-based business. Whether you’re a small startup or a large enterprise, you can adapt the dashboard to fit your specific requirements.
What’s Inside the Subscription Business KPI Dashboard in Power BI?
-
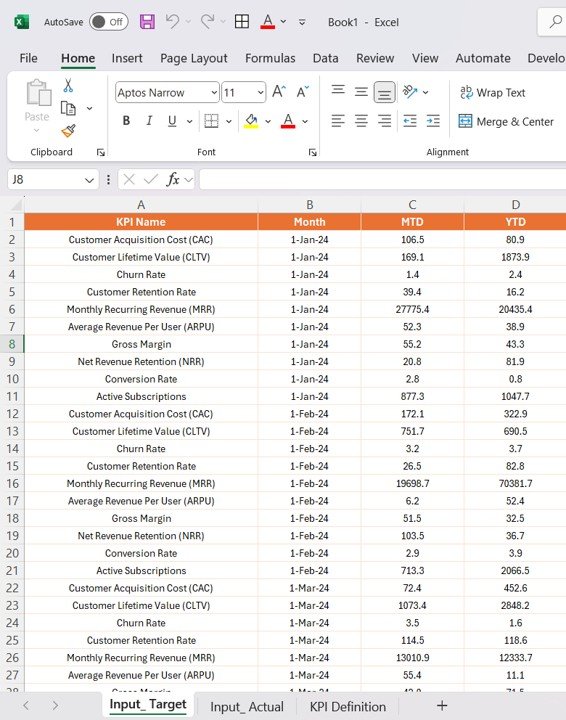
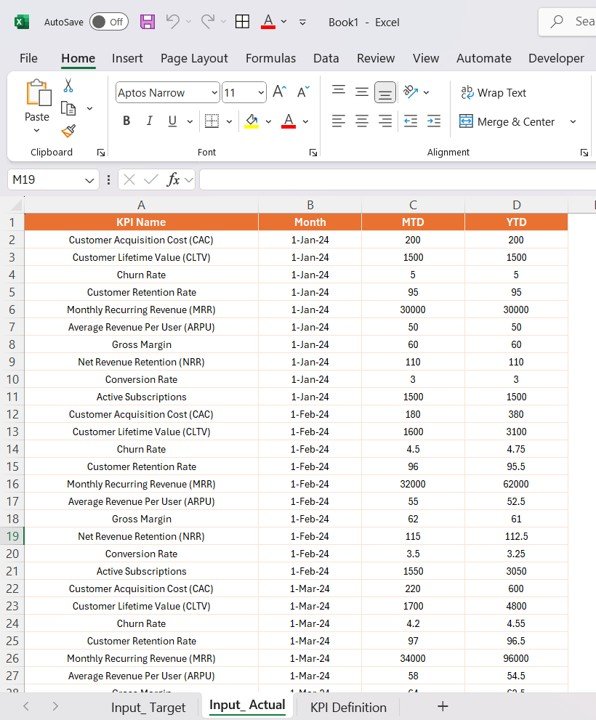
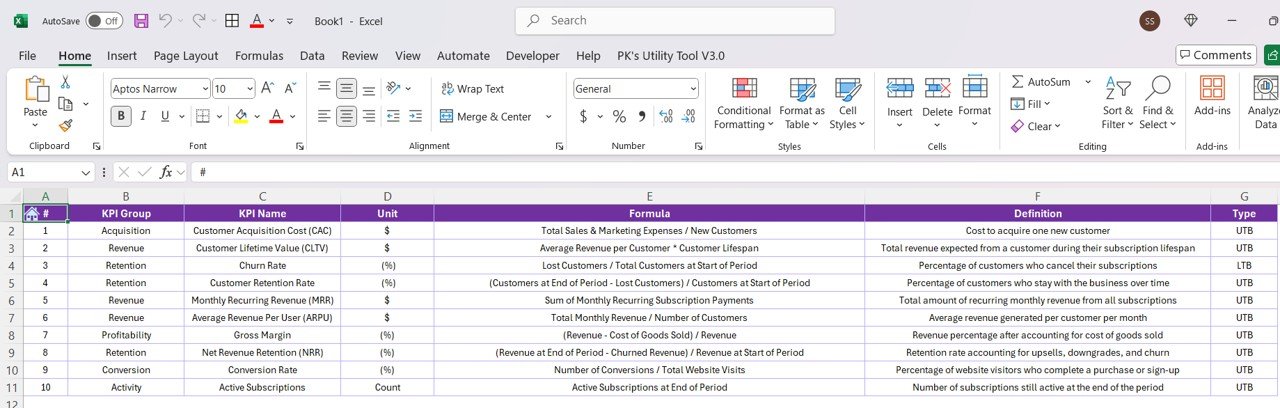
Key Subscription Metrics Tracking: Monitor MRR, CLV, ARPU, and other financial metrics.
-
Churn & Retention Analysis: Track churn rates and retention patterns.
-
Subscription Growth Insights: Analyze trends in sign-ups, renewals, and cancellations.
-
Customer Segmentation: Segment customers based on behavior and usage.
-
Customizable KPIs: Tailor the dashboard to your subscription model and add custom metrics.
-
Time-Based Performance Analysis: Use time-based visualizations to identify seasonal trends.
How to Use the Subscription Business KPI Dashboard in Power BI
1️⃣ Download the Template: Access the Subscription Business KPI Dashboard in Power BI instantly.
2️⃣ Integrate Your Data Sources: Connect your subscription and payment systems to the dashboard for real-time updates.
3️⃣ Track KPIs & Performance: Monitor key metrics such as MRR, churn, and CLV.
4️⃣ Analyze Customer Behavior: Use customer segmentation to track usage, plans, and preferences.
5️⃣ Generate Reports & Insights: Use the dashboard to generate insights on customer retention, acquisition, and growth.
Who Can Benefit from the Subscription Business KPI Dashboard in Power BI?
🔹 Subscription-Based Businesses (SaaS, Media, eCommerce, etc.)
🔹 Marketing & Sales Teams
🔹 Product Managers
🔹 Finance & Analytics Departments
🔹 Customer Retention & Engagement Teams
🔹 Business Executives & Managers
🔹 Data Analysts & Business Intelligence Professionals
Optimize your subscription-based business with the Subscription Business KPI Dashboard in Power BI. Track essential KPIs, improve customer retention, and drive growth through data-driven insights.
Click here to read the Detailed blog post
Visit our YouTube channel to learn step-by-step video tutorials
Youtube.com/@PKAnExcelExpert


Reviews
There are no reviews yet.