



Subscription-based businesses survive on one thing—retention. No matter how strong your acquisition strategy is, long-term success depends on how many customers stay, renew, and continue paying month after month. This is why the Subscription Retention KPI Dashboard in Google Sheets is a game-changer for SaaS founders, membership platforms, OTT services, creators, consultants, and digital product entrepreneurs.Subscription Retention KPI Dashboard in Google Sheets
This ready-to-use dashboard helps you track churn, renewal patterns, subscriber growth, revenue stability, MTD/YTD performance, and previous year comparisons—all in a single, beautifully structured Google Sheets system. With automated charts, powerful KPI logic, and instant insights, you can finally understand what drives retention and where you’re losing subscribers.Subscription Retention KPI Dashboard in Google Sheets
Built completely in Google Sheets, the dashboard requires no software, no coding, and no installation. It updates in real time, works on any device, and allows team collaboration anywhere in the world.Subscription Retention KPI Dashboard in Google Sheets

✨ Key Features of the Subscription Retention KPI Dashboard in Google Sheets
📊 Dashboard Sheet – Monthly & Yearly KPI Overview
This is the main page where all retention insights come to life. Simply choose a month from the drop-down in cell D3, and the dashboard instantly updates. You can analyze:
MTD performance
YTD performance
Actual vs Target
Actual vs Previous Year
Trend indicators
Conditional formatting
Every number updates automatically, helping you spot churn patterns and retention opportunities at just one glance.
📈 KPI Trend Sheet – In-Depth Performance Analysis
This sheet gives you a complete breakdown of any KPI. Select a KPI from cell C3, and you will instantly see:
KPI Group
KPI Unit
KPI Type (LTB / UTB)
Formula
Definition
It also displays two powerful charts:
✔ MTD Trend Chart – Month-by-month movement
✔ YTD Trend Chart – Full-year progress
These charts highlight performance spikes, churn signals, and retention trends.
🧮 Actual Numbers Sheet – Enter Monthly Performance
This sheet captures:
Actual MTD numbers
Actual YTD numbers
First month of the year (cell E1)
All other sheets depend on this input, so your dashboard remains accurate throughout the year.
🎯 Target Sheet – Set Monthly Targets
Define:
MTD targets
YTD targets
Expected retention performance
Targets help you evaluate if your subscriptions are improving or slipping.
📘 Previous Year Numbers – Compare With Last Year
This sheet stores:
Previous Year MTD
Previous Year YTD
It boosts your dashboard with “vs PY” analytics to measure progress over time.
📑 KPI Definition Sheet – Your Retention Formula Library
This sheet includes:
KPI Name
KPI Unit
Formula
Definition
KPI Type (Upper/Lower the Better)
It acts as your reference guide for every metric used in the dashboard.
📦 What’s Inside the Subscription Retention KPI Dashboard in Google Sheets
Inside this template, you get:
A complete retention monitoring system
Fully automated charts
Multiple comparison layers (Target, Actual, Previous Year)
Clean data entry sheets
KPI trend analysis
Dynamic drop-downs
Error-free formulas
Cloud-based reporting
It’s designed for professionals who want insights without complexity.
🛠️ How to Use the Subscription Retention KPI Dashboard in Google Sheets
- 1️⃣ Enter actual numbers monthly
- Fill MTD and YTD values based on your subscription performance.
- 2️⃣ Set targets in the Target Sheet
- Define expected retention rates, churn numbers, and renewal percentages.
- 3️⃣ Analyze the main dashboard
- Watch auto-generated charts highlight growth, decline, and improvement areas.
- 4️⃣ Use the KPI Trend Sheet for deeper insights
- Identify monthly patterns and long-term behaviors in subscriber retention.
- 5️⃣ Compare with previous year
- Evaluate growth or decline using PY numbers.
- 6️⃣ Customize as needed
Add new KPIs, change formulas, or update definitions easily.
👥 Who Can Benefit from This Dashboard
💻 SaaS Founders & Product Teams
Track churn, retention, lifetime value, renewals, and subscription stability.
📚 E-Learning Platforms
Monitor student renewals, course retention, and subscription consistency.
🎬 OTT & Content Subscription Services
Analyze watch-to-renew patterns, loyalty behavior, and user drop-off.
📈 Digital Product Creators
Understand subscriber trends across memberships, templates, and recurring plans.
💼 Marketing & Growth Teams
Use the trend analysis to reduce churn and increase customer lifetime value.
This Subscription Retention KPI Dashboard in Google Sheets is more than just analytics—it’s a decision-making engine that reveals the true health of your subscription business. With structured worksheets, trend scans, and MTD/YTD performance tracking, it gives you the clarity you need to strengthen retention, enhance customer loyalty, and forecast revenue with confidence.
Click Here to Read the Detailed Blog Post
Watch the step-by-step video Demo:
Visit our YouTube channel for step-by-step tutorials:
👉 Youtube.com/@NeotechNavigators
Compatibility and Requirements
- Runs in Google Sheets. You need a free Google account and a web browser.
- The month and KPI selectors are dropdowns. Google’s guide: Create an in-cell dropdown list.
Frequently Asked Questions
Which sheets are included?
Dashboard, KPI Trend, Actual Numbers, Target, Previous Year Numbers and KPI Definition sheets.
How do I change the reporting month?
Choose a month from the dropdown in cell D3 on the Dashboard sheet and the dashboard updates.
Can I study one KPI in detail?
Yes. Select a KPI in cell C3 on the KPI Trend sheet to see its group, unit, type, formula, definition and MTD and YTD trend charts.
Can I compare with last year?
Yes. Enter previous year MTD and YTD values to get actual vs previous year comparisons.
Can I add my own retention KPIs?
Yes. You can add new KPIs, change formulas or update definitions.
Related Subscription and Retention Templates
- Subscription Retention KPI Dashboard in Excel: the same KPIs in Excel
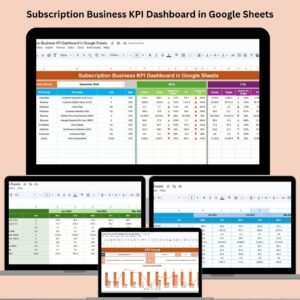
- Subscription Business KPI Dashboard in Google Sheets: wider subscription business KPIs
- Subscription Business KPI Dashboard in Power BI: subscription KPIs in Power BI
- Subscription Box KPI Dashboard in Google Sheets: KPIs for subscription box businesses
- Subscription and SaaS Renewal Calendar in Excel: keeps renewal dates on a calendar
Browse all Google Sheets KPI dashboards or the Google Sheets templates.
































Reviews
There are no reviews yet.