


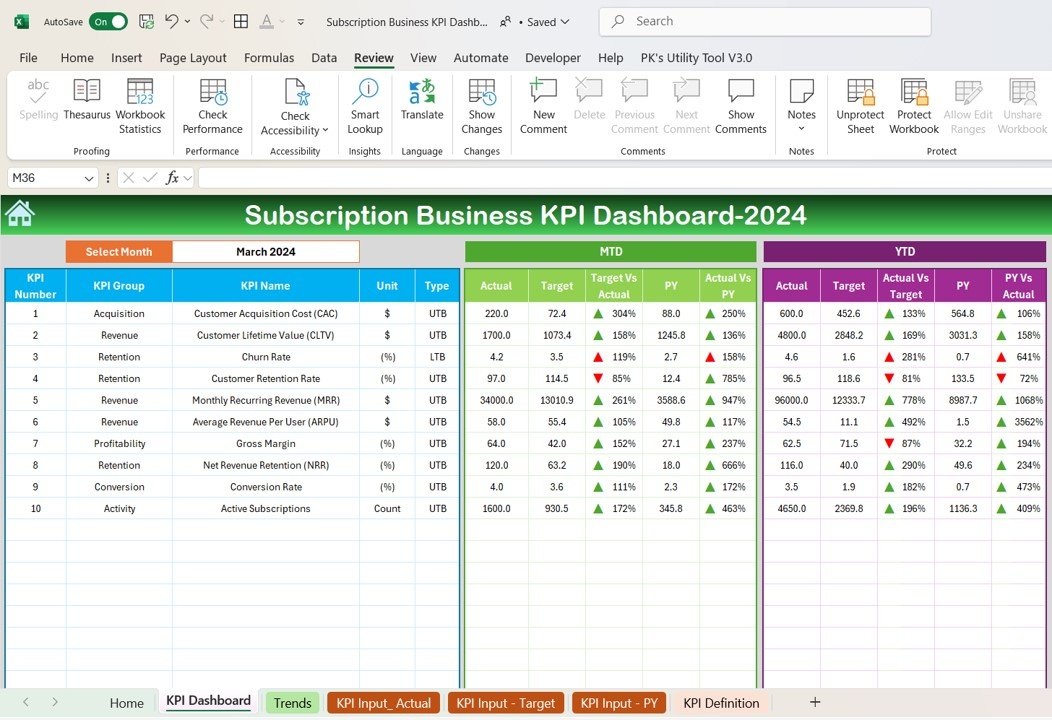
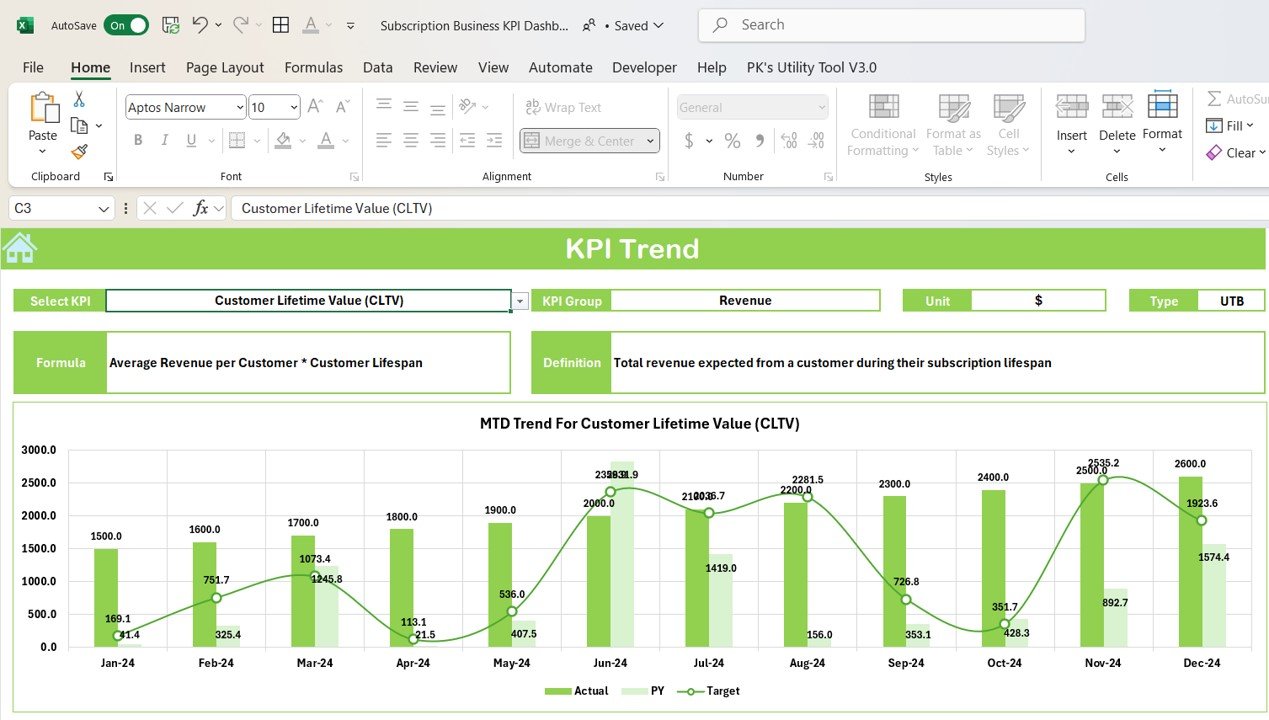
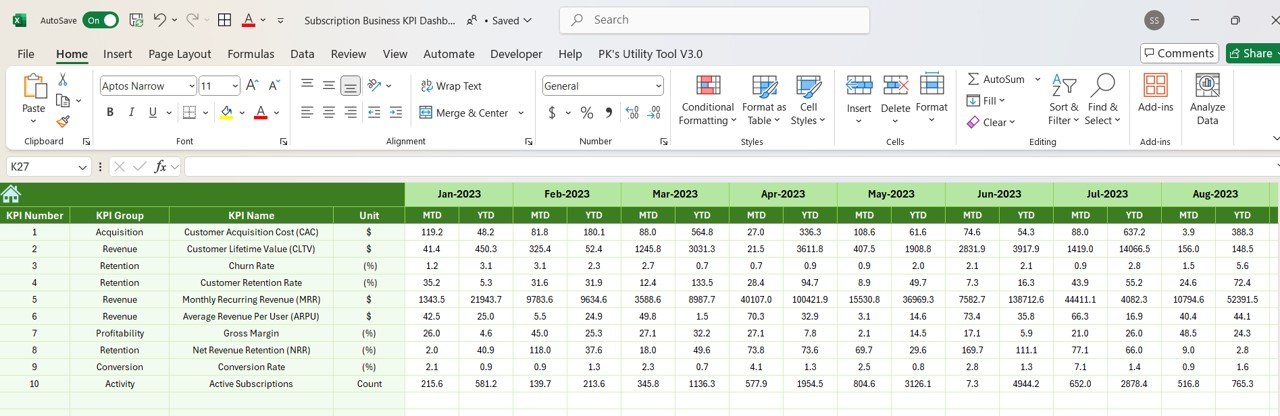
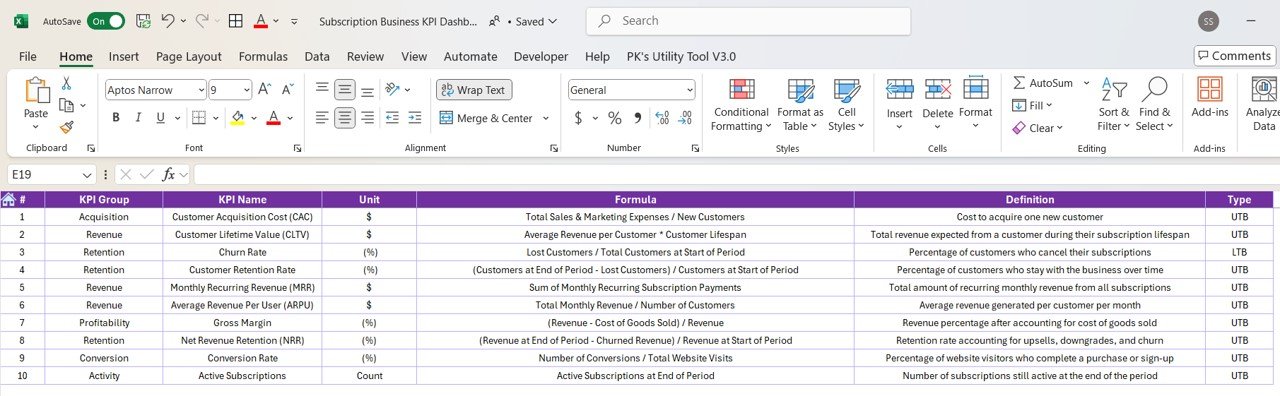

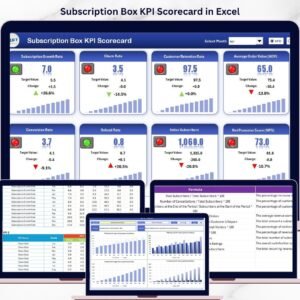
The Subscription Business KPI Dashboard in Excel is a comprehensive tool designed to help subscription-based businesses monitor and optimize their performance. Whether you run a SaaS company, a subscription box service, or any other business model with recurring revenue, this Excel dashboard provides a clear overview of your key performance indicators (KPIs). Track metrics like monthly recurring revenue (MRR), customer churn, lifetime value (LTV), customer acquisition cost (CAC), and more to make data-driven decisions and improve business outcomes.
With real-time tracking of important subscription metrics, this dashboard helps you optimize customer retention, forecast future revenue, and better understand your subscription business’s financial health. It’s fully customizable and easy to use, making it perfect for business owners, finance teams, and subscription managers who want to improve operational efficiency and maximize profitability.
Key Features of the Subscription Business KPI Dashboard in Excel
📊 Track Monthly Recurring Revenue (MRR)
Monitor your monthly recurring revenue to get a clear view of your business’s predictable income. Track MRR growth and assess the impact of new customer acquisition, upgrades, and churn.
⚡ Monitor Customer Churn & Retention
Track customer churn rates and retention metrics to identify opportunities to reduce churn. Understand why customers are leaving and implement strategies to improve retention and loyalty.
💰 Measure Customer Lifetime Value (LTV)
Evaluate the lifetime value of your customers to understand how much each customer contributes to your business over time. Use this metric to optimize your customer acquisition strategies.
📈 Assess Customer Acquisition Cost (CAC)
Measure how much it costs to acquire new customers. This KPI is essential for evaluating the effectiveness of your marketing and sales efforts and ensuring that your customer acquisition strategy is cost-effective.
🖥️ Real-Time Insights & Dynamic Reporting
The Excel dashboard offers real-time updates and dynamic visualizations of key KPIs. Use slicers and filters to analyze trends, track business performance, and make strategic decisions that will drive your subscription business forward.
Why You’ll Love the Subscription Business KPI Dashboard in Excel
✅ Track Predictable Revenue (MRR)
Monitor monthly recurring revenue to assess the stability of your business and track the success of your subscription model.
✅ Reduce Customer Churn
Track churn and retention metrics to understand your customer base and implement strategies to improve customer loyalty and reduce churn.
✅ Optimize Customer Acquisition
Measure the cost of acquiring new customers and track the effectiveness of your marketing campaigns. Ensure that your acquisition efforts are cost-effective and contribute to business growth.
✅ Increase Customer Lifetime Value (LTV)
Monitor the long-term value of customers and adjust your pricing, products, and marketing to increase customer retention and maximize lifetime value.
✅ Make Data-Driven Business Decisions
Leverage real-time data and insights to optimize pricing, marketing strategies, and customer retention efforts for maximum profitability and business growth.
What’s Inside the Subscription Business KPI Dashboard Template?
- MRR & Revenue Tracking: Monitor monthly recurring revenue and forecast future income.
- Churn & Retention Metrics: Track customer churn, retention rates, and identify areas for improvement.
- Customer Lifetime Value (LTV): Measure and optimize customer lifetime value to enhance profitability.
- Customer Acquisition Cost (CAC): Track the cost of acquiring new customers and assess marketing effectiveness.
- Real-Time Data Insights: Access live data on all your subscription business KPIs to make informed decisions.
- Customizable Dashboard: Tailor the dashboard to track the KPIs that matter most to your business.
How to Use the Subscription Business KPI Dashboard in Excel
1️⃣ Download the Template: Get instant access to your Subscription Business KPI Dashboard in Excel.
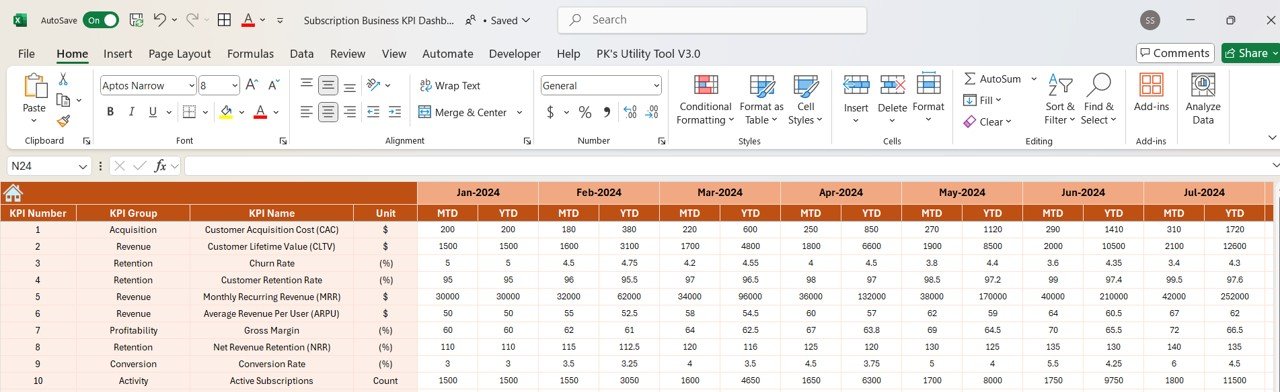
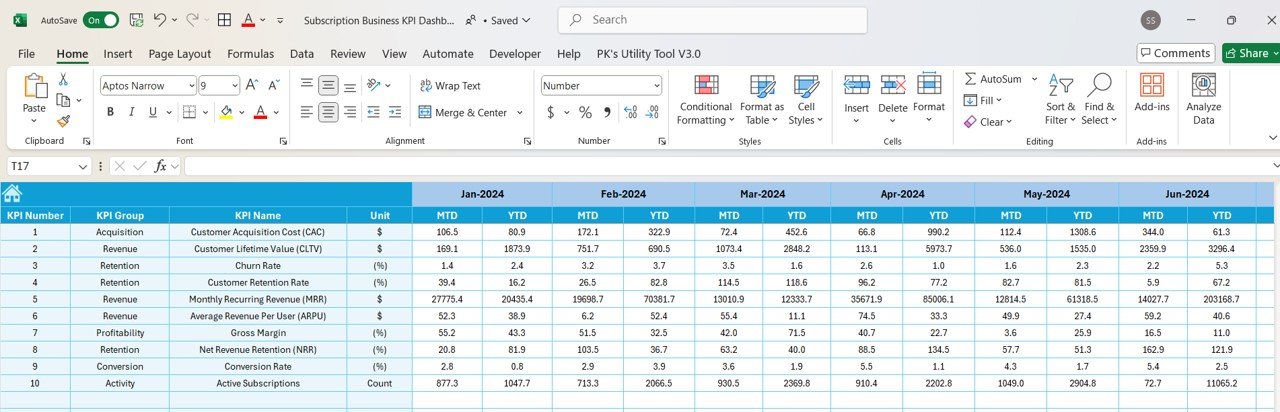
2️⃣ Input Your Data: Enter your subscription business data, including MRR, churn rates, customer acquisition costs, and LTV.
3️⃣ Track & Monitor KPIs: Use the dashboard to track monthly recurring revenue, churn, customer acquisition, and lifetime value in real-time.
4️⃣ Analyze & Optimize: Use the insights from the dashboard to improve retention, reduce churn, and increase revenue.
Who Can Benefit from the Subscription Business KPI Dashboard in Excel?
🔹 SaaS Business Owners & Managers
🔹 Subscription Box Service Providers
🔹 E-commerce & Subscription-Based Retailers
🔹 Marketing & Sales Teams
🔹 Financial Analysts & Business Owners
🔹 Anyone Managing a Subscription Business Model
Ensure that your subscription business is running smoothly and efficiently with the Subscription Business KPI Dashboard in Excel. Track and optimize key KPIs like MRR, customer churn, and acquisition costs to maximize profitability and grow your business.
Click here to read the Detailed blog post
Visit our YouTube channel to learn step-by-step video tutorials
Youtube.com/@PKAnExcelExpert























Reviews
There are no reviews yet.