



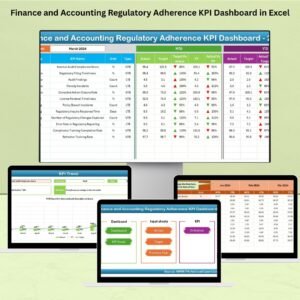
The Finance and Accounting Regulatory Adherence KPI Dashboard in Excel is an essential tool designed for finance professionals, accountants, and compliance teams to track and manage their adherence to financial regulations. This Excel-based dashboard helps you monitor key performance indicators (KPIs) related to financial regulations, ensuring that your organization remains compliant with all necessary standards and laws.
This dashboard makes it easier to assess your financial practices against regulatory requirements, track key compliance metrics, and generate reports for audits. With clear visualizations and real-time data updates, you can monitor compliance performance, identify any potential gaps, and take proactive steps to ensure your organization stays on track.
Key Features of the Finance and Accounting Regulatory Adherence KPI Dashboard in Excel
📊 Regulatory Adherence Monitoring
Track adherence to important financial regulations, including tax laws, accounting standards, and corporate governance guidelines. Monitor how well your organization is complying with these regulations in real time.
📈 Compliance KPI Tracking
Monitor specific compliance-related KPIs such as audit completion rates, tax filing accuracy, and financial reporting standards compliance. Evaluate performance against regulatory requirements and identify areas for improvement.
🔍 Audit & Report Tracking
Keep track of completed audits, reports, and compliance assessments. Ensure that all necessary documentation is submitted on time and meets regulatory standards.
📉 Risk & Gap Identification
Identify potential risks and gaps in compliance. Highlight areas where corrective actions are needed to mitigate risks and ensure full regulatory adherence.
⚙️ Customizable KPIs & Metrics
Customize the dashboard to reflect the specific KPIs relevant to your finance and accounting department. Whether it’s internal controls, external audits, or financial reporting accuracy, you can tailor the dashboard to suit your needs.
📅 Time-Based Performance Analysis
Analyze compliance performance over different time periods (daily, monthly, quarterly, and yearly). This helps identify trends, track improvements, and assess whether your organization is maintaining long-term compliance.
Why You’ll Love the Finance and Accounting Regulatory Adherence KPI Dashboard in Excel

✅ Stay Compliant with Ease
Monitor your regulatory adherence status in real time, ensuring that you are always in compliance with financial regulations and standards.
✅ Track Key Compliance KPIs
Track key financial and accounting KPIs, such as audit completion rates, tax filing accuracy, and internal control compliance. This helps identify areas that need attention and improvement.
✅ Improve Risk Management
Use the insights from the dashboard to identify potential risks or gaps in your compliance efforts. Take corrective actions promptly to avoid legal complications or financial penalties.
✅ Data-Driven Decisions
Make informed decisions based on real-time compliance data. With accurate and up-to-date information, you can ensure that your financial practices align with regulatory requirements.
✅ Customizable for Your Needs
The dashboard is fully customizable to suit your organization’s specific financial compliance requirements. Track the KPIs that matter most to your business and adjust the metrics as needed.
What’s Inside the Finance and Accounting Regulatory Adherence KPI Dashboard in Excel?
Regulatory Adherence Monitoring: Track compliance with financial regulations and accounting standards.
Compliance KPI Tracking: Monitor important KPIs such as audit completion rates and tax filing accuracy.
Audit & Report Tracking: Keep track of completed audits and compliance reports.
Risk & Gap Identification: Identify potential risks and compliance gaps.
Time-Based Performance Analysis: Monitor compliance performance over different time periods.
Customizable KPIs: Tailor the dashboard to track KPIs relevant to your organization.
How to Use the Finance and Accounting Regulatory Adherence KPI Dashboard in Excel
1️⃣ Download the Template: Access the Finance and Accounting Regulatory Adherence KPI Dashboard in Excel instantly.
2️⃣ Set Up Your Compliance KPIs: Input the relevant financial compliance KPIs for your organization.
3️⃣ Track & Monitor Regulatory Adherence: Monitor your organization’s compliance with financial regulations and standards.
4️⃣ Analyze Risks & Gaps: Use the dashboard to identify potential risks and take corrective action.
5️⃣ Generate Reports & Improve Processes: Generate real-time compliance reports and make data-driven decisions to improve financial adherence.
Who Can Benefit from the Finance and Accounting Regulatory Adherence KPI Dashboard in Excel?
🔹 Compliance & Regulatory Teams
🔹 Finance & Accounting Professionals
🔹 Internal & External Auditors
🔹 CFOs & Finance Managers
🔹 Risk & Compliance Managers
🔹 Small & Medium Enterprises (SMBs)
🔹 Large Corporations with Complex Financial Structures
Ensure your organization remains compliant with financial regulations and standards using the Finance and Accounting Regulatory Adherence KPI Dashboard in Excel. Monitor performance, track key compliance metrics, and mitigate risks effectively.
Click here to read the Detailed blog post
Visit our YouTube channel to learn step-by-step video tutorials
Youtube.com/@PKAnExcelExpert
Watch the step-by-step video Demo:
Compatibility and Requirements
- Works in Microsoft Excel desktop (Excel 2016 or later, or Microsoft 365).
- The dashboard shows KPI trends over daily, monthly, quarterly and yearly periods. Microsoft explains how to build them in Create a chart from start to finish.
Frequently Asked Questions
What does this dashboard track?
It tracks adherence to financial regulations such as tax laws, accounting standards and corporate governance guidelines. It also tracks compliance KPIs like audit completion rates, tax filing accuracy and financial reporting standards compliance.
Can I change the KPIs?
Yes. The dashboard is customizable, so you can track the KPIs your finance and accounting team needs, such as internal controls, external audits or financial reporting accuracy.
Can I see compliance over time?
Yes. It includes time-based performance analysis across daily, monthly, quarterly and yearly periods, so you can spot trends and check whether compliance holds up over the long term.
How does it help with risk?
It highlights risks and gaps in compliance, so you can take corrective action before they turn into legal problems or financial penalties.
Is there another Finance and Accounting dashboard on risk?
Yes. See the Finance and Accounting Risk Management KPI Dashboard in Excel.
Related Finance and Accounting Templates
- Finance and Accounting Risk Management KPI Dashboard in Excel: a risk-focused view for finance teams
- Finance and Accounting Quality Assurance KPI Dashboard in Excel: quality KPIs for finance processes
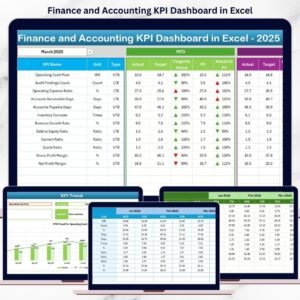
- Finance and Accounting KPI Dashboard in Excel: general finance and accounting KPIs
- Finance and Accounting KPI Dashboard in Power BI: the Power BI edition of the KPI dashboard
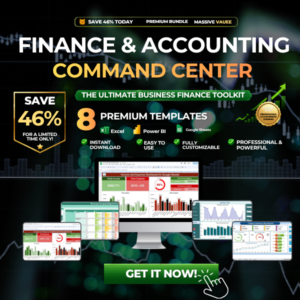
- Finance & Accounting Command Center: 8 finance templates in one bundle
Browse all Excel KPI dashboards.


































Reviews
There are no reviews yet.