



The Finance and Accounting Customer Feedback KPI Dashboard in Excel is an essential tool designed to help financial institutions, accounting firms, and finance teams track, analyze, and improve customer feedback. This Excel-based dashboard provides real-time insights into key performance indicators (KPIs) such as customer satisfaction, service quality, feedback volume, and response times. It empowers finance teams to evaluate customer interactions, identify potential issues, and optimize customer service strategies based on data-driven decisions.
This dashboard is particularly useful for monitoring feedback related to financial products, accounting services, and customer support. With an easy-to-read interface and customizable features, you can tailor the dashboard to reflect your specific customer service goals and ensure that your finance and accounting departments are consistently meeting or exceeding customer expectations.
Key Features of the Finance and Accounting Customer Feedback KPI Dashboard in Excel
📊 Customer Feedback Tracking
Track customer feedback across different channels, including surveys, support tickets, and direct communication. Measure feedback volume and categorize responses to identify common issues and areas for improvement.
📈 Customer Satisfaction Monitoring
Monitor key satisfaction metrics such as Net Promoter Score (NPS), customer satisfaction ratings, and overall sentiment. Use these insights to assess customer loyalty and improve service offerings.
💬 Response Time & Resolution Tracking
Measure how quickly your team is responding to and resolving customer feedback. This helps ensure that customers are addressed in a timely manner, which is critical for maintaining satisfaction and trust.
📅 Time-Based Analysis
Analyze customer feedback over different time periods (daily, weekly, monthly). Track trends in satisfaction, feedback volume, and response times, and use this data to identify patterns and make necessary improvements.
⚙️ Customizable KPIs & Metrics
Customize the dashboard to track KPIs and metrics most relevant to your finance and accounting teams. Add custom feedback categories or specific service-related metrics to align with your business goals.
📈 Data Visualization & Reporting
Visualize feedback trends with dynamic charts and graphs. Use these visualizations to communicate performance insights to stakeholders and identify opportunities for improvement.
Why You’ll Love the Finance and Accounting Customer Feedback KPI Dashboard in Excel

✅ Comprehensive Feedback Tracking
Easily track and categorize customer feedback to identify common issues and areas for improvement in your finance and accounting services.
✅ Measure & Improve Customer Satisfaction
Track customer satisfaction metrics, such as NPS and feedback ratings, to gauge overall sentiment and ensure that your customers are happy with your services.
✅ Optimize Response Times & Efficiency
Monitor response and resolution times to ensure that your team is addressing customer concerns quickly. Improve team efficiency and customer experience with actionable insights.
✅ Data-Driven Decisions for Service Improvement
Leverage the insights from the dashboard to refine your customer service strategies and continuously improve service quality.
✅ Customizable & Scalable for Your Needs
Adapt the dashboard to meet the specific feedback tracking needs of your finance and accounting team. Track relevant KPIs and metrics, and customize the dashboard to reflect your unique customer service goals.
What’s Inside the Finance and Accounting Customer Feedback KPI Dashboard in Excel?
Customer Feedback Tracking: Track feedback from surveys, support tickets, and customer interactions.
Customer Satisfaction Metrics: Monitor NPS, satisfaction ratings, and sentiment.
Response Time & Resolution Tracking: Track how quickly customer feedback is addressed and resolved.
Time-Based Performance Analysis: Analyze feedback trends over time and identify improvements.
Customizable KPIs: Tailor the dashboard to your business’s customer service needs.
Data Visualizations: Use charts and graphs to visualize performance and identify improvement opportunities.
How to Use the Finance and Accounting Customer Feedback KPI Dashboard in Excel
1️⃣ Download the Template: Access the Finance and Accounting Customer Feedback KPI Dashboard in Excel instantly.
2️⃣ Input Customer Feedback Data: Record feedback data, including satisfaction ratings, NPS, and sentiment.
3️⃣ Track KPIs & Performance: Monitor response times, feedback volume, and customer satisfaction.
4️⃣ Analyze Trends & Insights: Use time-based analysis to track feedback performance and identify trends.
5️⃣ Optimize Customer Service: Use the insights to improve service quality, enhance customer satisfaction, and resolve issues promptly.
Who Can Benefit from the Finance and Accounting Customer Feedback KPI Dashboard in Excel?
🔹 Finance and Accounting Teams
🔹 Customer Service & Support Teams
🔹 Business Owners & Managers
🔹 Financial Institutions & Accounting Firms
🔹 Data Analysts & Business Intelligence Teams
🔹 E-commerce & Online Service Providers
Optimize your customer feedback process and improve service quality with the Finance and Accounting Customer Feedback KPI Dashboard in Excel. Track key KPIs, monitor customer satisfaction, and make informed decisions to enhance your service offerings.
Click here to read the Detailed blog post
Visit our YouTube channel to learn step-by-step video tutorials
Youtube.com/@PKAnExcelExpert
Watch the step-by-step video Demo:
Compatibility and Requirements
- Works in Microsoft Excel desktop (Excel 2016 or later, or Microsoft 365).
- Feedback trends are shown with dynamic charts and graphs. Microsoft’s chart basics are in Create a chart from start to finish.
Frequently Asked Questions
Which customer feedback KPIs does this dashboard track?
It tracks feedback from surveys, support tickets and direct contact, satisfaction metrics such as NPS and ratings, sentiment, and how quickly feedback is answered and resolved.
Can I group feedback by type?
Yes. You can categorize responses and add your own feedback categories to find common issues.
Can I see trends by day, week or month?
Yes. Time-based analysis shows satisfaction, feedback volume and response times daily, weekly or monthly.
Can I change the KPIs?
Yes. You can track the KPIs and service metrics that matter most to your team.
Related Customer Feedback Templates
- Customer Feedback KPI Dashboard in Excel: general customer feedback KPIs
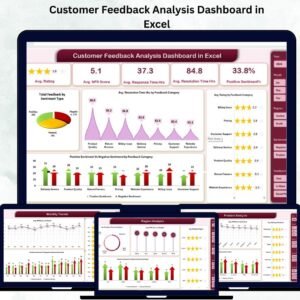
- Customer Feedback Analysis Dashboard in Excel: deeper feedback analysis in Excel
- Customer Feedback Tracker in Excel: log every piece of feedback
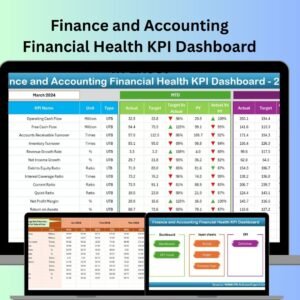
- Finance and Accounting Financial Health KPI Dashboard in Excel: overall financial health KPIs
- Finance & Accounting Command Center: 8 finance templates in Excel, Power BI and Google Sheets
Browse all Excel KPI dashboards or the Excel financial templates.
































Reviews
There are no reviews yet.