



The Regional Sales Analysis Dashboard in Power BI is a powerful tool designed for sales managers, regional managers, and business analysts to track and analyze regional sales performance in real-time. This interactive Power BI dashboard provides deep insights into sales data, allowing you to make informed decisions to optimize sales strategies, improve revenue, and identify areas for growth across different regions.
With customizable filters, real-time data visualizations, and interactive reporting features, this dashboard enables you to track key performance indicators (KPIs) for sales across various regions, analyze trends, and improve overall sales effectiveness.

Key Features of the Regional Sales Analysis Dashboard in Power BI:
🌍 Regional Sales Performance Tracking
Monitor sales performance by region, track revenue, and measure growth across multiple geographic areas to identify which regions are excelling and which need improvement.
📊 KPI Visualizations
Track essential KPIs such as sales growth, market share, customer acquisition, and sales target achievements, all with interactive and visually appealing graphs and charts.
📈 Trend Analysis
Analyze sales trends over time, identify seasonal fluctuations, and forecast future sales to improve sales planning and decision-making.
💼 Product Category Analysis
Drill down into product performance across regions, identifying top-selling products and categories that contribute the most to overall revenue.
💰 Revenue and Profitability Monitoring
Track revenue, profit margins, and sales forecasts to ensure that sales targets are met and the company maintains financial sustainability.
🚀 Why You’ll Love the Regional Sales Analysis Dashboard in Power BI:
✅ Track Sales by Region – Easily monitor regional sales performance and identify high-performing regions to focus efforts on areas needing improvement.
✅ Interactive Data Visualizations – Use dynamic and visually appealing charts, graphs, and maps to analyze sales performance in real time.
✅ Make Data-Driven Decisions – Track KPIs such as revenue, sales growth, and market share to make informed decisions that optimize sales strategies.
✅ Improve Sales Strategy – Use trend analysis and performance tracking to adjust sales strategies based on regional performance.
✅ Customizable Filters – Tailor the dashboard to your needs by filtering data by region, time period, product category, or salesperson.
✅ Forecast Future Sales – Analyze past sales trends to predict future sales performance and optimize future sales plans.
What’s Inside the Regional Sales Analysis Dashboard in Power BI:
Regional Sales Data: Track sales performance across multiple regions and compare the performance of each region to identify areas of growth and underperformance.
KPI Tracking: Visualize KPIs such as sales growth, market share, and sales targets to assess performance and align strategies.
Sales Trends: Analyze sales trends over time to identify peak seasons, understand fluctuations, and predict future sales performance.
Product Category Performance: Break down product sales by category and track which products are driving revenue in different regions.
Revenue and Profit Tracking: Monitor revenue and profit margins to ensure financial health and align with business goals.
Customizable Reports: Generate reports tailored to your sales needs, from regional breakdowns to sales trends and profitability analysis.
How to Use the Regional Sales Analysis Dashboard in Power BI:
1️⃣ Download the Power BI Template – Instantly access your Power BI file upon purchase.
2️⃣ Input Sales Data – Add regional sales data, revenue, and product information to start analyzing your sales performance.
3️⃣ Track Regional Performance – Monitor sales performance by region and compare how different regions are performing against targets.
4️⃣ Analyze Trends and Forecasting – Use trend analysis and sales forecasts to predict future performance and improve planning.
5️⃣ Monitor KPIs – Track key performance indicators such as revenue growth, market share, and product sales to ensure targets are met.
6️⃣ Generate Custom Reports – Create detailed reports on sales, profitability, and product performance for analysis and decision-making.
Who Can Benefit from the Regional Sales Analysis Dashboard in Power BI:
Sales Managers and Directors
Regional Managers
Business Analysts
Marketing Managers
Sales Performance Analysts
Product Managers
Financial Analysts
Senior Management and Executives
Retailers and E-commerce Managers
Consultants in Sales Strategy
The Regional Sales Analysis Dashboard in Power BI is an indispensable tool for any organization looking to optimize sales performance, track revenue growth, and make data-driven decisions. With comprehensive visualizations, customizable filters, and in-depth performance analysis, this dashboard enables your team to make informed decisions that drive sales growth and profitability.
Click here to read the Detailed blog post
https://www.pk-anexcelexpert.com/regional-sales-analysis-dashboard-in-power-bi/
Visit our YouTube channel to learn step-by-step video tutorials
Youtube.com/@PKAnExcelExpert
Compatibility and Requirements
- Built for Power BI Desktop, which is free. You can download it from Microsoft: Get Power BI Desktop.
- Open the file in Power BI Desktop to explore the report with your own data.
Frequently Asked Questions
What does the Regional Sales Analysis Dashboard track?
It tracks sales by region, revenue, profit margins and KPIs such as sales growth, market share, customer acquisition and sales target achievement.
Can I filter the report?
Yes. You can filter the data by region, time period, product category or salesperson.
Does it show product performance by region?
Yes. You can drill down into product categories across regions to see which products bring in the most revenue.
What data do I need to add?
You add your regional sales data, revenue and product information. The visuals then show performance by region against your targets.
Is there an Excel version for territories?
Yes. The Territory Management KPI Dashboard in Excel tracks sales territories in Excel.
Related Sales Dashboards
- Sales Dashboard in Power BI: a general sales dashboard in Power BI
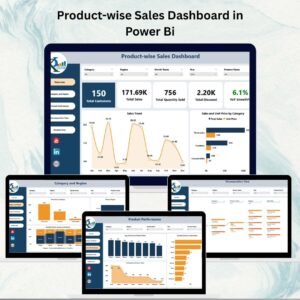
- Product-wise Sales Dashboard in Power Bi: see sales by product
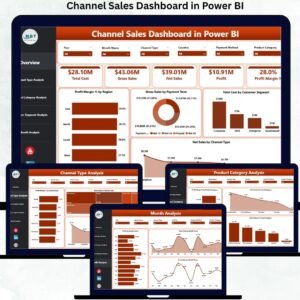
- Channel Sales Dashboard in Power BI: compare sales across channels
- Territory Management KPI Dashboard in Power BI: track sales territories in Power BI
- Power BI Dashboard Mega Collection: 15 Power BI dashboards in one download
Browse all Power BI dashboards or the Power BI KPI dashboards.







Reviews
There are no reviews yet.