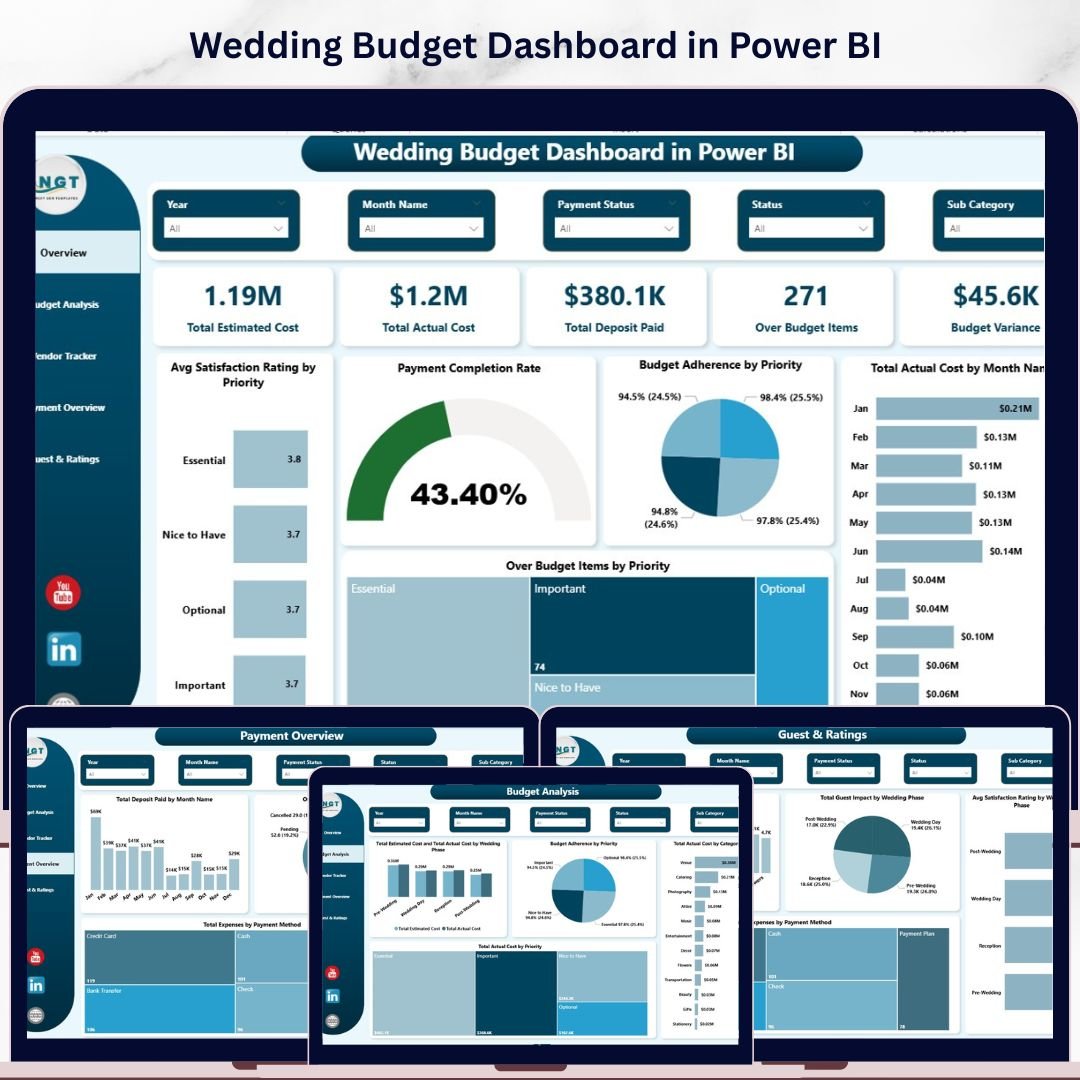


Wedding Budget Dashboard in Power BI is a professionally designed, interactive Power BI dashboard template built for couples, wedding planners, and event coordinators who want complete control over their wedding finances using Microsoft Power BI. This Power BI Dashboard Template includes 5 interactive analysis pages — Overview, Budget Analysis, Vendor Tracker, Payment Overview, and Guest & Ratings — featuring 5 high-level KPI cards, multiple dynamic charts, and built-in slicers for instant filtering. It tracks key metrics including Total Estimated Cost, Total Actual Cost, Total Deposit Paid, Over Budget Items, and Budget Variance across dimensions like category, priority, vendor, payment method, and wedding phase.
Planning a wedding involves managing dozens of financial variables — venue costs, catering, photography, decorations, entertainment, and more. Without a centralized reporting tool, couples and planners often lose track of which categories are over budget, which vendors still have outstanding payments, and how guest counts affect overall expenses. The Wedding Budget Dashboard in Power BI solves this by consolidating all wedding financial data into one stunning, interactive analytics experience powered by DAX calculations and dynamic visuals. If you prefer working in Excel, check out the Wedding Budget Dashboard in Excel, or for a browser-based option, explore the Wedding Budget Dashboard in HTML.
🔑 Key Features of Wedding Budget Dashboard in Power BI
📌 5 Interactive Dashboard Pages — Overview, Budget Analysis, Vendor Tracker, Payment Overview, and Guest & Ratings deliver a 360-degree view of your wedding finances from every angle.
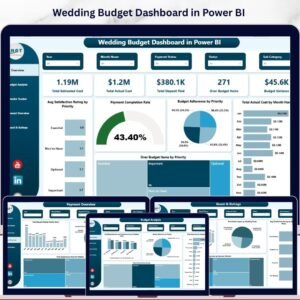
📌 5 High-Level KPI Cards — Instantly track Total Estimated Cost, Total Actual Cost, Total Deposit Paid, Over Budget Items, and Budget Variance on the Overview page.
📌 Multiple Dynamic Charts & Visuals — Analyze spending patterns with charts covering Avg Satisfaction Rating by Priority, Payment Completion Rate, Budget Adherence by Priority, Total Actual Cost by Month, and Over Budget Items by Priority.
📌 Built-in Slicers for Quick Filtering — Apply filters instantly to slice data by category, priority, vendor, payment method, or wedding phase without any manual sorting.
📌 Budget Analysis Page — Deep dive into Total Estimated Cost and Total Actual Cost by Wedding Phase, Budget Adherence by Priority, Total Actual Cost by Category, and Total Actual Cost by Priority for complete budget visibility.
📌 Vendor Payment Tracking — Monitor Total Actual Cost and Total Deposit Paid by Payment Method, Over Budget Items by Priority, Total Deposit Paid and Total Actual Cost by Payment Status, and Total Actual Cost by Payment Method.
📌 Payment Overview Analysis — Track Total Deposit Paid by Month, Over Budget Items by Status, Budget Adherence by Payment Method, and Total Expenses by Payment Method for complete payment clarity.
📌 Guest & Ratings Insights — Understand Total Guest Impact by Category, Total Guest Impact by Wedding Phase, Avg Satisfaction Rating by Wedding Phase, and Total Expenses by Payment Method.
📌 Power BI Desktop Compatible — Works with the free Power BI Desktop application from Microsoft. Simply open the .pbix file and start analyzing.
📌 Professional Design — Clean layout with consistent color themes, organized tab navigation, and responsive visuals ready for presentations and stakeholder sharing.
📦 What’s Inside the Wedding Budget Dashboard in Power BI
This template includes 5 interactive dashboard pages designed to give you complete wedding budget management experience:
📊 1 — Overview Page: The Overview page is your command center, displaying 5 KPI cards for Total Estimated Cost, Total Actual Cost, Total Deposit Paid, Over Budget Items, and Budget Variance. Below the cards, you will find charts showing Avg Satisfaction Rating by Priority, Payment Completion Rate, Budget Adherence by Priority, Total Actual Cost by Month Name, and Over Budget Items by Priority. Multiple slicer filters let you apply filters and see the filtered dashboard quickly across all dimensions.
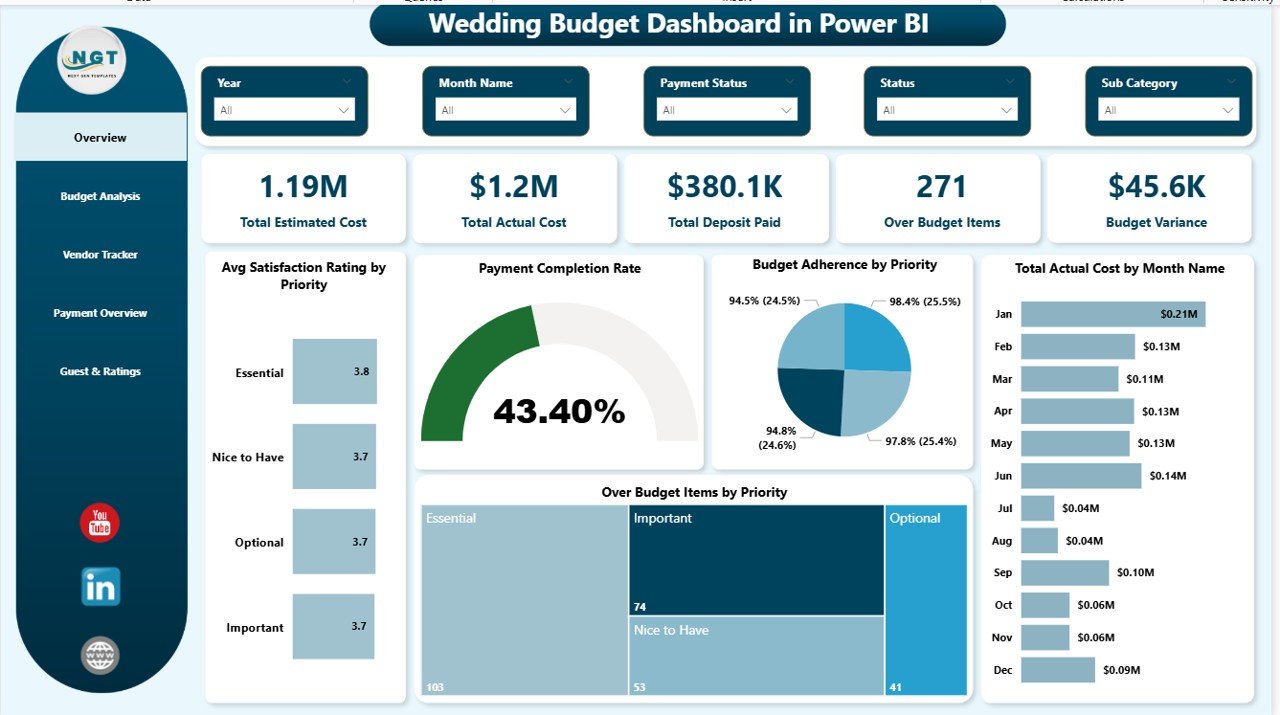 Wedding Budget Dashboard in Power BI
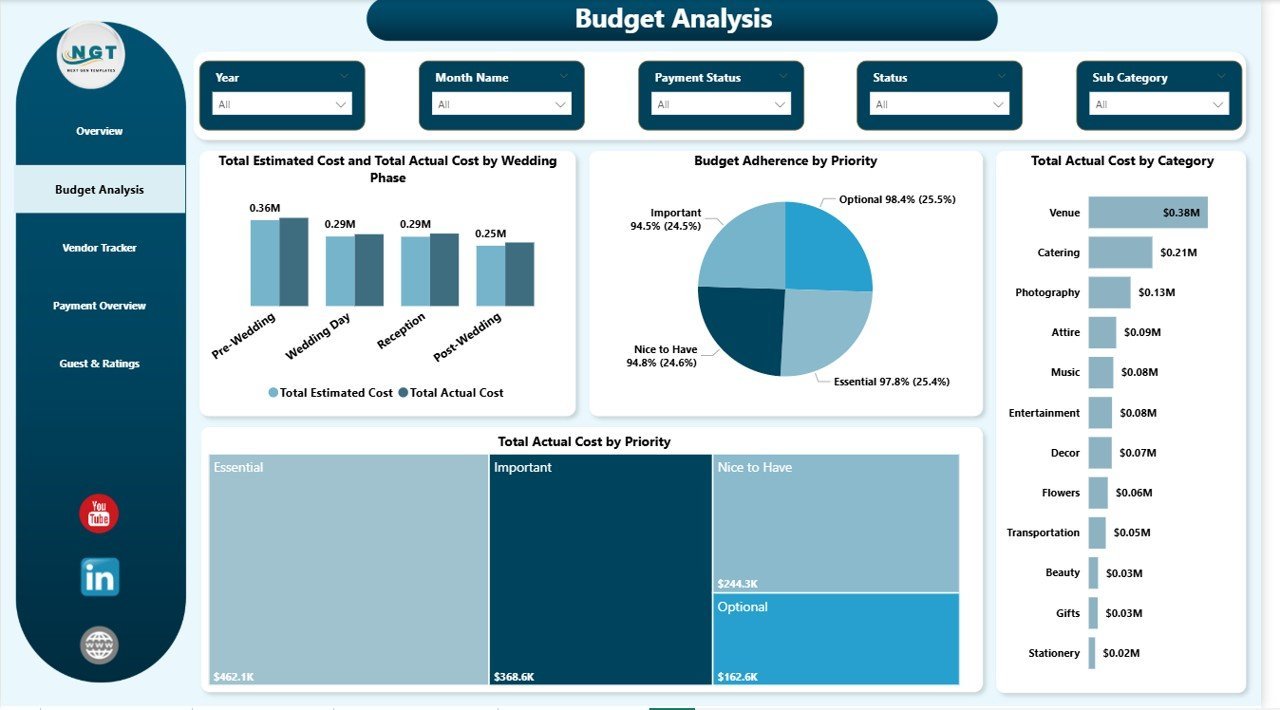
📊 2 — Budget Analysis: This page focuses on deep budget comparison with charts for Total Estimated Cost and Total Actual Cost by Wedding Phase, Budget Adherence by Priority, Total Actual Cost by Category, and Total Actual Cost by Priority. The estimated vs actual comparison by wedding phase helps you quickly spot phases where spending exceeds the plan, while the category-level breakdown reveals your highest cost areas.
 Budget Analysis
📊 3 — Vendor Tracker: Analyze vendor-related finances with charts for Total Actual Cost and Total Deposit Paid by Payment Method, Over Budget Items by Priority, Total Deposit Paid and Total Actual Cost by Payment Status, and Total Actual Cost by Payment Method. This page is essential for evaluating which payment methods are most used and monitoring the gap between deposits paid and actual costs across different payment statuses.
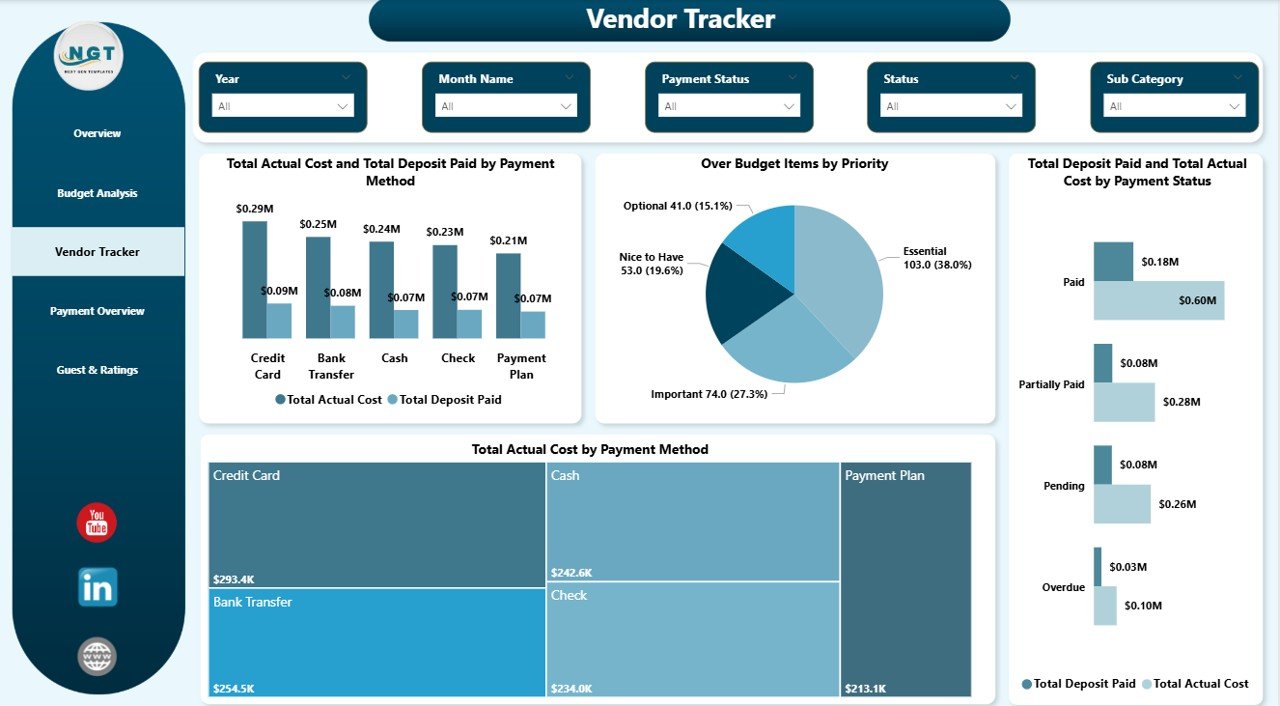 Vendor Tracker
📊 4 — Payment Overview: Track payment timelines and breakdowns with charts for Total Deposit Paid by Month Name, Over Budget Items by Status, Budget Adherence by Payment Method, and Total Expenses by Payment Method. This page gives you full financial clarity — helping you understand monthly deposit patterns, identify which items remain over budget by their status, and evaluate budget adherence across different payment channels.
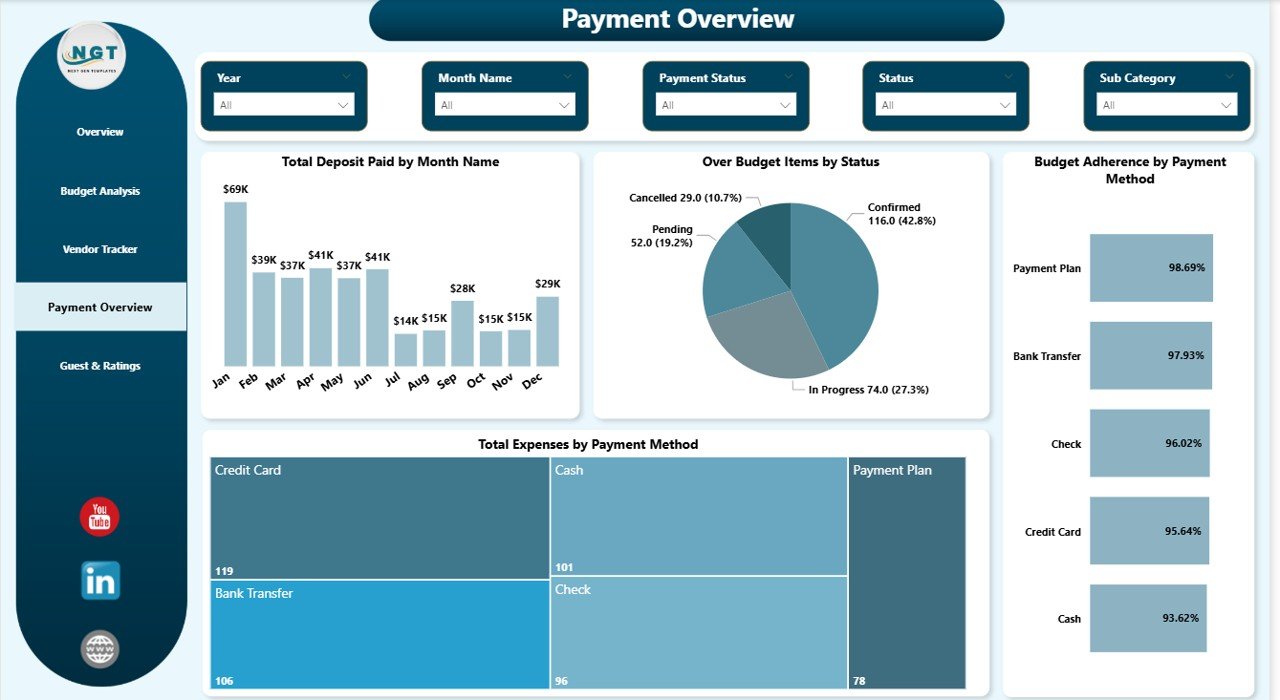 Payment Overview
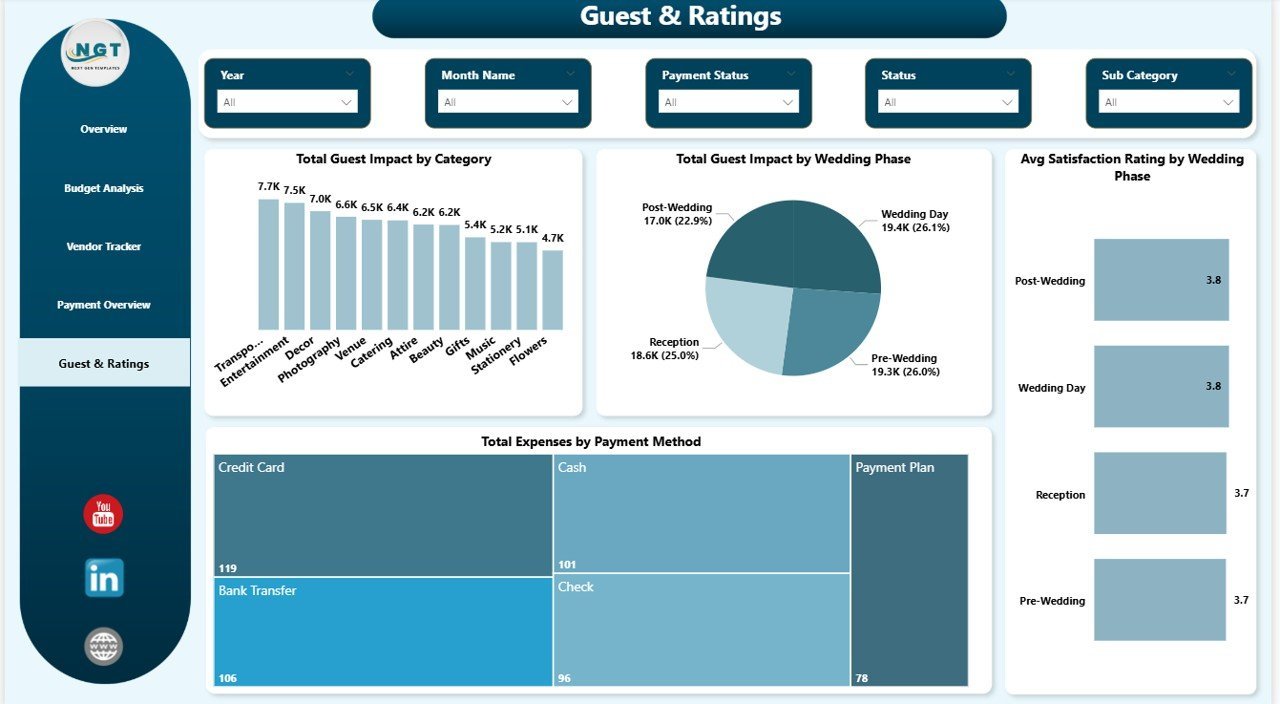
📊 5 — Guest & Ratings: Understand guest impact and satisfaction with charts for Total Guest Impact by Category, Total Guest Impact by Wedding Phase, Avg Satisfaction Rating by Wedding Phase, and Total Expenses by Payment Method. This page helps you correlate guest counts with spending patterns and evaluate how satisfaction levels differ across the various phases of your wedding planning.
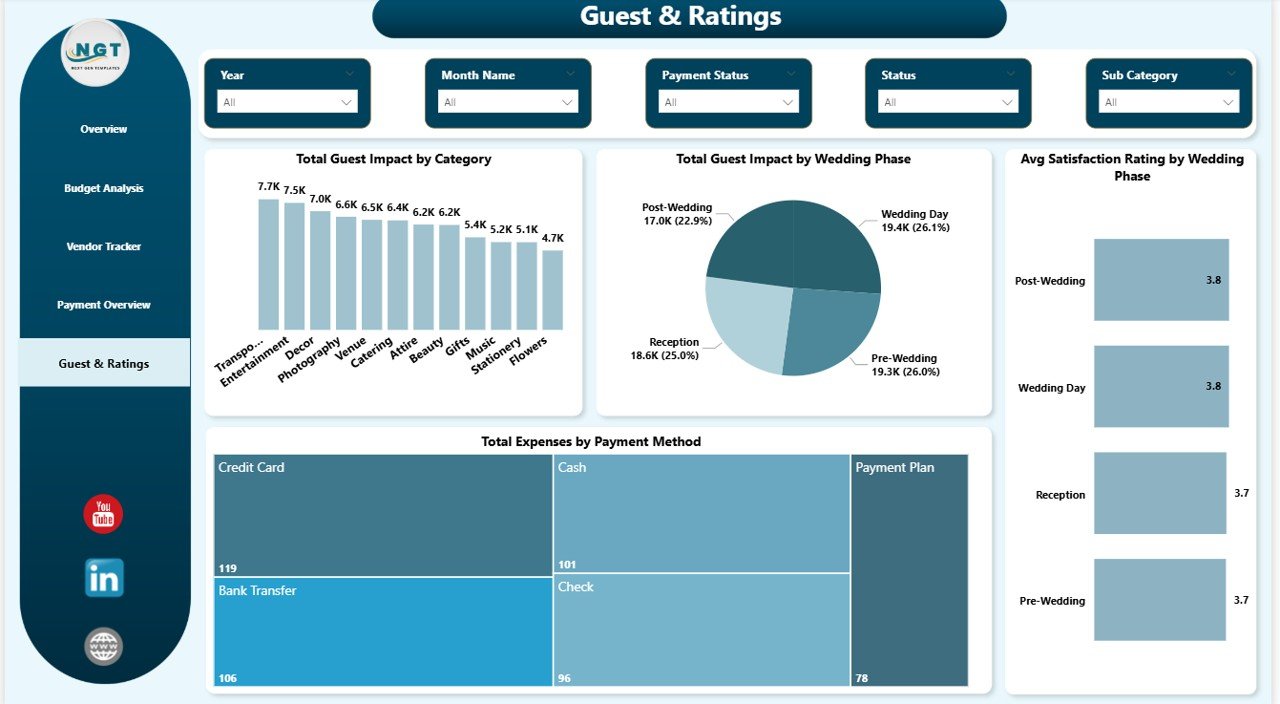 Guest & Ratings
⚙️ How to Use the Wedding Budget Dashboard in Power BI
1️⃣ Download and Unzip — Download the ZIP file and extract the .pbix file to a folder on your computer.
2️⃣ Open in Power BI Desktop — Double-click the .pbix file to open it in Power BI Desktop (free download from Microsoft).
3️⃣ Review the Sample Data — Explore the 5 dashboard pages to understand the structure, KPIs, and chart layouts.
4️⃣ Replace with Your Data — Connect your own wedding budget data source or edit the existing data tables with your actual wedding expenses, vendors, and payment details.
5️⃣ Refresh and Analyze — Click Refresh in Power BI to update all visuals. Use the built-in slicers to filter by category, priority, vendor, or wedding phase for targeted analysis.
6️⃣ Present and Share — Export pages as PDF or publish to Power BI Service for sharing with your wedding planner or family members.
👥 Who Can Benefit from This Wedding Budget Dashboard in Power BI
💍 Couples Planning Their Wedding — Get a visual, interactive way to track every expense and stay on budget throughout the wedding planning journey.
💍 Professional Wedding Planners — Manage multiple client budgets with a professional analytics tool that impresses clients with data-driven insights.
💍 Event Coordinators — Track vendor payments, deposits, satisfaction ratings, and budget adherence across all wedding event categories.
💍 Families and Financial Advisors — Help organize and fund wedding celebrations with clear visibility into estimated vs actual spending.
💍 Wedding Venues and Vendors — Offer budget tracking tools to clients as a value-added service.
Browse our complete collection of Power BI Dashboard Templates for more options across every industry and business need.
❓ Frequently Asked Questions
What KPIs does the Wedding Budget Dashboard in Power BI track?
The Wedding Budget Dashboard in Power BI tracks 5 key performance indicators on the Overview page: Total Estimated Cost, Total Actual Cost, Total Deposit Paid, Over Budget Items, and Budget Variance. Additional analysis across 5 pages covers budget adherence by priority, cost breakdowns by category and wedding phase, vendor payment tracking, deposit analysis, and guest impact metrics.
Do I need Power BI Pro to use this wedding budget dashboard?
No. This template works with the free Power BI Desktop application available from Microsoft. You only need Power BI Pro if you want to publish and share the dashboard online through Power BI Service. For personal use and local analysis, the free desktop version is sufficient.
Can I customize the categories and vendors in this Power BI template?
Yes. You can modify the data tables directly in Power BI Desktop to add your own categories, vendors, payment methods, and wedding phases. All charts and KPI cards update dynamically when the data is refreshed.
How is this different from the Wedding Budget Dashboard in Excel?
The Power BI version offers more advanced interactive visuals, cross-filtering between charts, DAX-powered calculations, and the ability to publish dashboards online for collaborative viewing. The Excel version uses pivot tables and slicers for a desktop-only experience.
What is the best Power BI dashboard for tracking wedding expenses?
The Wedding Budget Dashboard in Power BI from NextGenTemplates is one of the most comprehensive options available. It includes 5 interactive pages covering budget analysis, vendor tracking, payment overview, and guest impact — all with dynamic slicers and KPI cards for instant insights.
🔗 Explore Related Templates
📌 Wedding Budget Dashboard in Excel — Track the same wedding budget KPIs using Excel pivot tables and slicers for an offline experience.
📌 Wedding Budget Dashboard in HTML — Browser-based wedding budget dashboard with interactive charts and CSV export.
📌 Event Planning KPI Scorecard in Excel — Track event revenue, costs, ROI, and satisfaction with a structured KPI scorecard.
📖 Click here to read the Detailed Blog Post about Wedding Budget Dashboard in Power BI
Watch the step-by-step video tutorial:


Reviews
There are no reviews yet.