



The Video Production KPI Dashboard in Excel is a powerful tool designed for video production teams, content creators, and digital marketing managers. This comprehensive dashboard helps you track, analyze, and optimize the key performance indicators (KPIs) related to video production and content performance.
With this Excel-based template, you can manage various aspects of video production, including production timelines, video views, engagement metrics, and revenue generation. Whether you are managing a small video production team or overseeing large-scale video projects, this dashboard gives you the insights you need to make data-driven decisions, improve video performance, and enhance team productivity.
Key Features of the Video Production KPI Dashboard in Excel
🎥 Track Video Production Metrics
Monitor essential production KPIs such as video completion time, script approval status, filming progress, and post-production stages. Keep your video production process on track and identify any bottlenecks early on.
📅 Content Scheduling & Planning
Easily plan and schedule video releases. Track video upload dates, deadlines, and promotional activities to ensure timely delivery and maintain consistency with your content strategy.
📊 Engagement Metrics Tracking
Track performance metrics such as video views, likes, shares, comments, and click-through rates (CTR). Gain valuable insights into how well your videos are engaging your target audience.
💰 Revenue & ROI Analysis
Evaluate the revenue generated from video content, including ad revenue, sponsorships, and product sales. Use this dashboard to track your return on investment (ROI) and adjust strategies for better profitability.
📈 Visual Data Insights
Visualize your video production and performance data with easy-to-read graphs, charts, and reports. Track trends, identify high-performing content, and make data-driven adjustments to your video strategy.
🔄 Customizable for Your Needs
Tailor the dashboard to suit your unique video production process. Modify KPIs, data fields, and metrics to fit the specific needs of your team, whether you’re focused on YouTube, social media, or other video platforms.
Why You’ll Love the Video Production KPI Dashboard in Excel

✅ Optimize Video Production
Track production milestones and timelines to ensure smooth execution of video projects. Identify and eliminate bottlenecks to streamline your production process.
✅ Measure Engagement & Reach
Monitor how well your videos are performing by tracking engagement metrics and audience interaction. Use this data to optimize future content and maximize reach.
✅ Track ROI & Profitability
Evaluate the revenue generated from your video content and measure the profitability of your projects. Make smarter decisions on video marketing strategies based on ROI insights.
✅ Increase Team Efficiency
With clear tracking and scheduled reminders, the dashboard helps video production teams stay organized and efficient, ensuring that content is produced on time and within budget.
✅ Scalable for Any Video Production Team
Whether you’re a solo content creator or managing a team of producers, this dashboard is fully scalable to fit your video production needs. Customize it to track the metrics that matter most to your business.
What’s Inside the Video Production KPI Dashboard in Excel?
- Production Timeline Tracker: Track progress through pre-production, filming, and post-production stages.
- Content Scheduling: Plan and manage video release dates, deadlines, and promotional activities.
- Engagement & Performance Metrics: Monitor video views, likes, shares, comments, and engagement rates.
- Revenue Tracking: Track income generated from video content, including ad revenue and sales.
- Customizable KPI Tracking: Adjust KPIs and metrics to match your specific video production process and goals.
- Visual Reports & Insights: Use charts and graphs to visualize key performance trends.
How to Use the Video Production KPI Dashboard in Excel
1️⃣ Download the Template: Instantly access the Video Production KPI Dashboard in Excel.
2️⃣ Add Your Video Data: Enter data such as video release dates, production stages, views, and revenue into the template.
3️⃣ Track Key Metrics: Monitor production timelines, performance metrics, and engagement statistics.
4️⃣ Analyze Video Performance: Use visual insights to track engagement trends and identify top-performing videos.
5️⃣ Optimize Strategy: Use the dashboard’s data to improve future video production and marketing strategies.
Who Can Benefit from the Video Production KPI Dashboard in Excel?
🔹 Video Production Teams
🔹 Content Creators & YouTubers
🔹 Social Media Managers
🔹 Digital Marketers & Influencers
🔹 Video Marketing Agencies
🔹 Product Managers & Brand Managers
Improve the efficiency and performance of your video production process with the Video Production KPI Dashboard in Excel. Track production, performance, and profitability to optimize content creation and maximize ROI.
Click here to read the Detailed blog post
Visit our YouTube channel to learn step-by-step video tutorials
Youtube.com/@PKAnExcelExpert
Compatibility and Requirements
- Works in Microsoft Excel desktop (Excel 2016 or later, or Microsoft 365).
- Results are shown in charts. Microsoft explains Excel charts in Create a chart from start to finish.
Frequently Asked Questions
What does the Video Production KPI Dashboard track?
It tracks production progress (script approval, filming and post-production), release schedules, views, likes, shares, comments, click-through rate (CTR) and revenue from ads, sponsorships and product sales.
Can I plan video releases?
Yes. You can schedule releases and track upload dates, deadlines and promotional activities.
Can I measure return on investment?
Yes. You can compare revenue from video content with your costs to track ROI.
Is there a Power BI or Google Sheets version?
Yes. The Video Production KPI Dashboard in Google Sheets and the Power BI edition cover the same topic.
Related Video and Content Templates
- Video Production KPI Dashboard in Google Sheets: the same topic in Google Sheets
- Video Production KPI Dashboard in Power BI: the same topic in Power BI
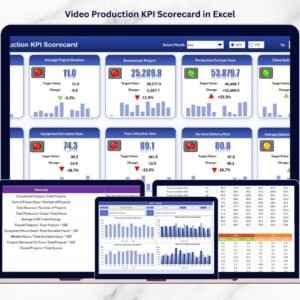
- Video Production KPI Scorecard in Excel: a video production KPI scorecard in Excel
- Social Media Performance Dashboard in Excel: track social media performance in Excel
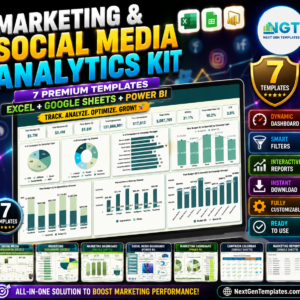
- Marketing and Social Media Analytics Kit: 7 marketing and social media templates in one download
Browse all Excel KPI dashboards or the Excel sales and marketing templates.
































Reviews
There are no reviews yet.