



The Used Car Sales KPI Dashboard in Excel is an essential tool for car dealerships, sales managers, and business analysts in the automotive industry to track key performance indicators (KPIs) related to used car sales. This Excel-based dashboard enables you to monitor sales performance, inventory levels, customer satisfaction, and profitability, helping you make data-driven decisions to optimize sales and improve overall business performance.
With customizable features and real-time tracking, this dashboard helps you manage inventory, analyze sales trends, and monitor financial metrics to ensure that your used car sales operations run smoothly and efficiently.

Key Features of the Used Car Sales KPI Dashboard in Excel:
🚗 Sales Performance Tracking
Monitor the number of cars sold, sales by model, revenue, and sales trends to optimize pricing, promotions, and sales strategies.
📦 Inventory Management
Track stock levels, model availability, and vehicle turnover rates to ensure that you maintain optimal inventory levels and avoid overstocking or stockouts.
💰 Profitability Analysis
Analyze sales revenue, costs, and profit margins for each vehicle sold to evaluate the profitability of your used car inventory.
📊 Customer Satisfaction Tracking
Monitor customer reviews, feedback, and satisfaction scores to ensure high levels of customer satisfaction and identify areas for improvement.
⚙️ Operational Efficiency
Track operational KPIs such as the time a vehicle spends in inventory, sales cycle duration, and employee performance to streamline your used car sales process.
🚀 Why You’ll Love the Used Car Sales KPI Dashboard in Excel:
✅ Optimize Sales Performance – Track sales by model, region, and salesperson to identify top-performing vehicles and optimize sales strategies.
✅ Manage Inventory Efficiently – Monitor stock levels and vehicle turnover rates to ensure your inventory is well-balanced and meets customer demand.
✅ Track Profitability – Analyze costs, sales revenue, and profit margins for each vehicle to ensure that your used car sales business remains profitable.
✅ Enhance Customer Satisfaction – Monitor customer feedback and satisfaction to continuously improve your sales process and customer experience.
✅ Improve Operational Efficiency – Track key operational metrics to identify areas where your sales process can be streamlined and improved.
✅ Fully Customizable and Interactive – Customize the dashboard to suit your business needs, with interactive features and real-time tracking for better insights.
What’s Inside the Used Car Sales KPI Dashboard in Excel:
Sales Tracking: Track total sales, revenue by model, and sales performance by region and salesperson to identify trends and opportunities for improvement.
Inventory Management: Monitor the stock levels of used cars, vehicle turnover rates, and ensure that inventory is properly managed to meet customer demand.
Profitability Analysis: Track vehicle costs, sales prices, and profit margins to determine the profitability of each sale and ensure financial health.
Customer Satisfaction: Track customer reviews, ratings, and satisfaction scores to maintain a high level of customer service and improve retention rates.
Operational Efficiency: Monitor how long vehicles stay in inventory, the sales cycle, and the performance of sales staff to optimize operations.
Custom Reports: Generate custom reports summarizing key metrics such as sales, inventory, customer satisfaction, and profitability to inform business decisions.
How to Use the Used Car Sales KPI Dashboard in Excel:
1️⃣ Download the Template – Instantly access your Excel file upon purchase.
2️⃣ Input Sales and Inventory Data – Enter your vehicle sales data, inventory levels, and customer feedback to start tracking key KPIs.
3️⃣ Monitor Key Metrics – Use the dashboard to track sales, inventory levels, customer satisfaction, and profitability in real-time.
4️⃣ Analyze Profitability – Track costs, revenue, and profit margins for each car to ensure optimal profitability across your inventory.
5️⃣ Generate Reports – Create custom reports summarizing key metrics for strategic decision-making and improved sales performance.
Who Can Benefit from the Used Car Sales KPI Dashboard in Excel:
Used Car Dealerships
Sales Managers
Inventory Managers
Financial Analysts in Automotive Sales
Marketing and Customer Service Teams
Automotive Business Owners
Used Car Sales Teams
Business Analysts
The Used Car Sales KPI Dashboard in Excel is the ideal tool for managing and optimizing your used car sales business. With its ability to track key sales, inventory, and operational metrics, this dashboard helps ensure that your business remains efficient, profitable, and focused on customer satisfaction.
Click here to read the Detailed blog post
https://www.pk-anexcelexpert.com/used-car-sales-kpi-dashboard-in-excel/
Visit our YouTube channel to learn step-by-step video tutorials
Youtube.com/@PKAnExcelExpert
Compatibility and Requirements
- Works in Microsoft Excel desktop (Excel 2016 or later, or Microsoft 365).
- The KPIs are shown in interactive charts. Microsoft explains Excel charts in Create a chart from start to finish.
Frequently Asked Questions
What does the Used Car Sales KPI Dashboard track?
It tracks cars sold, sales by model, region and salesperson, inventory levels and vehicle turnover, profit margins per vehicle, customer satisfaction, and operational KPIs such as days in inventory and sales cycle length.
How do I add my own data?
Enter your vehicle sales data, inventory levels and customer feedback. Then use the dashboard to monitor the KPIs.
Can I create reports from it?
Yes. It includes custom reports that summarize sales, inventory, customer satisfaction and profitability.
Can I change it to fit my business?
Yes. The template is fully customizable, so you can adjust it to the KPIs and data you use.
Is there a Google Sheets or Power BI version?
Yes. The Used Car Sales KPI Dashboard in Google Sheets and the Used Car Sales KPI Dashboard in Power BI cover the same KPIs on those platforms.
Related Car Dealership Templates
- Used Car Sales KPI Dashboard in Google Sheets: the same dashboard in Google Sheets
- Used Car Sales KPI Dashboard in Power BI: the same KPIs in Power BI
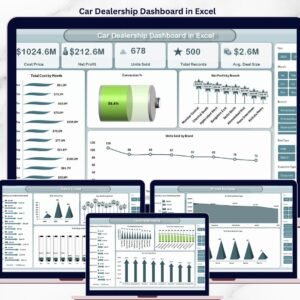
- Car Dealership Dashboard in Excel: a full dashboard for a car dealership
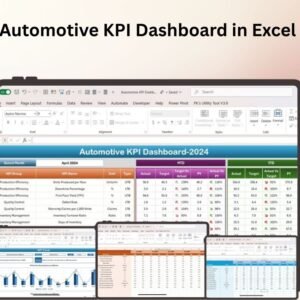
- Automotive KPI Dashboard in Excel: KPIs for the wider automotive business
- KPI Dashboard Library (Excel): 15 Excel KPI dashboards in one download
Browse all Excel KPI dashboards or the Excel dashboards.






























Reviews
There are no reviews yet.