



Running a used car dealership without clear performance tracking often results in missed sales opportunities, slow decisions, and shrinking margins. Sales volume, revenue, profit per vehicle, inventory turnover, and conversion rates change every month. However, when these numbers are tracked across multiple spreadsheets or manual reports, understanding the real performance picture becomes difficult.Used Car Sales KPI Dashboard in Google Sheets
That is exactly why the Used Car Sales KPI Dashboard in Google Sheets is a powerful and essential solution for used car dealers and sales managers.Used Car Sales KPI Dashboard in Google Sheets
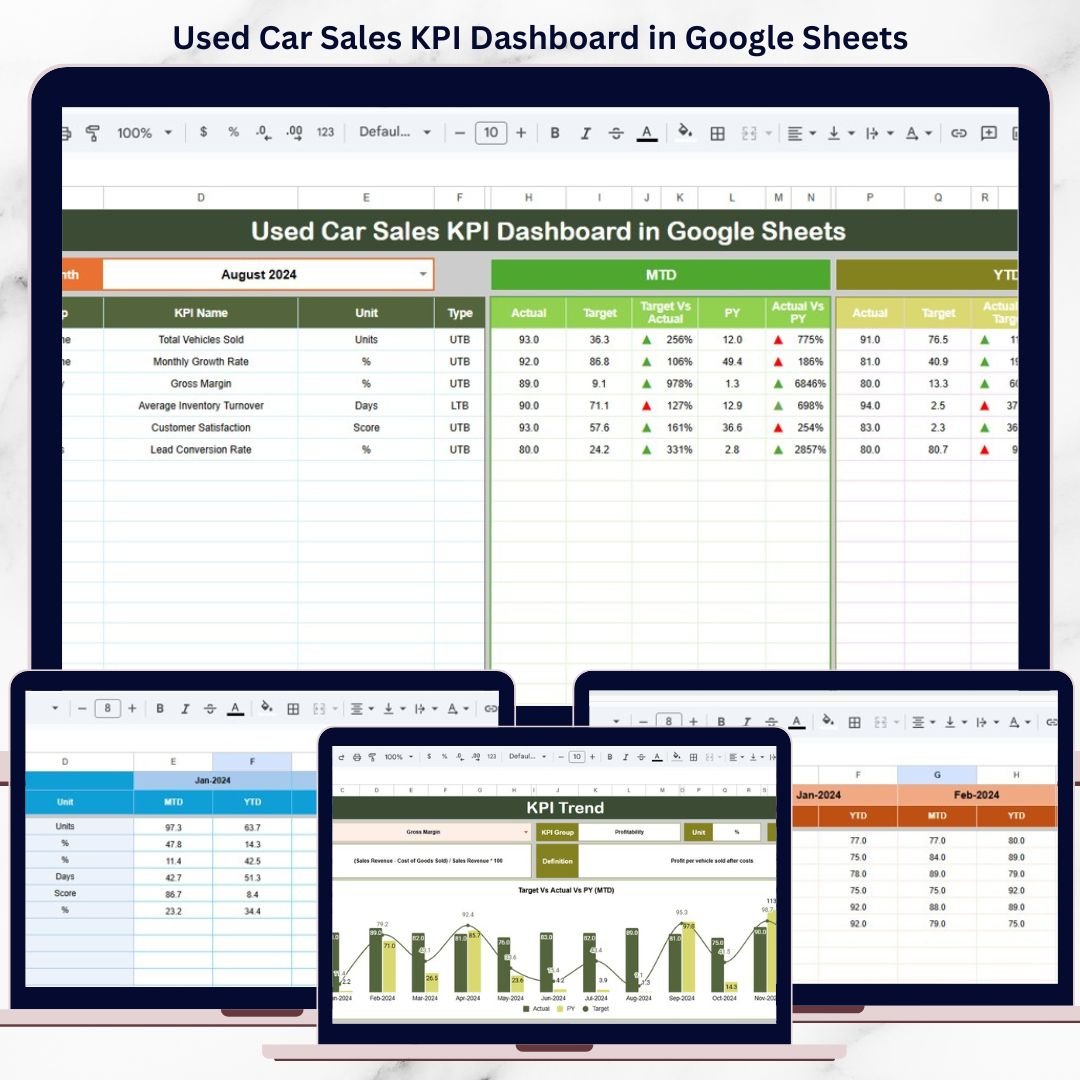
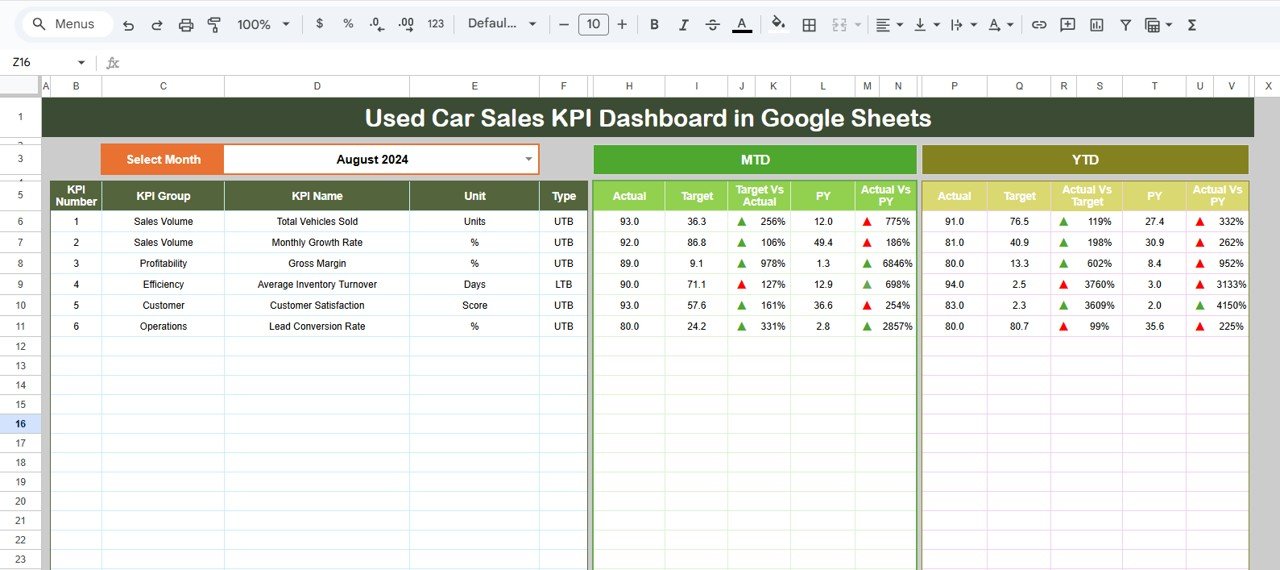
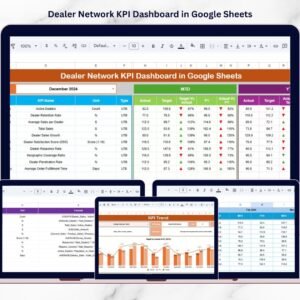
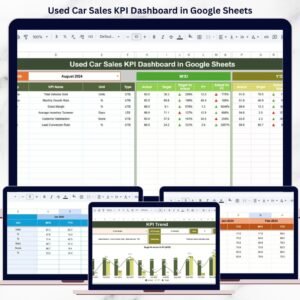
This ready-to-use dashboard transforms raw used car sales data into clear KPIs, visual comparisons, and performance trends—all in one structured Google Sheets file. Instead of spending hours preparing reports, you can instantly track MTD (Month-to-Date) and YTD (Year-to-Date) performance, compare results with targets and previous year data, and identify performance gaps with visual indicators.
Because the dashboard is built in Google Sheets, it is cloud-based, easy to share, and fully customizable. You do not need expensive BI tools or technical skills to start using it. Simply enter your data and the dashboard does the rest.
⭐ Key Features of Used Car Sales KPI Dashboard
🔹 10 Essential Used Car Sales KPIs
Track the most important metrics covering sales, revenue, inventory, and efficiency.
🔹 Interactive Month Selector
Select any month from a dropdown and instantly refresh the entire dashboard.
🔹 MTD & YTD Performance Analysis
Monitor short-term performance and long-term trends side by side.
🔹 Target vs Actual Comparison
Clearly see whether sales goals are being achieved.
🔹 Previous Year Comparison
Understand growth patterns and seasonality in used car sales.
🔹 Visual Performance Indicators
Up/down arrows and conditional formatting make insights obvious at a glance.
📊 What’s Inside the Used Car Sales KPI Dashboard
📌 Dashboard Sheet – Main KPI View
This is the core dashboard where all KPIs are displayed.
🔽 Month Selector
-
Located in Cell D3
-
Select any month to update all KPIs automatically
📈 KPI Metrics Displayed
For each KPI, the dashboard shows:
MTD Section
-
Actual
-
Target
-
Previous Year
-
Target vs Actual (with arrows)
-
Previous Year vs Actual (with arrows)
YTD Section
-
Actual
-
Target
-
Previous Year
-
Target vs Actual
-
Previous Year vs Actual
This structure makes it extremely easy to spot:
-
✅ KPIs performing well
-
⚠️ KPIs needing attention
📉 KPI Trend Sheet Tab
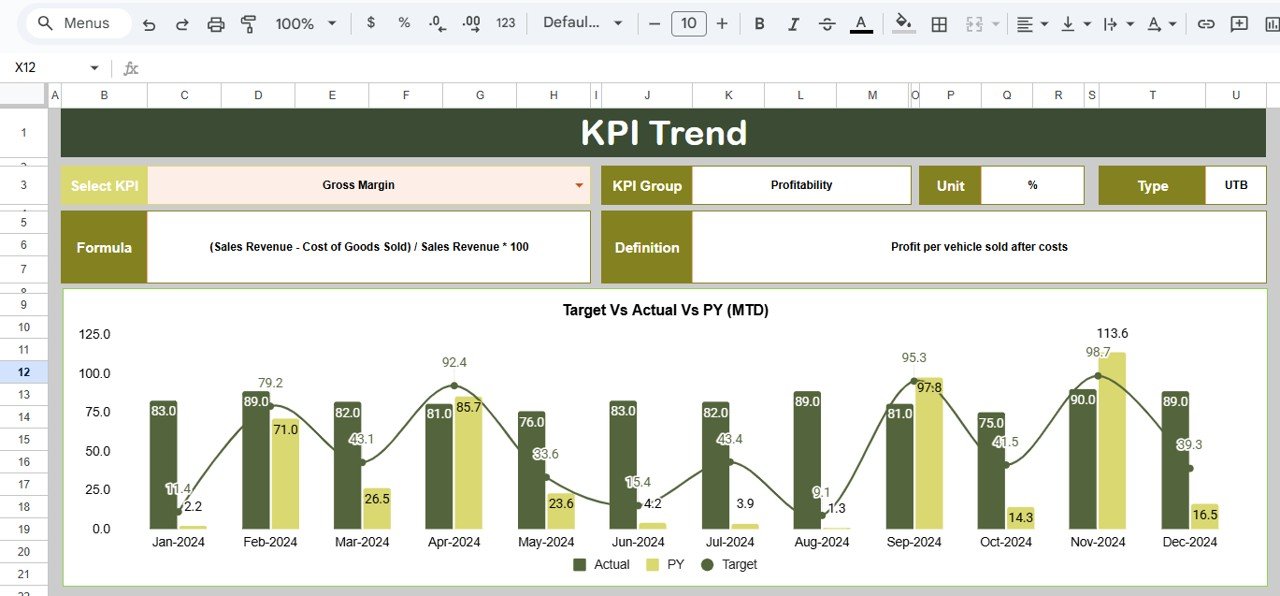
This sheet allows deep-dive analysis for a selected KPI.
🔹 KPI Selector
-
Available in Cell C3
-
Select any KPI to analyze its trend
🔹 Information Displayed
-
KPI Group
-
KPI Unit
-
KPI Type: UTB (Upper the Better) / LTB (Lower the Better)
-
KPI Formula
-
KPI Definition
-
Month-wise performance trend
This sheet is perfect for sales review meetings and management discussions.
🧾 Actual Number Sheet Tab
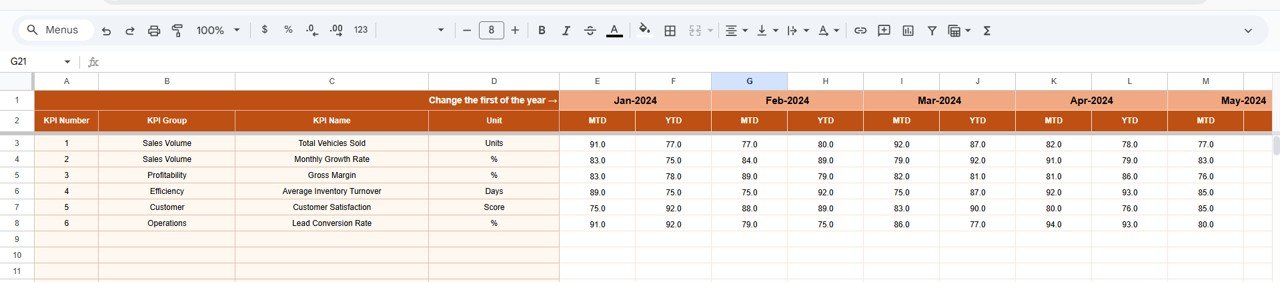
Used to enter current year performance data.
How It Works
-
Enter MTD and YTD actual values
-
Change reporting month using Cell E1
-
Set the first month of the year to align YTD logic
All dashboard values update automatically.
🎯 Target Sheet Tab
Used to define planned sales goals.
-
Enter MTD Target values
-
Enter YTD Target values
Targets drive all comparison and variance calculations.
📆 Previous Year Number Sheet Tab
Stores last year’s performance data.
-
Same structure as Actual and Target sheets
-
Enables accurate Year-over-Year comparison
-
Helps identify seasonal demand patterns
📘 KPI Definition Sheet Tab
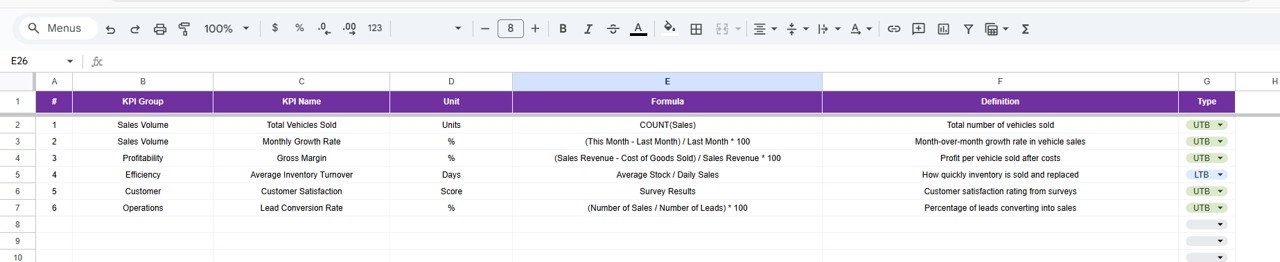
This is the foundation of the dashboard.
Columns Included
-
KPI Name
-
KPI Group (Sales, Revenue, Inventory, Efficiency, etc.)
-
Unit (USD, %, Count, Days)
-
Formula (short and clear)
-
KPI Definition
-
KPI Type (UTB / LTB)
This ensures clarity, consistency, and audit-readiness.
🧭 How to Use the Used Car Sales KPI Dashboard
1️⃣ Enter monthly Actual data
2️⃣ Define Targets for sales and revenue
3️⃣ Select the reporting month
4️⃣ Review MTD & YTD performance
5️⃣ Analyze trends using the KPI Trend sheet
👥 Who Can Benefit from This Dashboard
-
🚗 Used Car Dealership Owners
-
📊 Sales Managers
-
📈 Automotive Analysts
-
💼 Finance & Operations Teams
-
🏢 Small & Mid-Size Auto Dealers
🚀 Advantages of Using This Dashboard
-
Centralized KPI tracking
-
Faster, data-driven decisions
-
Reduced manual reporting effort
-
Clear sales and inventory visibility
-
Easy monthly & yearly comparison
-
Fully customizable Google Sheets solution
### Click here to read the Detailed blog post
Watch the step-by-step video tutorial:
Reviews
There are no reviews yet.