
Thrift stores are not “simple retail.” You’re balancing affordability, customer satisfaction, donations-based inventory, changing item conditions, discount strategies, and multi-location performance—all at once. And when performance tracking is handled through manual spreadsheets or disconnected reports, the result is predictable: decision-making becomes slow, trends stay hidden, and revenue opportunities slip away quietly.
That’s why we created the Thrift Stores Dashboard in Power BI 🛍️♻️📊
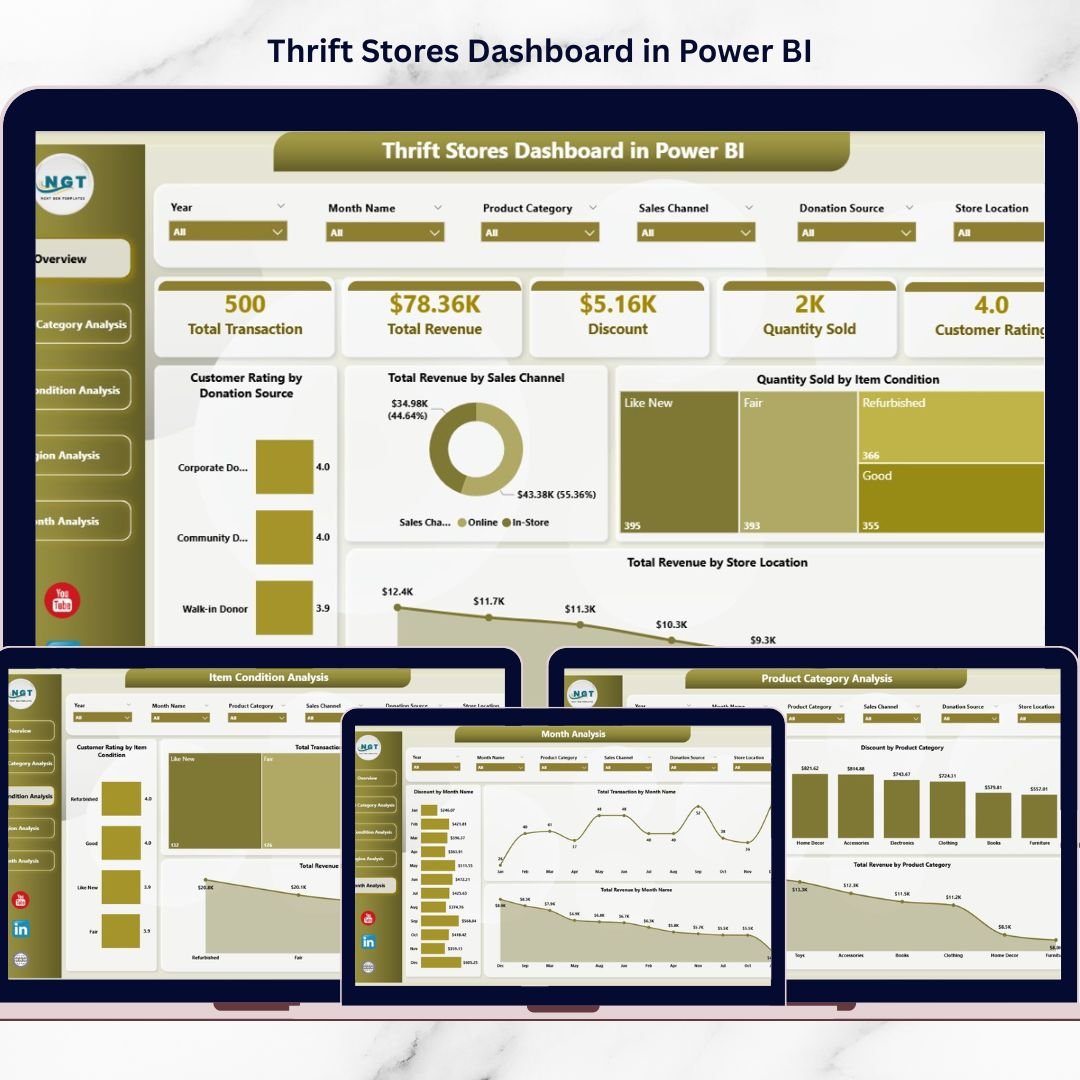
It’s a ready-to-use analytics system that transforms raw thrift store data into interactive insights—so you can monitor revenue, customer ratings, product categories, item conditions, region-wise results, and month-wise trends from one centralized Power BI dashboard.
Instead of spending hours compiling reports, you get a clear answer to the questions that drive real thrift store growth:
Which product categories are generating the most revenue?
Which item condition sells best and receives higher ratings?
Which donation sources create happier customers?
Which region or store location is performing better?
Are discounts increasing sales—or hurting revenue?
How do revenue and transactions change month-to-month?
Power BI makes this easy through dynamic slicers and visual reports. You filter, compare, and analyze instantly—without complicated formulas or manual calculations.
Key Feature of Thrift Stores Dashboard in Power BI
🚀 Ready-to-use Power BI retail dashboard built for thrift store analytics
🎛️ Interactive slicers for fast filtering by region, location, category, condition, and time
📌 KPI cards on the Overview page for instant performance visibility:
Customer Rating by Donation Source
Total Revenue by Sales Channel
Quantity Sold by Item Condition
Total Revenue by Store Location
💰 Revenue tracking across channels, categories, regions, and months
⭐ Customer rating insights to improve customer experience and donation strategy
🧺 Item condition analysis to understand quality impact on sales and transactions
📦 Category analytics to spot high-demand categories and low-performing groups
🌍 Region comparison to identify strong locations and fix weak markets
📅 Monthly trend tracking to detect seasonality, donation cycles, and promotion impact
🏷️ Discount analysis to measure effectiveness and refine pricing strategy
🔄 Easy Excel integration + refresh for quick updates and consistent reporting
What’s Inside the Thrift Stores Dashboard in Power BI
This dashboard contains five powerful report pages, each designed to answer a specific thrift store business question:
📌 1) Overview Page (Business Command Center)
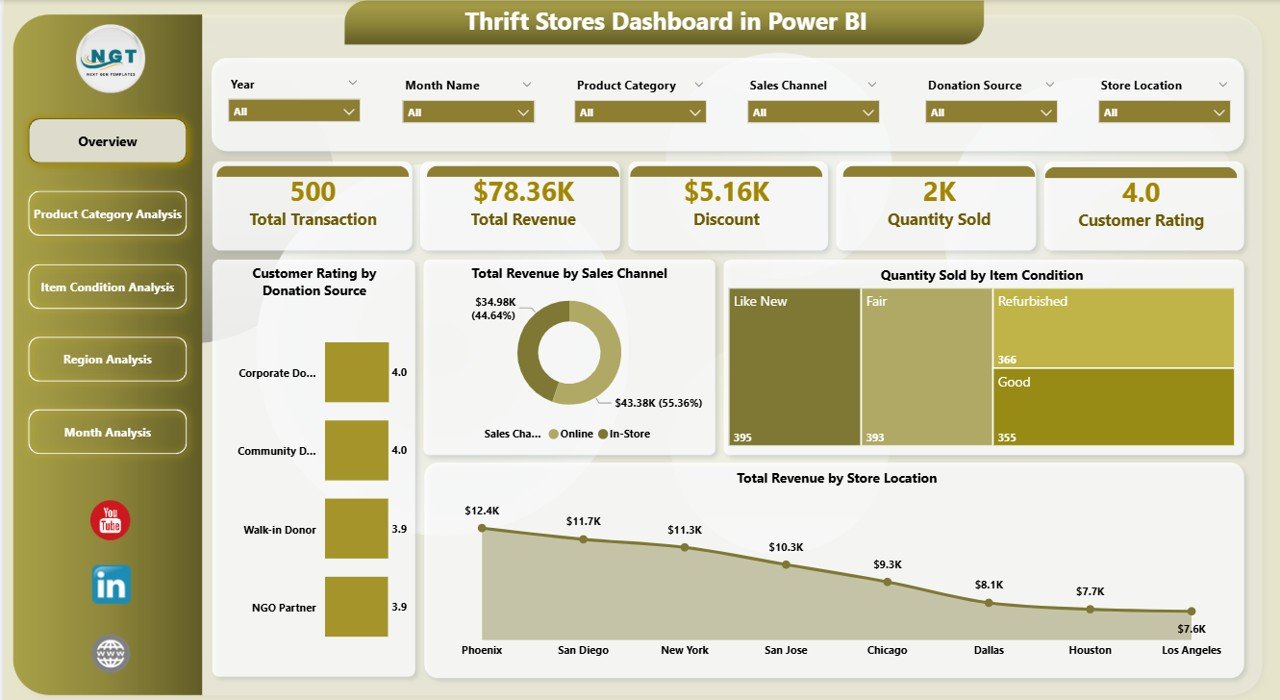
This is your main snapshot page with slicers, summary cards, and fast insights:
Customer Rating by Donation Source
Total Revenue by Sales Channel
Quantity Sold by Item Condition
Total Revenue by Store Location
Because everything is summarized here, managers can understand business health instantly.
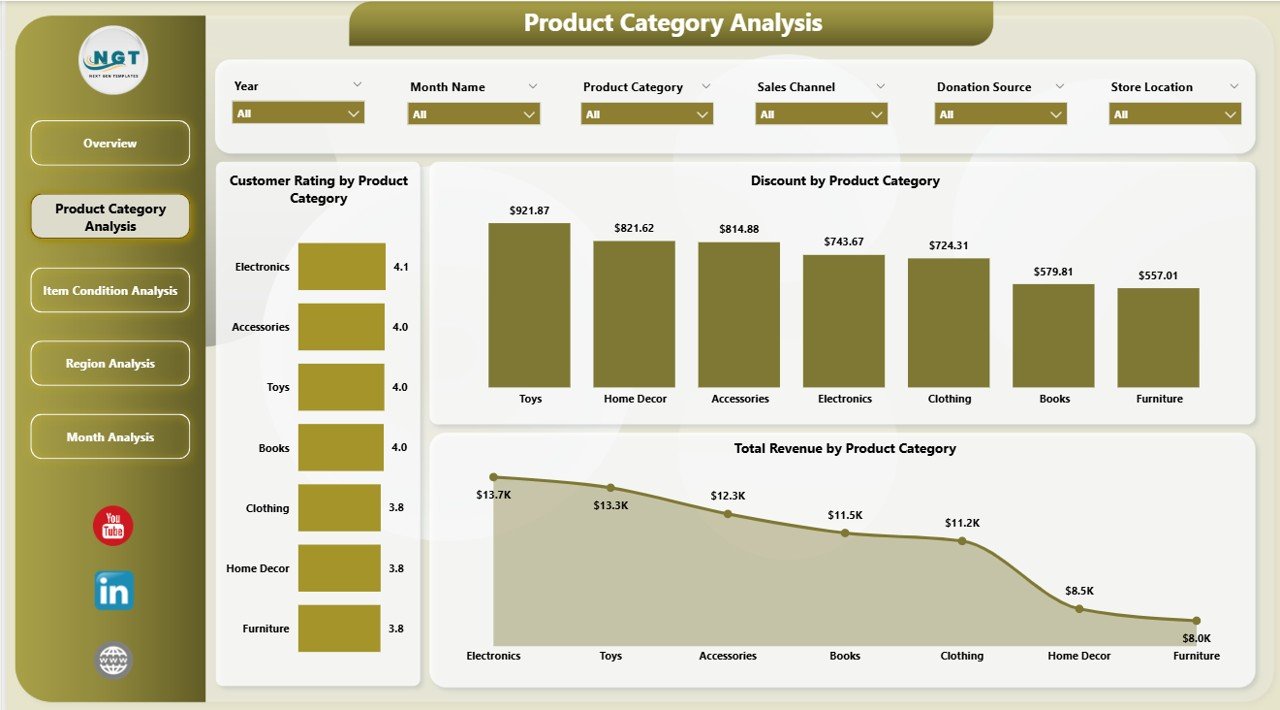
📦 2) Product Category Analysis (What Customers Buy Most)
Thrift inventory varies widely, so category insights are critical. This page includes:
Customer Rating by Product Category
Total Revenue by Product Category
Discount by Product Category
It helps you identify best-selling categories, optimize pricing, and run smarter promotions.
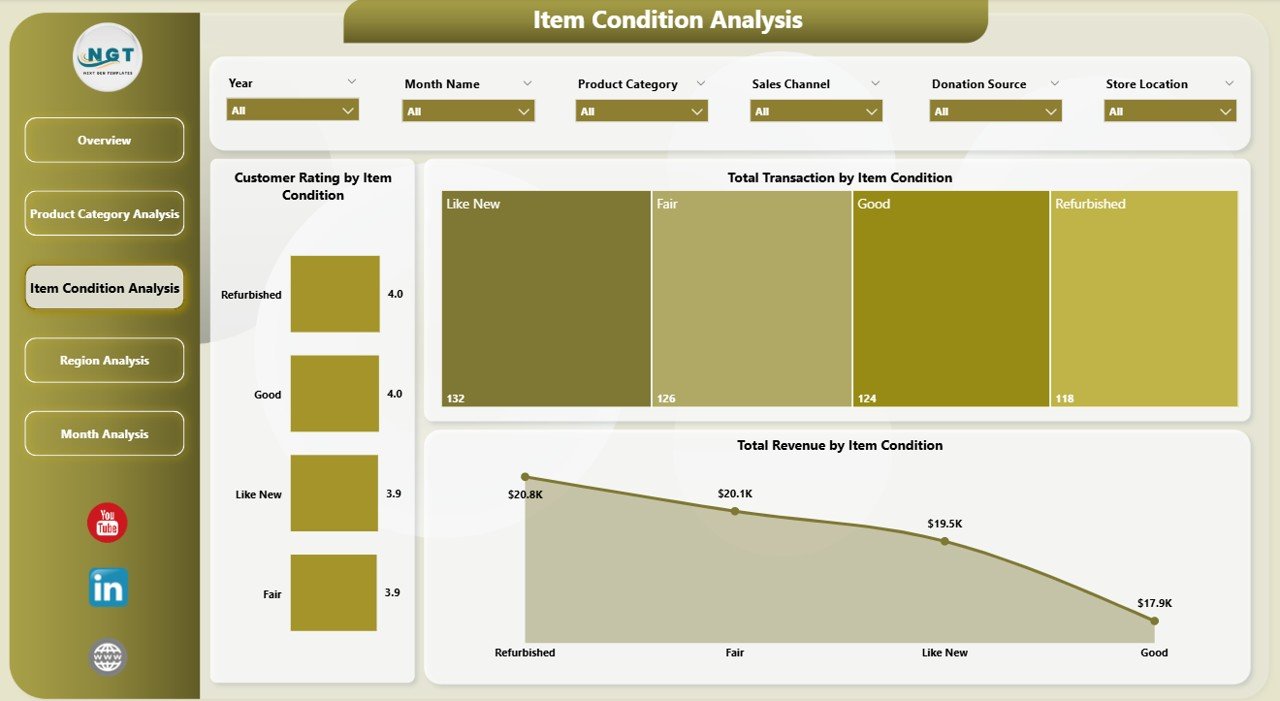
🧺 3) Item Condition Analysis (Does Quality Affect Performance?)
Unlike traditional retail, item condition changes customer perception and pricing. This page shows:
Customer Rating by Item Condition
Total Revenue by Item Condition
Total Transactions by Item Condition
Use it to balance affordability with quality and decide whether refurbished items are worth investing in.
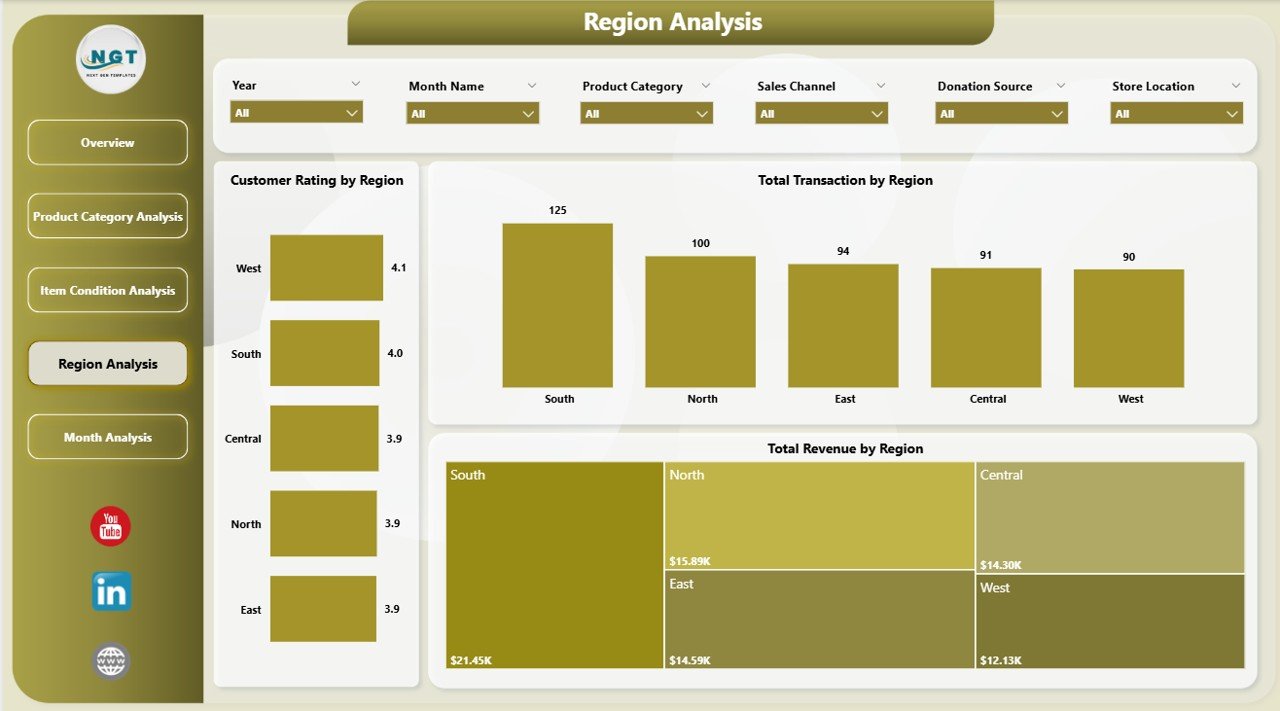
🌍 4) Region Analysis (Which Locations Perform Better?)
If you operate multiple branches, this page becomes your growth compass:
Customer Rating by Region
Total Revenue by Region
Total Transactions by Region
It helps you allocate inventory better, plan location-based marketing, and identify underperforming regions quickly.
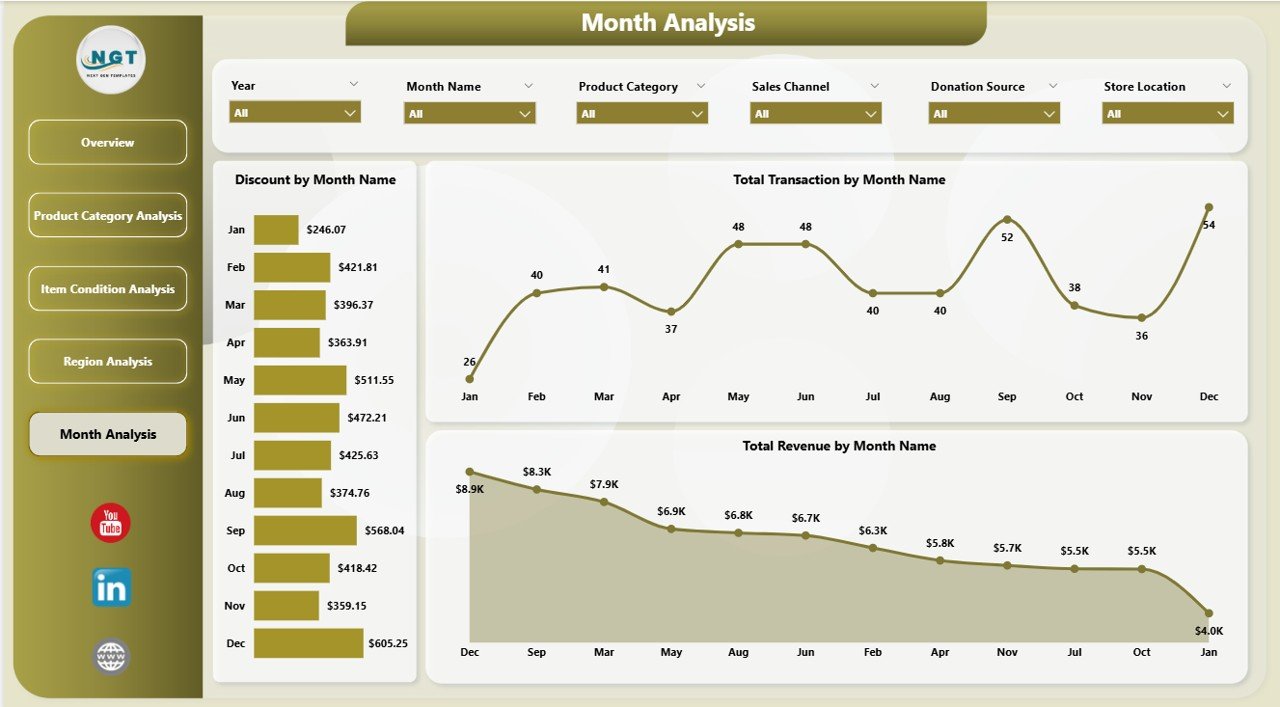
📅 5) Month Analysis (Trends Over Time)
Retail performance changes with seasons, holidays, and donation cycles. This page includes:
Discount by Month
Total Revenue by Month
Total Transactions by Month
Perfect for forecasting demand, preparing promotions, and staffing planning.
How to Use the Thrift Stores Dashboard in Power BI
Even beginners can use it easily:
1️⃣ Import your thrift store data into Power BI (Excel works perfectly)
2️⃣ Connect the dataset to the dashboard model
3️⃣ Refresh the data to update visuals
4️⃣ Use slicers to filter by region, category, month, condition, channel, or location
5️⃣ Review KPIs and charts to take faster decisions
6️⃣ Share reports with your team for aligned execution
Who Can Benefit from This Thrift Stores Dashboard in Power BI
This dashboard is ideal for:
🛍️ Thrift Store Owners
🏪 Store Managers and Supervisors
🌍 Regional and Multi-Store Managers
📦 Inventory and Operations Teams
📣 Marketing Analysts (discount and promotion strategy)
💰 Finance Teams and Controllers
📊 Retail Analysts and Consultants
Whether you run one thrift store or a chain of branches, this dashboard gives you visibility and control.
Click hare to read the Detailed blog post
Visit our YouTube channel to learn step-by-step video tutorials
Youtube.com/@PKAnExcelExpert