Tired of scattered service tickets, unclear response timelines, or inconsistent ratings?
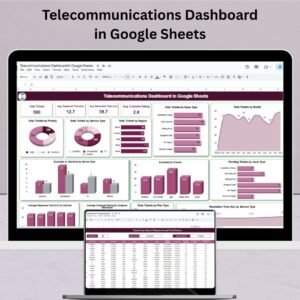
Introducing the Telecommunications Dashboard in Google Sheets – your all-in-one solution to monitor, manage, and elevate your customer service operations. Designed specifically for telecom providers, this ready-to-use tool transforms raw ticket data into actionable insights using smart KPIs, dynamic visuals, and seamless filtering.
Whether you’re managing broadband complaints, mobile queries, or TV service issues—this dashboard keeps your team aligned, efficient, and responsive in real time!
✅ Key Features of the Telecommunications Dashboard in Google Sheets
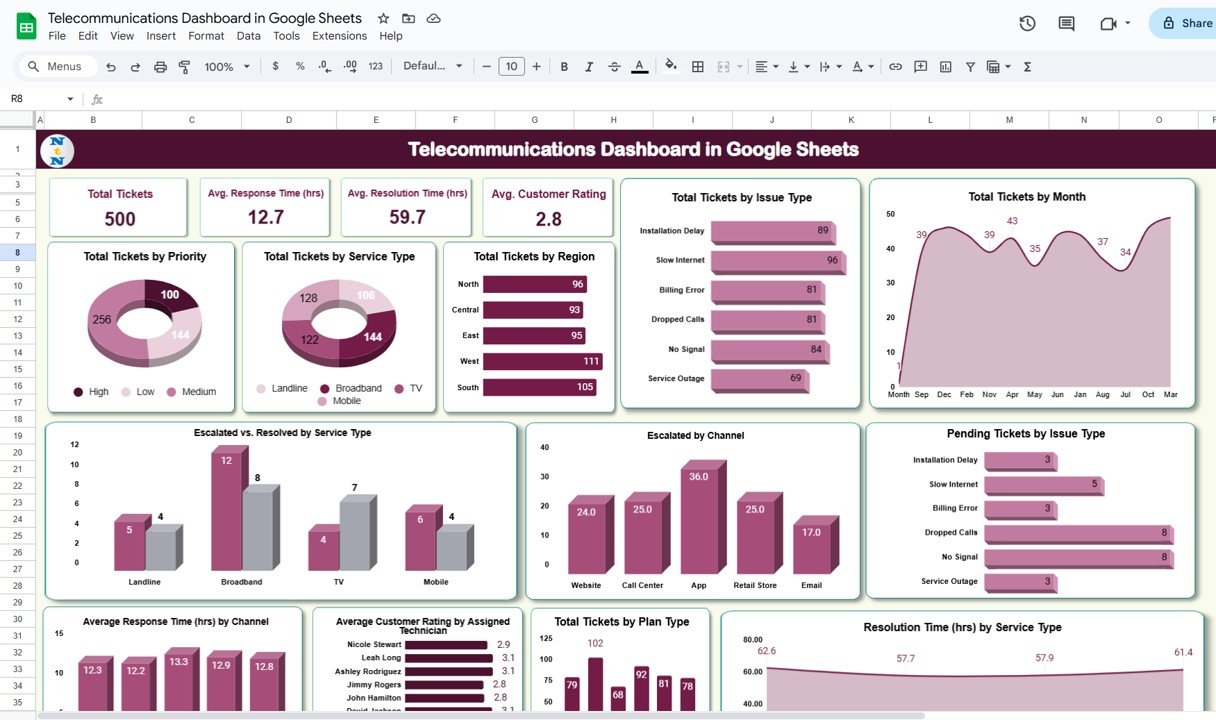
📊 Dashboard Sheet – Visual Intelligence at a Glance
Gain instant clarity with dashboard cards and charts:
-
📌 Total Tickets – Know how many issues have been logged
-
⏱ Avg. Response & Resolution Time – Track speed of service
-
⭐ Avg. Customer Rating – Measure satisfaction across the board
Advanced visualizations include:
-
📈 Tickets by Issue Type, Priority, Month, Region, Plan, and more
-
🔄 Escalated vs Resolved breakdowns
-
📬 Response Time by Channel (Call Center, App, Email)
-
👨🔧 Customer Ratings by Assigned Technician
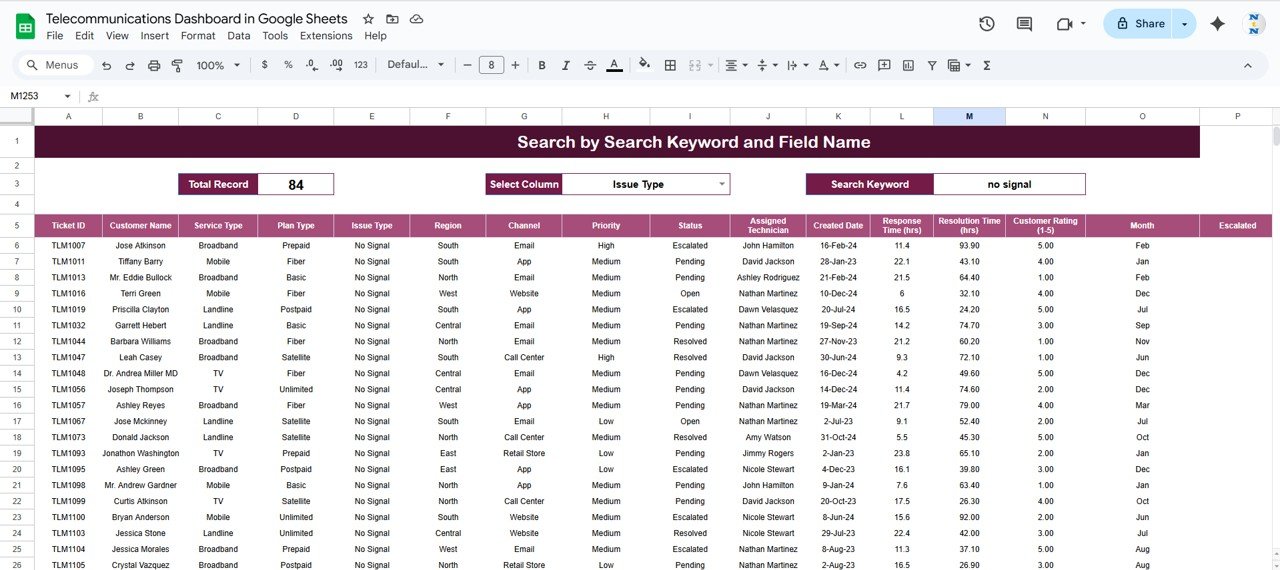
🔍 Search Sheet – Find Tickets in Seconds
No more digging through data!
Use keyword and field-based search (e.g., “No Signal” or “Broadband”) to instantly filter and count relevant records.
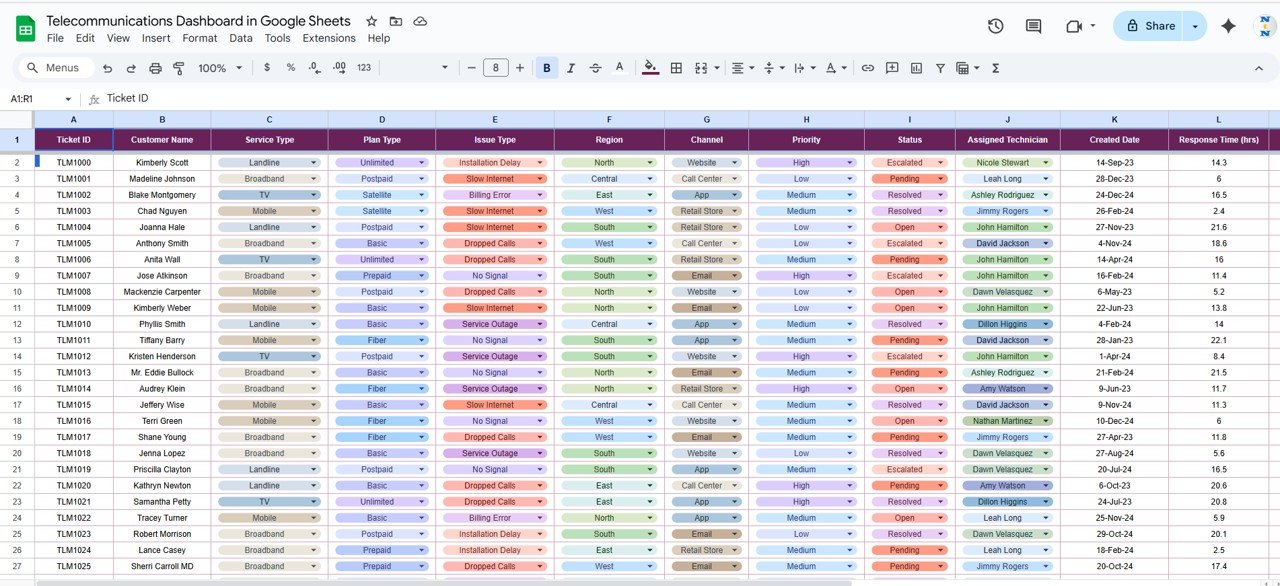
📝 Data Sheet – The Heart of the Dashboard
Capture all ticket details in one structured place:
-
Ticket ID, Issue Type, Priority, Service Type, Plan Type
-
Customer Contact, Assigned Technician, Channel, Region
-
Response & Resolution timestamps
-
Escalation status, Ratings, Remarks
📦 What’s Inside the Telecommunications Dashboard
-
📊 Dashboard Page – Real-time analytics across multiple dimensions
-
🔍 Search Page – Instant keyword-based filtering
-
🧾 Data Page – Input and manage all ticket records
-
🔄 Auto-updating Visuals – No manual refresh needed
-
👨🔧 Technician Tracking – Compare average ratings & performance
-
🌍 Service Type & Region Filters – Pinpoint where problems occur
Everything is fully editable and works out-of-the-box. No coding or formulas needed—just input your data!
🚀 How to Use the Telecommunications Dashboard
-
🎯 Input ticket data into the Data Sheet Tab
-
🔄 The dashboard updates automatically with latest trends
-
📍 Use Search Tab to quickly locate specific issues or patterns
-
📊 Analyze metrics like escalation rate, response time, and customer satisfaction
-
📤 Share the sheet with team members for collaborative updates and actions
Perfect for telecom support teams, managers, and analysts!
👥 Who Can Benefit from This Dashboard?
-
🏢 Telecom Service Providers (broadband, mobile, DTH)
-
🎧 Customer Support Teams resolving tickets daily
-
👨💼 Regional Managers tracking service quality by location
-
👩💻 Business Analysts reviewing performance metrics
-
🛠 Field Technicians assigned to customer complaints
-
🔄 Quality Control Units improving response/resolution cycles
If you deal with service tickets, escalations, or customer feedback—this dashboard is your go-to toolkit! ✅





Reviews
There are no reviews yet.