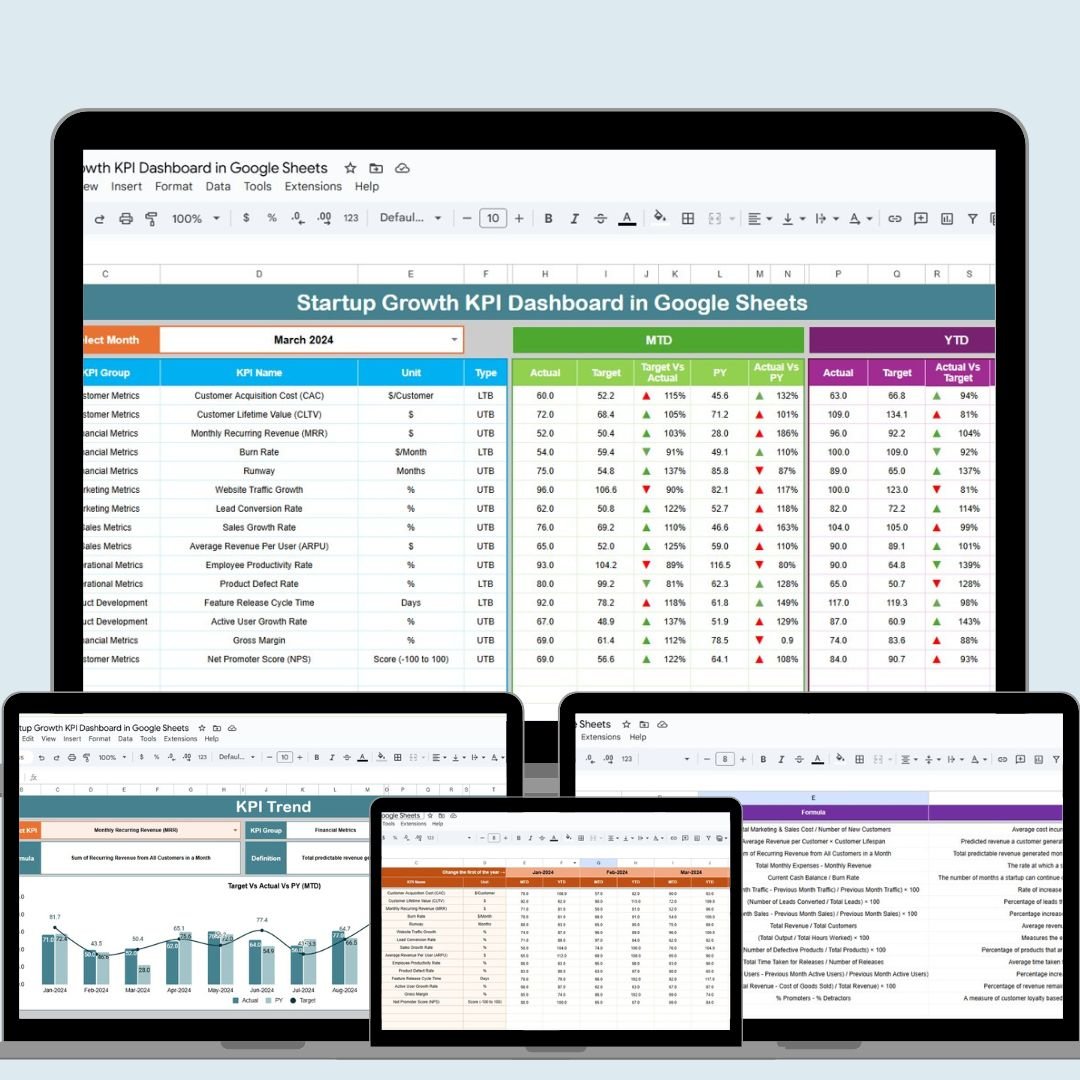
Tracking key performance indicators (KPIs) is essential for startups looking to scale efficiently and effectively. The Startup Growth KPI Dashboard in Google Sheets is a comprehensive tool designed to help founders, managers, and decision-makers monitor important metrics such as Customer Acquisition Cost (CAC), Monthly Recurring Revenue (MRR), churn rate, and more. This dashboard enables you to make data-driven decisions, spot growth opportunities, and address challenges proactively, ensuring sustainable growth and success.
Key Features:
-
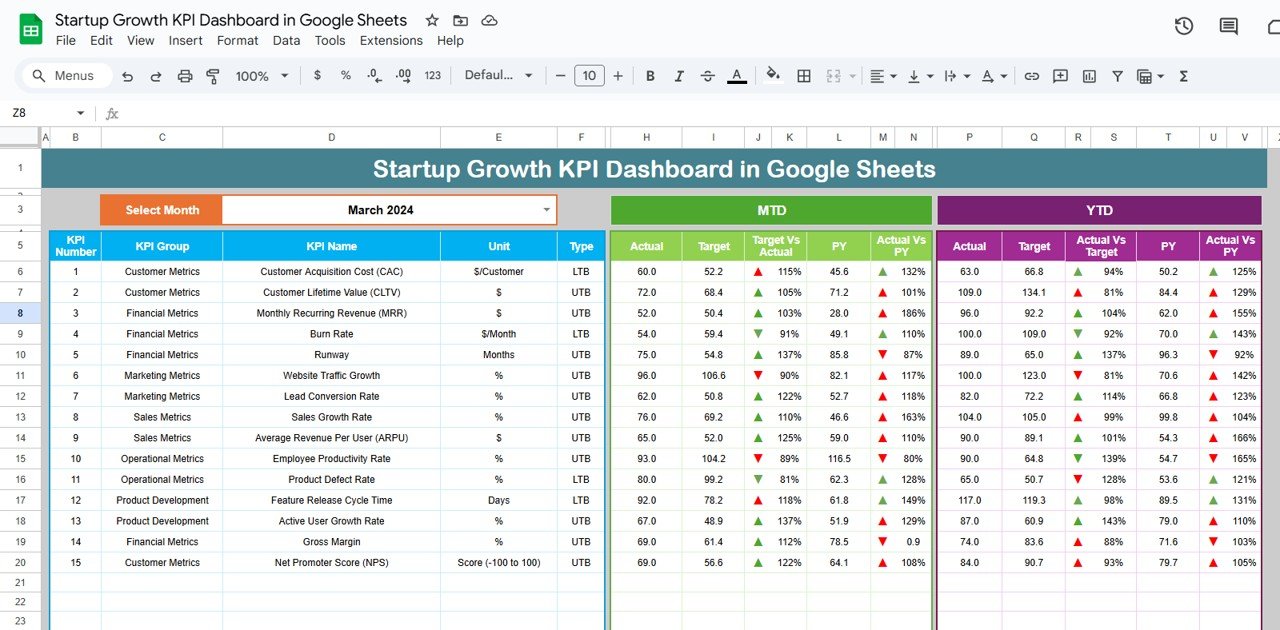
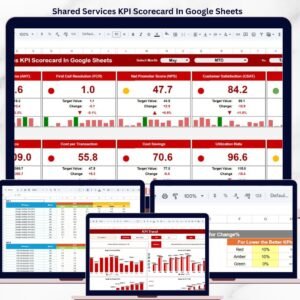
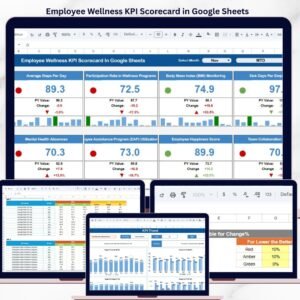
Dashboard Overview: A centralized sheet displaying all key KPIs. With a dropdown menu to select a specific month, you can view both Month-to-Date (MTD) and Year-to-Date (YTD) metrics, including actual numbers, targets, and previous year data. Conditional formatting is used to highlight trends and variations, helping you easily spot areas that need attention.
-
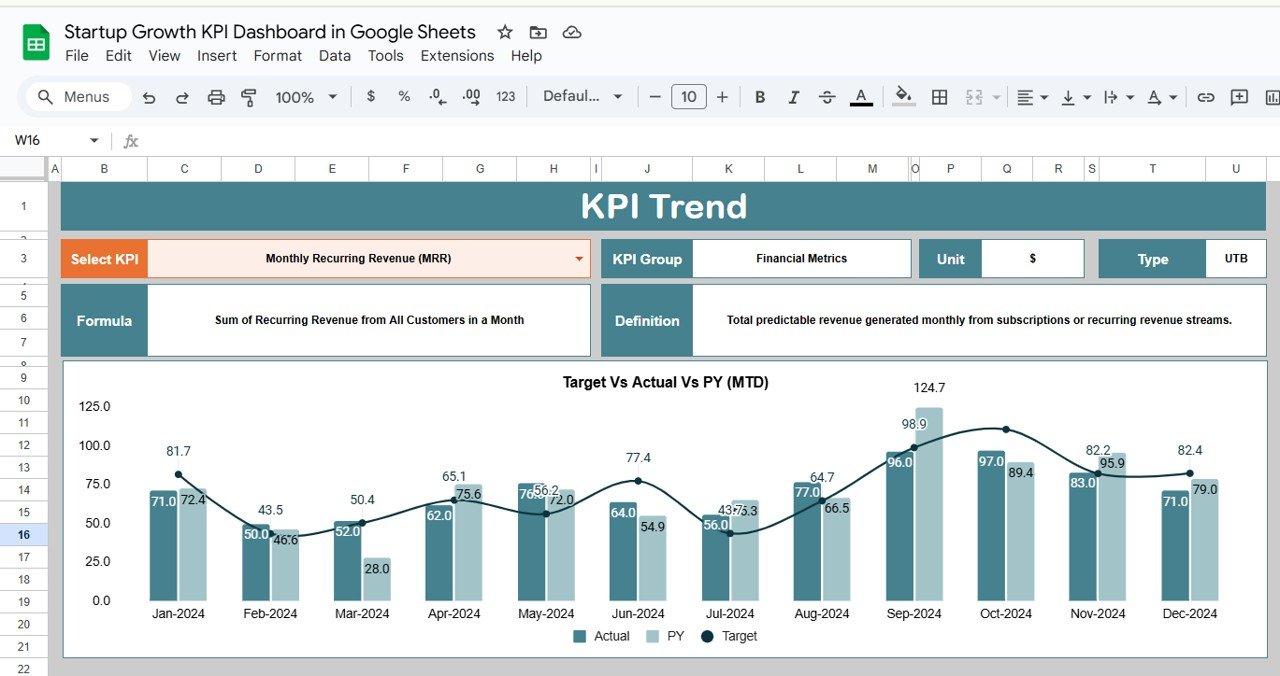
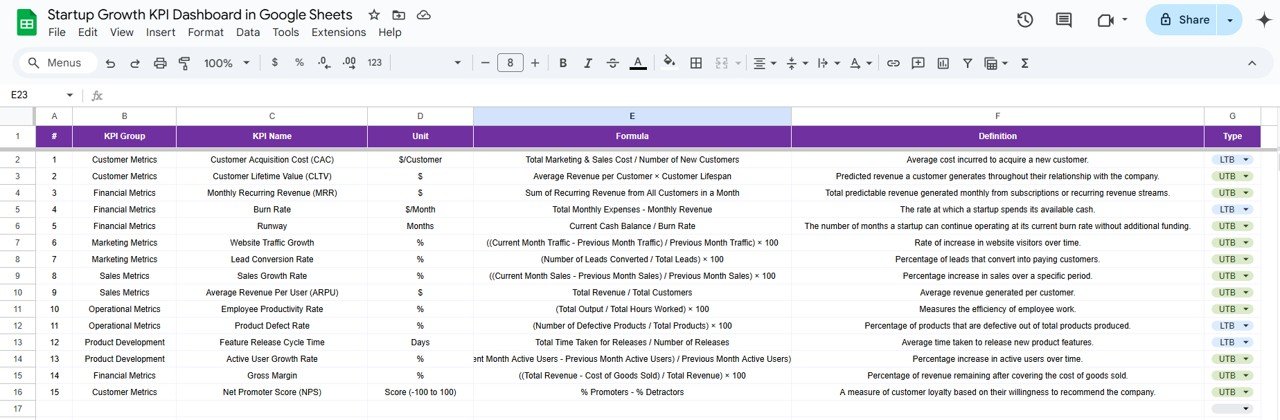
KPI Trend Sheet Tab: Detailed information about each KPI, including its name, unit, type (whether “Lower the Better” or “Upper the Better”), formula, and definition. This ensures that everyone using the dashboard understands what each metric represents and how it’s calculated.
-
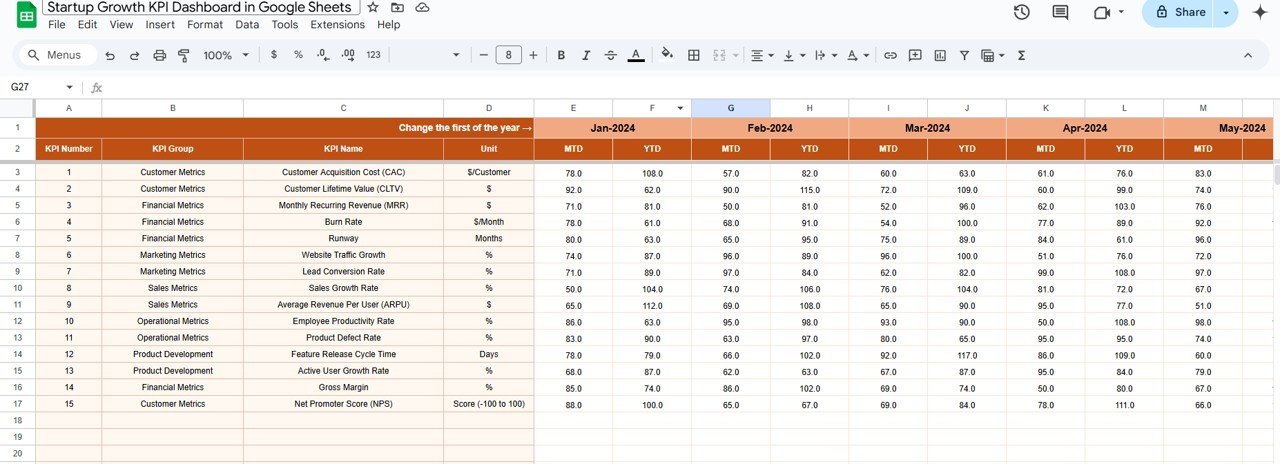
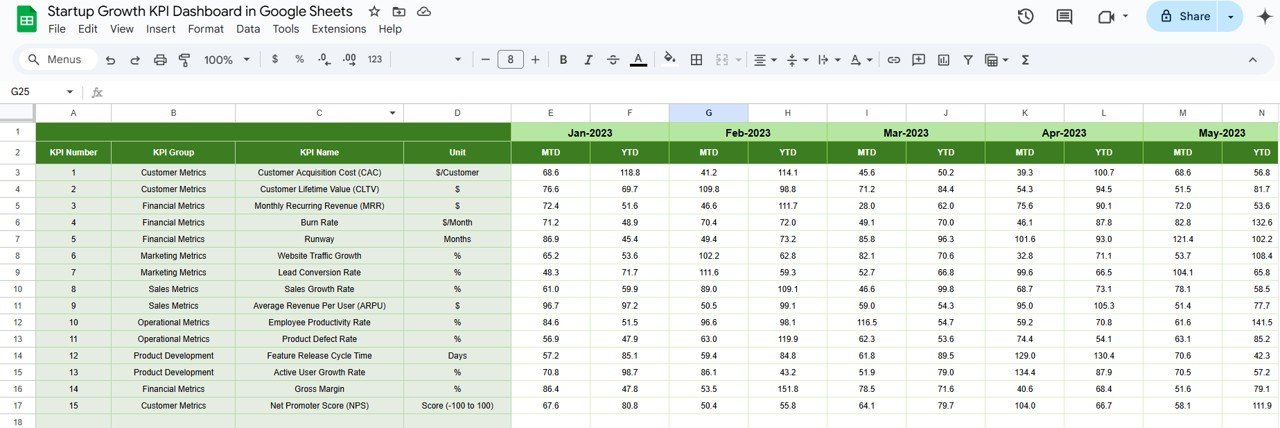
Actual Numbers Sheet Tab: This tab is where you input the actual data for the MTD and YTD periods. It serves as the foundation for the dashboard’s calculations and visualizations.
-
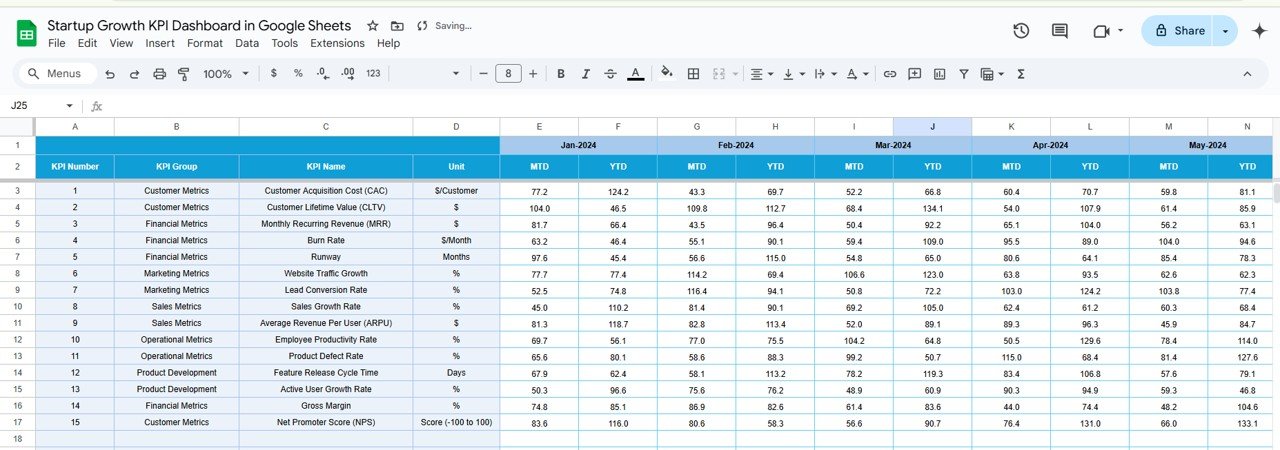
Target Sheet Tab: Set target values for each KPI, and compare them against actual performance. This helps assess whether you’re meeting your growth goals and where improvements are needed.
-
Previous Year Numbers Sheet Tab: Input data from the previous year for comparison. This enables year-over-year analysis, helping you understand how your startup is evolving over time.
-
KPI Definition Sheet Tab: Contains detailed definitions for each KPI, explaining the purpose of the metric, the unit of measurement, and how it contributes to the startup’s growth strategy. This ensures that all users understand the KPIs consistently.
Benefits:
-
Real-Time Monitoring: Keep track of your startup’s performance in real-time, allowing for timely adjustments based on actual data. This enables you to react quickly to changes in key metrics and implement corrective actions where necessary.
-
Informed Decision-Making: Use the data from the dashboard to make informed decisions about marketing, sales, and operational strategies. Data-driven decisions help mitigate risks and improve overall performance.
-
Year-over-Year Comparison: The dashboard allows for a direct comparison of your startup’s current performance against the previous year, helping identify growth trends, areas of improvement, and successful strategies.
-
Performance Evaluation: Evaluate how effectively your startup is hitting its targets and where it’s underperforming. By analyzing KPIs such as CAC, churn rate, and MRR, you can make adjustments to enhance growth and profitability.
-
Increased Accountability: Having clear, measurable KPIs encourages teams to meet specific targets. This improves accountability and ensures that everyone is working towards the same business objectives.
How to Use:
-
Access the Template: Open the provided Google Sheets link to access the KPI dashboard template.
-
Customize the Dashboard: Modify the template to suit your startup’s goals and KPIs. Add or remove metrics as needed.
-
Input Data: Enter actual performance data into the “Actual Numbers” sheet and set target values in the “Target” sheet.
-
Track Trends: Use the “KPI Trend” sheet to analyze trends and identify any areas that need improvement or special attention.
-
Review Performance: Regularly review the “Dashboard” sheet to assess the overall performance of your startup. Make data-driven decisions based on the real-time data provided by the dashboard.
Conclusion:
The Startup Growth KPI Dashboard in Google Sheets is a vital tool for any startup looking to scale. It simplifies the process of tracking and analyzing growth metrics, enabling entrepreneurs to stay on top of their business performance and make informed decisions. By providing a clear, accessible overview of key metrics, it ensures that you’re always equipped with the data you need to drive growth and success.
🔗 Click here to read the Detailed blog post
Visit our YouTube channel to learn step-by-step video tutorials
Youtube.com/@PKAnExcelExpert


Reviews
There are no reviews yet.