


Tracking your business performance just got easier. With the Enterprise Resource Planning KPI Dashboard KPI Dashboard in Google Sheets, you can visualize your organization’s performance across finance, sales, HR, and operations—all in one place. Designed for managers, analysts, and ERP users, this fully customizable dashboard helps streamline performance tracking, spot inefficiencies, and make smarter decisions.
Whether you’re a small business scaling up or an established enterprise looking to improve processes—this Google Sheets dashboard gives you the clarity and control you need to stay ahead.

⚙️ Key Features of the ERP KPI Dashboard in Google Sheets
📋 Dashboard Sheet Tab
Gain instant insight into your business with Month-to-Date (MTD) and Year-to-Date (YTD) metrics.
-
📌 MTD Actual vs Target
-
📈 Previous Year Comparison
-
📊 Conditional Formatting with Up/Down Arrows
-
🎯 Highlights KPIs like sales, profit, HR efficiency, and more
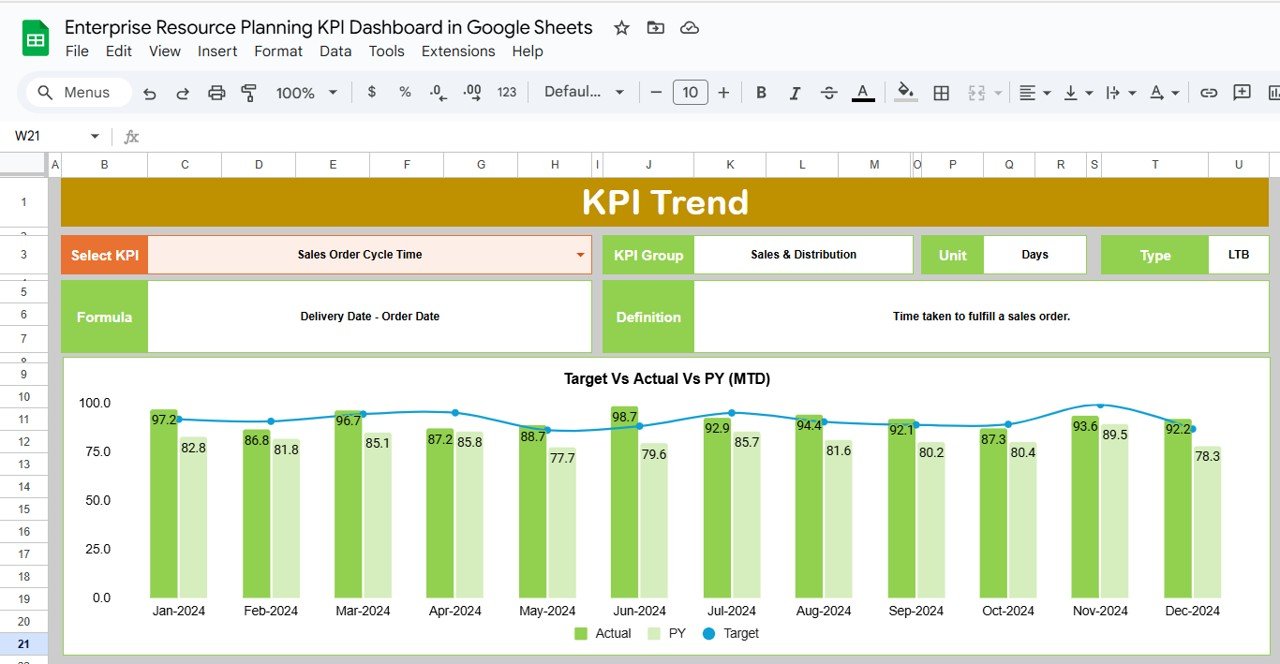
📉 KPI Trend Sheet Tab
Dive into historical performance trends and identify growth or issues over time.
-
📆 KPI-wise dropdown for trend selection
-
🔍 View by category (Finance, Operations, HR, etc.)
-
🧮 Includes KPI type (UTB or LTB), unit, formula & definition
📊 Actual Number Sheet Tab
Enter and track your real-time performance data here.
-
⏱ MTD & YTD data inputs
-
📆 Monthly view via dropdown
-
📊 Auto-populates dashboard cards and charts
🎯 Target Sheet Tab
Set monthly and annual goals to keep your teams on track.
-
✍️ Input monthly targets for each KPI
-
📈 Compare performance against goals
-
🔁 Adjust targets as needed for flexible planning
📆 Previous Year Data Sheet Tab
Compare this year’s progress to the previous year’s metrics.
-
📅 Month-wise input for accurate year-over-year analysis
-
📉 Identify improvement or decline trends
📖 KPI Definition Sheet Tab
Reference all the KPI details in one place.
-
🧠 Definition, formula, and unit of measure
-
🗂️ Organized by category for easy lookup
-
🔢 Helps standardize performance metrics across departments
🧩 What’s Inside the ERP KPI Dashboard in Google Sheets
Everything in this dashboard is tied together through structured data entry and dynamic visualization.
-
✅ 6 professionally designed sheet tabs
-
✅ Dropdowns for smooth user experience
-
✅ Auto-updating charts and summary cards
-
✅ Conditional formatting for red/green signals
-
✅ Fully editable layout and formulas
This tool consolidates your ERP metrics into one centralized command center—so you can stop guessing and start strategizing.
📌 How to Use the ERP KPI Dashboard
📥 Step 1: Download & Open in Google Sheets
No installation or software required—just a Gmail account.
📝 Step 2: Input Actuals and Targets
Use the Actual Number and Target Sheet to enter your latest business data.
📈 Step 3: Review Dashboards
See the live impact of your data across the Dashboard, Trend, and Comparison Sheets.
🎯 Step 4: Take Informed Actions
Use performance gaps and trends to pivot quickly, assign team goals, or improve processes.
🔁 Step 5: Update Monthly
Stay on track by updating the dashboard monthly—or even weekly—for real-time results.
🎯 Who Can Benefit from This ERP KPI Dashboard?
📊 ERP Users – Evaluate effectiveness across modules
🧑💼 Finance Managers – Monitor profit margins, revenue, and expenses
👩💻 HR Teams – Track employee performance and efficiency
🏬 Operations Leaders – Spot bottlenecks in supply or processes
📈 Analysts – Extract insights to optimize business strategy
Whether you’re a team of 10 or 10,000—this dashboard adapts to your needs.
💡 Why Choose This Google Sheets ERP Dashboard?
✅ Real-time analytics across departments
✅ Shareable and cloud-based—perfect for teams
✅ Fully customizable KPIs and layouts
✅ Built-in historical comparisons and trend tracking
✅ No coding or BI tools required
🔗 Click here to read the Detailed blog post
Click here to read the Detailed blog post
🎥 Visit our YouTube channel to learn step-by-step video tutorials
Youtube.com/@NeotechNavigators


Reviews
There are no reviews yet.