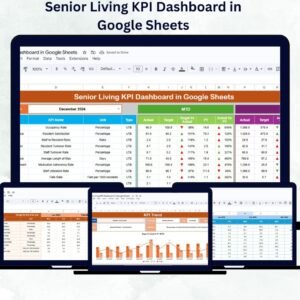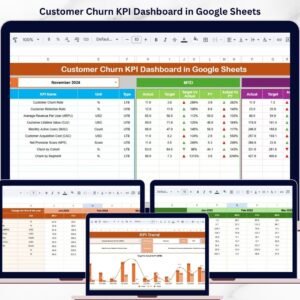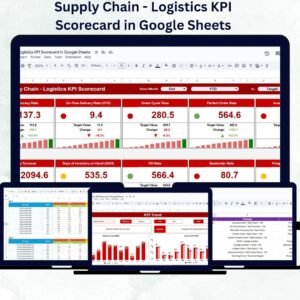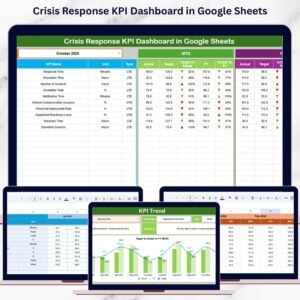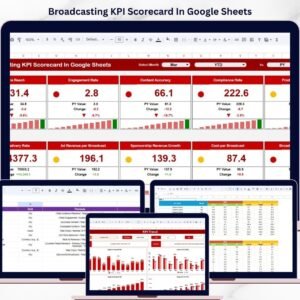
Managing inventory efficiently is the backbone of any successful retail operation. That’s why we’ve created the Retail Inventory KPI Dashboard in Google Sheets — a powerful, plug-and-play solution to help you stay in control of your stock, sales, and supply chain performance in real time.
Whether you’re running a small store or managing a large retail chain, this dashboard gives you instant insights into stock levels, turnover ratios, and inventory efficiency so you can make smarter decisions — faster.
✨ Key Features of the Retail Inventory KPI Dashboard
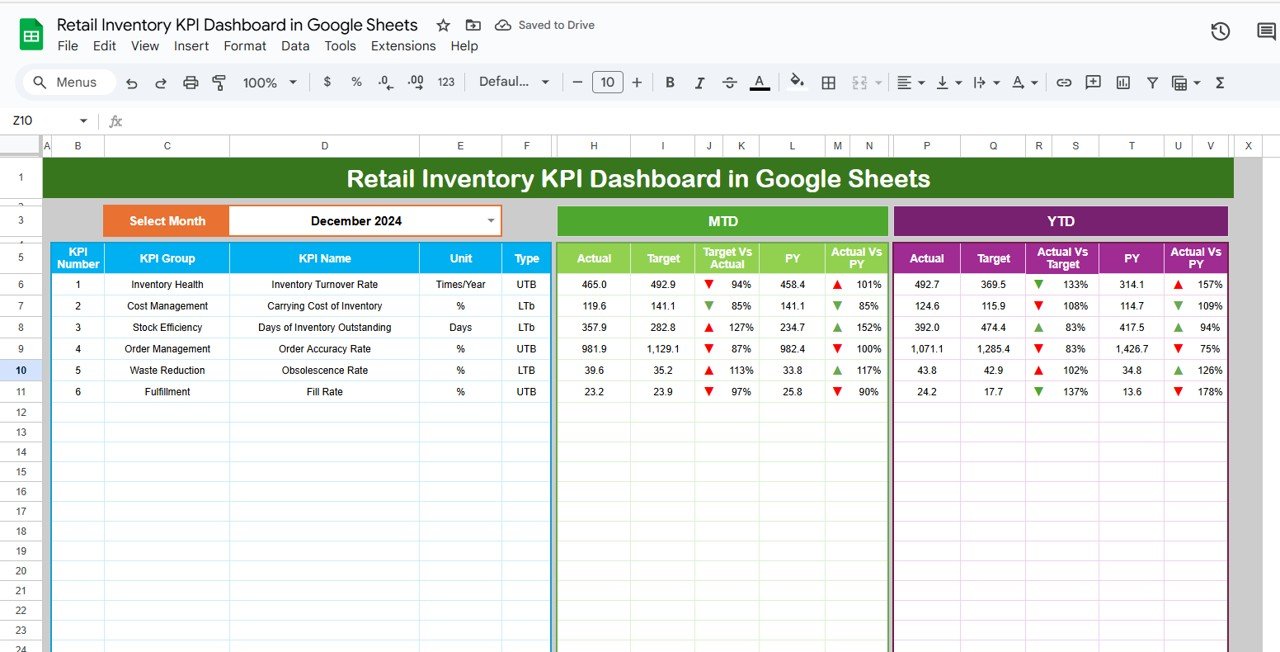
📊 Dynamic Dashboard Sheet
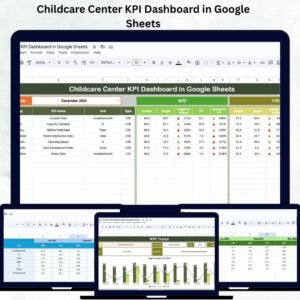
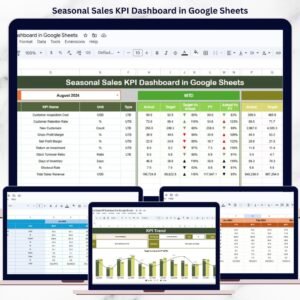
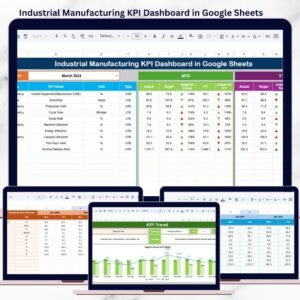
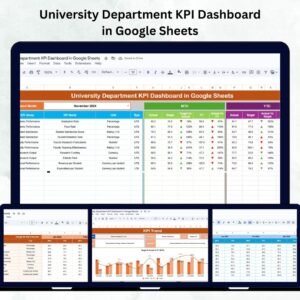
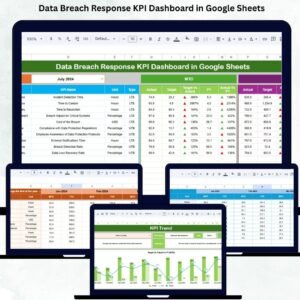
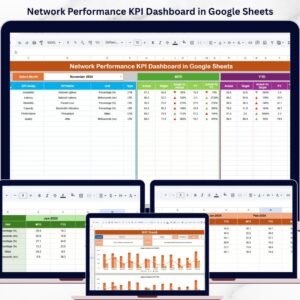
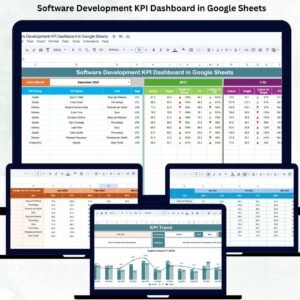
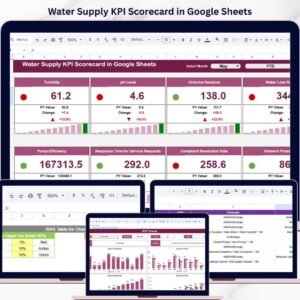
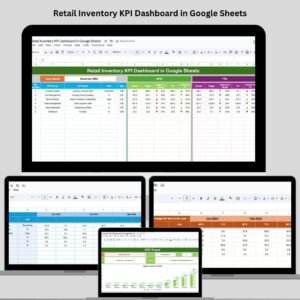
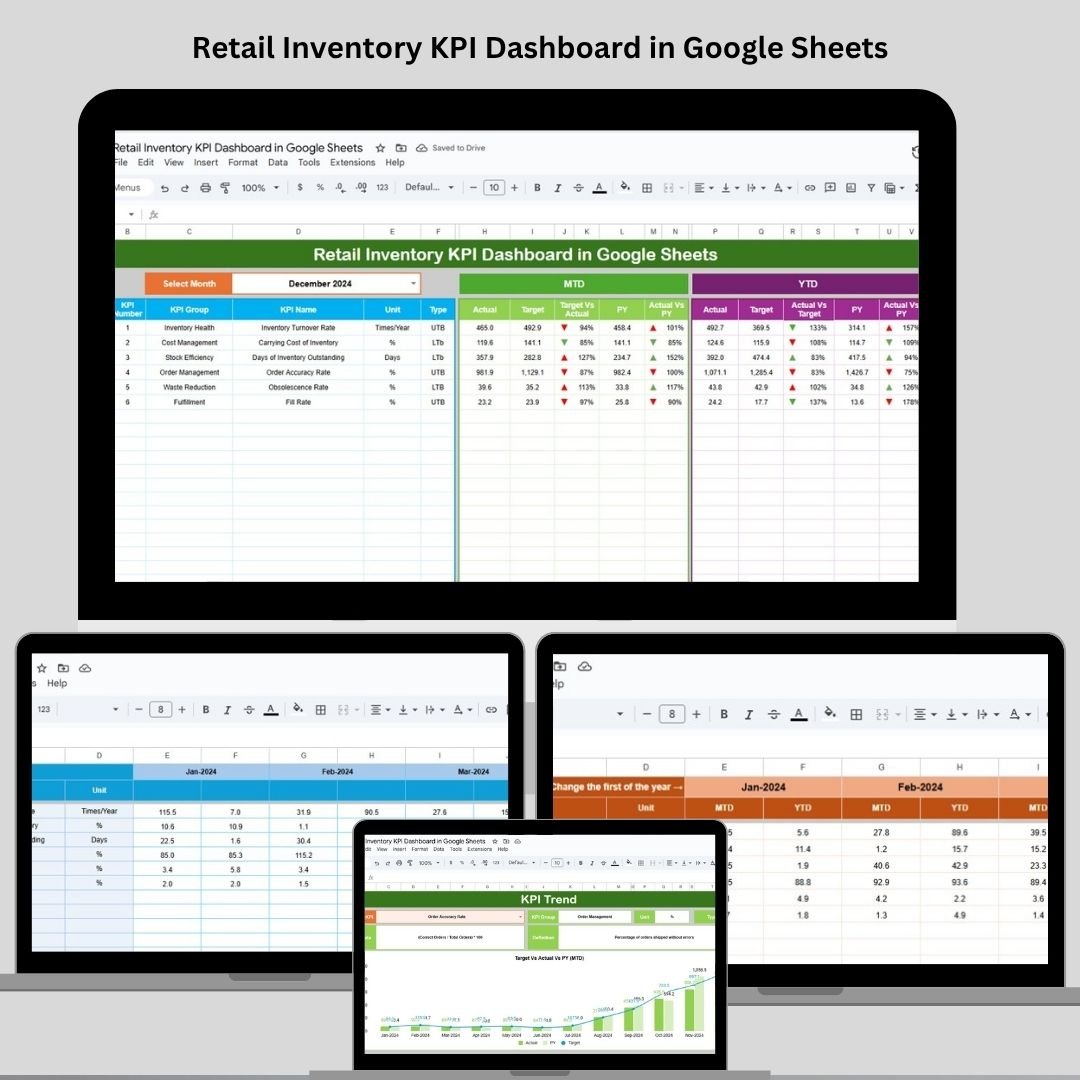
Track your monthly and year-to-date KPIs in a single glance. Includes:
MTD & YTD Actual vs. Target vs. Previous Year
Auto-updating visuals
Conditional arrows for performance cues 🔼🔽
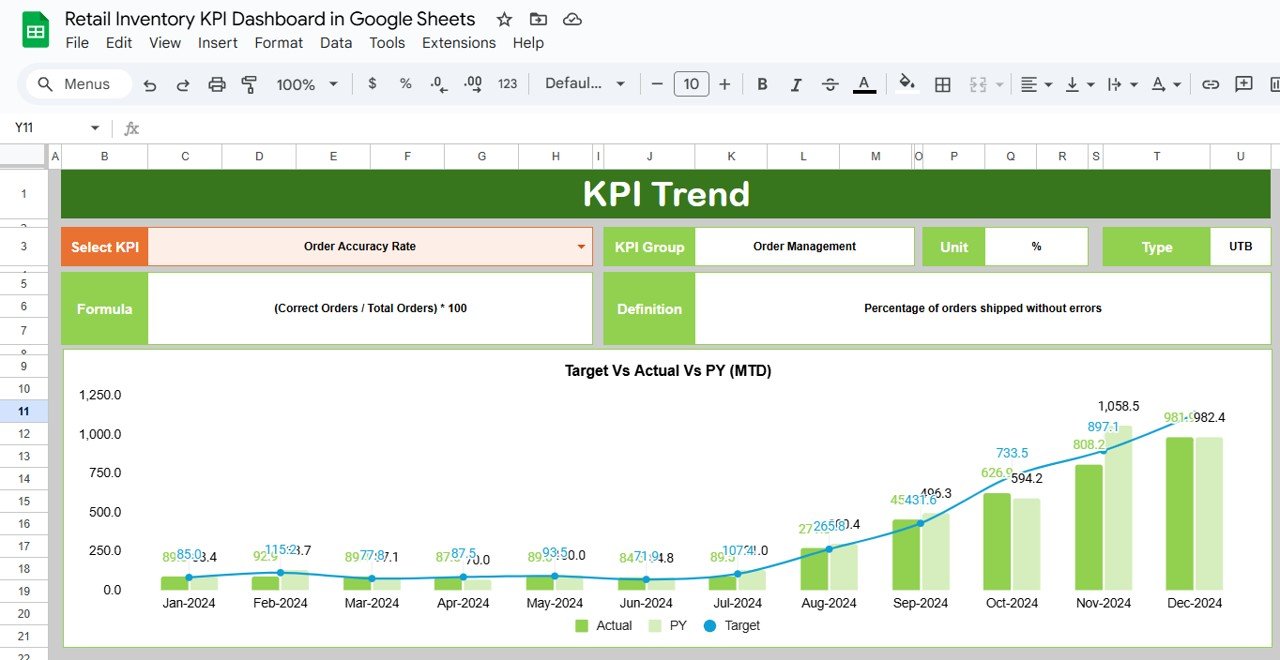
📈 KPI Trend Tracking
Select a KPI from the dropdown and view its performance over time. Understand how metrics like stockouts, turnover, and days on hand evolve monthly.
📂 Organized Sheet Tabs
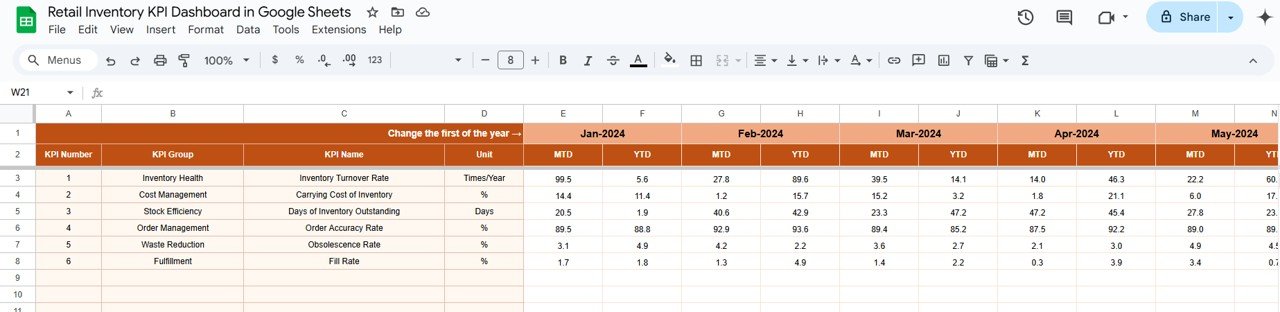
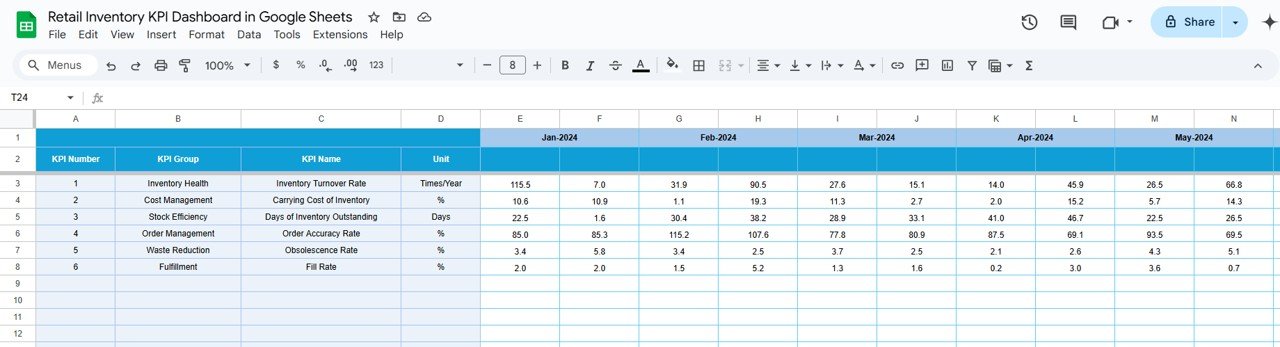
Actual Numbers Sheet – Enter monthly KPI values
Target Sheet – Set your monthly and YTD goals
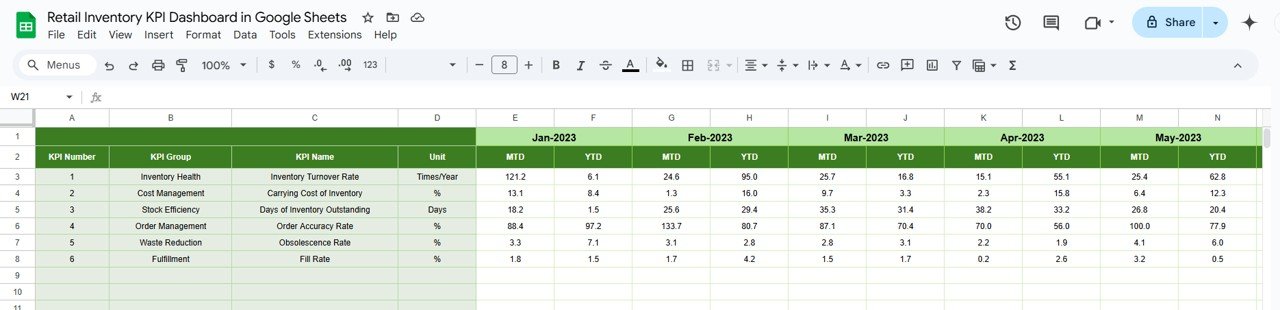
Previous Year Data Sheet – Input historical values for performance comparisons
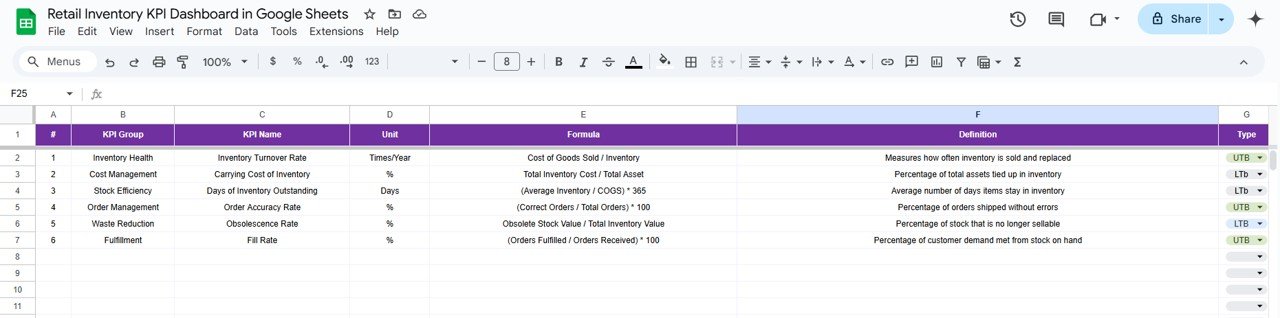
KPI Definition Sheet – Clear formulas, definitions, and performance type (LTB/UTB)
🛠 100% Customizable
Add or remove KPIs, change layout, color code, and personalize it to fit your retail strategy.
📤 Real-Time Updates
Input data and instantly see updated dashboards with zero delay.
🧩 What’s Inside the Retail Inventory KPI Dashboard
Inside this dashboard, you’ll find everything needed to monitor and optimize your inventory health:
✅ Pre-built KPI categories, such as:
Inventory Turnover
Days of Inventory on Hand
Stockout Rate
Resupply Lead Time
Average Order Value
✅ Comprehensive Data Sheets
Each sheet feeds into the dashboard and ensures seamless data flow.
✅ Drop-downs & Filters
Select KPIs and months to visualize trends with ease. No complex formula editing required!
🔧 How to Use the Retail Inventory KPI Dashboard
Input Actual KPI Data in the “Actual Numbers” tab
Set Targets in the “Target” tab for both MTD and YTD
Update Previous Year’s Data for historical tracking
Head to the Dashboard Sheet to instantly view the performance
Use the KPI Trend Sheet to dive deep into any KPI’s progress
Customize, export, and share as PDF with your team or stakeholders
Even if you’re not an Excel/Sheets expert, you’ll find this tool super easy to use!
👥 Who Can Benefit from This Dashboard?
🛍 Retail Store Owners – Keep shelves full and customers happy
📦 Inventory Managers – Avoid stockouts and reduce excess inventory
💼 Business Analysts – Monitor trends, compare targets, and make data-backed decisions
📊 E-commerce Sellers – Balance fast-moving inventory with customer demand
🏢 Procurement Teams – Align purchases with demand forecasts
Whether you’re managing 10 SKUs or 10,000, this dashboard puts you in the driver’s seat.
🎯 Why Choose Our Google Sheets Dashboard?
✅ Google Sheets Based – Access it anywhere, anytime
✅ Customizable – Tailor it to your operations
✅ Visual Insights – Built-in charts and color cues
✅ Instant Reporting – Say goodbye to manual reporting
✅ No Tech Hassle – Easy to use and ready out-of-the-box
📚 Click here to read the Detailed blog post
Watch the step-by-step video Demo: