


If you’re struggling to keep your freight operations under control—juggling delivery times, shipping costs, and on-time performance—it’s time for a smarter solution. Introducing the Freight Management KPI Dashboard in Google Sheets – your all-in-one, real-time, data-powered logistics command center!
This professionally designed Google Sheets dashboard helps logistics and transportation teams track, analyze, and optimize freight operations with ease. It offers six powerful worksheet tabs that let you monitor essential KPIs, compare actuals vs. targets, and analyze trends over time—no more scattered spreadsheets or disconnected tools.
Whether you manage regional shipments or global logistics, this tool provides instant clarity so you can make data-driven decisions that improve your bottom line and delivery efficiency.

✨ Key Features of Freight Management KPI Dashboard
-
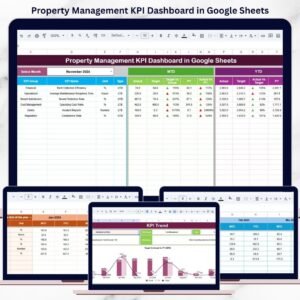
📊 Dashboard View with Real-Time Metrics – Instantly see Month-to-Date (MTD) and Year-to-Date (YTD) actuals, targets, and previous year comparisons
-
📈 KPI Trend Sheet – Analyze each KPI over time and monitor performance shifts using dropdown filters
-
📌 Conditional Formatting & Visual Arrows – Get quick visual cues for KPI performance with up/down arrows
-
📝 Editable KPI Definitions Tab – Stay aligned with clear KPI formulas, unit types, and performance criteria
-
🧮 Smart Data Entry Sheets – Just update actual and target values, and the dashboard updates automatically
-
🔁 PY Comparison Tab – Input and compare previous year data to measure growth or gaps
-
⚙️ 100% Customizable – Add new KPIs, adjust formulas, or modify chart views to suit your needs
-
📍 Google Sheets Ready – Access it anytime, anywhere—perfect for remote logistics teams!
📦 What’s Inside the Freight Management KPI Dashboard
This ready-to-use Google Sheets dashboard is organized into six smart worksheet tabs for streamlined freight performance tracking:
-
Dashboard Sheet Tab
-
Shows MTD/YTD actuals, targets, and comparisons to the previous year
-
Conditional formatting with up/down arrows for easy visual analysis
-
-
KPI Trend Sheet Tab
-
Select any KPI from the dropdown and analyze performance trends
-
Includes unit, KPI group, formula, and KPI type (Lower/Upper the Better)
-
-
Actual Number Sheet Tab
-
Input current month’s actuals for MTD and YTD—dashboard updates instantly
-
-
Target Sheet Tab
-
Set monthly and yearly performance targets per KPI
-
-
Previous Year Number Sheet Tab
-
Input past year’s data to compare and track improvement or regression
-
-
KPI Definition Sheet Tab
-
Clear KPI breakdown with definition, formula, unit, and importance
-
🧑💼 How to Use the Freight Management KPI Dashboard
📍 Step 1: Start by entering current KPI data in the “Actual Number” sheet
📍 Step 2: Input your targets in the “Target” sheet
📍 Step 3: If available, add last year’s values in the “Previous Year” tab
📍 Step 4: Head over to the Dashboard sheet to view automated charts and arrows
📍 Step 5: Use the KPI Trend tab to analyze long-term trends and make decisions accordingly
No complex formulas to set up. Just plug and play!
🚀 Who Can Benefit from This Freight Dashboard?
-
Logistics Managers – Track cost per shipment, delivery rates, and route performance
-
Operations Teams – Optimize freight utilization and cut unnecessary costs
-
Supply Chain Analysts – Identify bottlenecks using real-time data and KPI trends
-
Warehouse Supervisors – Monitor shipping volume and on-time performance
-
E-commerce Stores – Gain visibility on shipping efficiency and reduce customer complaints
-
Transport Companies – Centralize operations data across regions and clients
-
3PL Providers – Offer insights-driven service to clients using performance KPIs
Whether you’re a startup or a large freight company, this dashboard helps you stay organized, boost efficiency, and reduce costs.
🔗 Click here to read the Detailed blog post
Watch the step-by-step video Demo:


Reviews
There are no reviews yet.