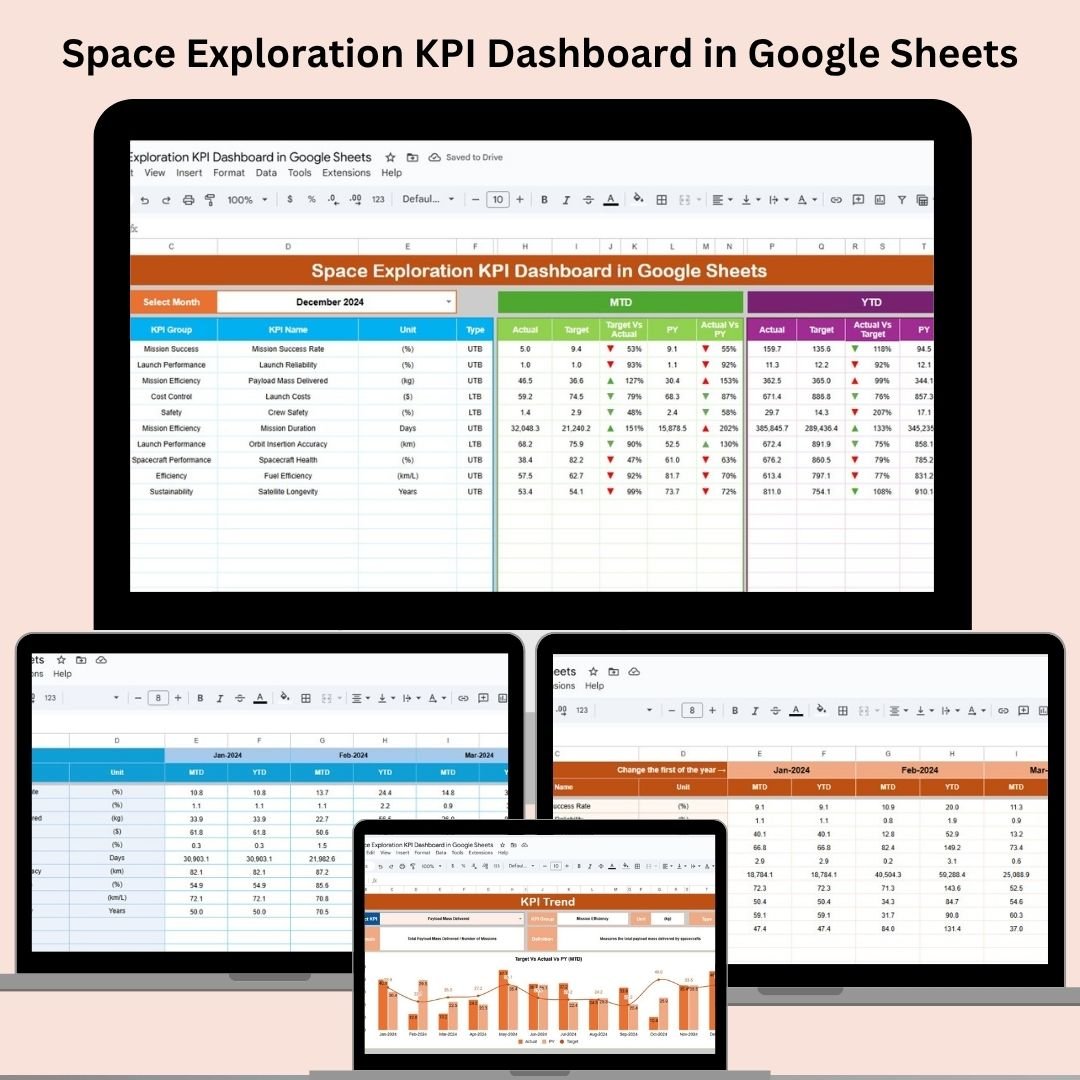
Track your mission to the stars with precision. The Space Exploration KPI Dashboard in Google Sheets is a ready-to-use performance management tool designed for space agencies, satellite companies, and research organizations. It empowers teams to monitor critical KPIs such as mission success rates, cost per launch, and fuel efficiency—all in real-time, in one centralized and shareable Google Sheet.
🧩 Key Features of the Space Exploration KPI Dashboard
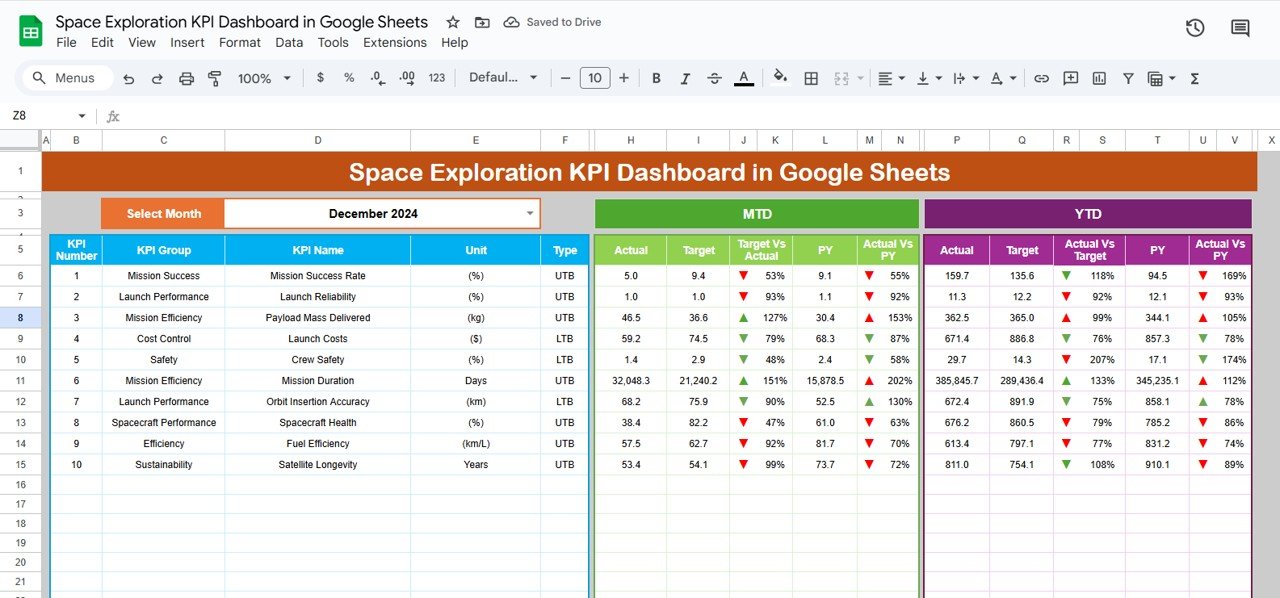
📊 Dashboard Overview Sheet
This is your mission control panel. View all KPIs for:
-
Month-to-Date (MTD) and Year-to-Date (YTD) metrics
-
Target vs. Actual and Previous Year vs. Actual comparisons
-
Arrows to indicate progress—green for on track, red for below target
📅 Month Selector – Instantly switch views with a dropdown in cell D3
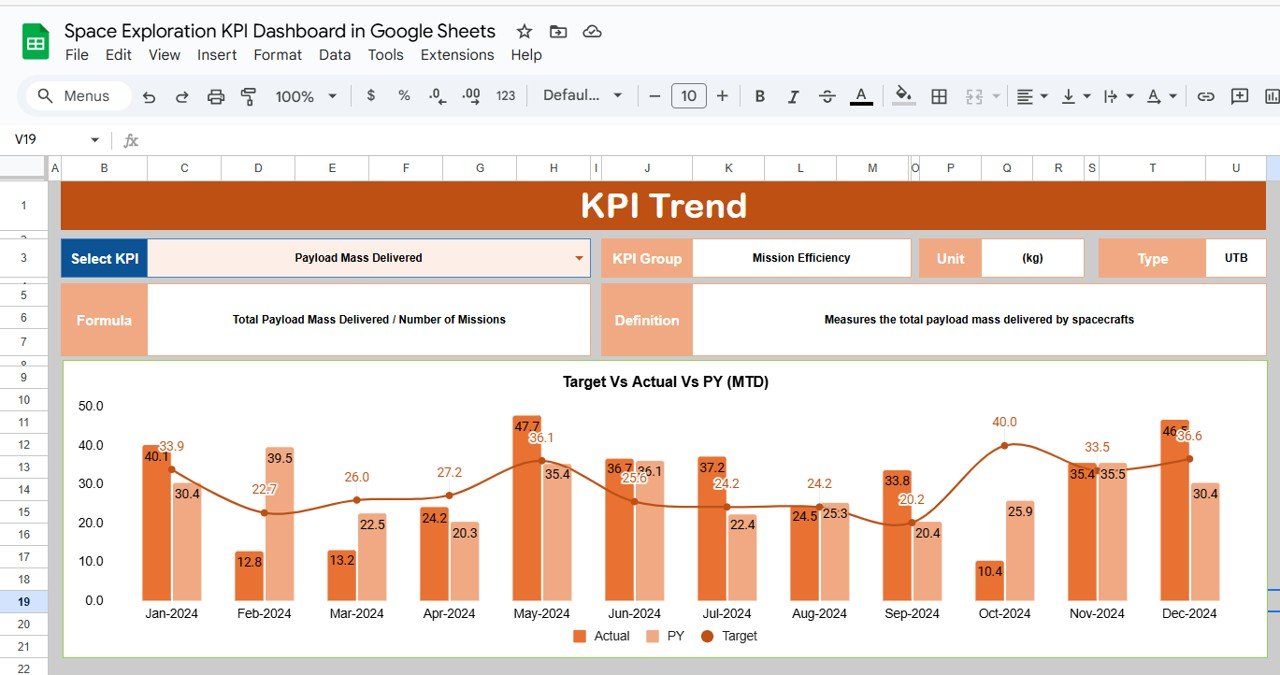
📈 KPI Trend Sheet Tab
Track the historical trajectory of any KPI:
-
Choose your KPI from a dropdown
-
View KPI Group, Unit, and Type (UTB/LTB)
-
Understand the calculation formula and definition
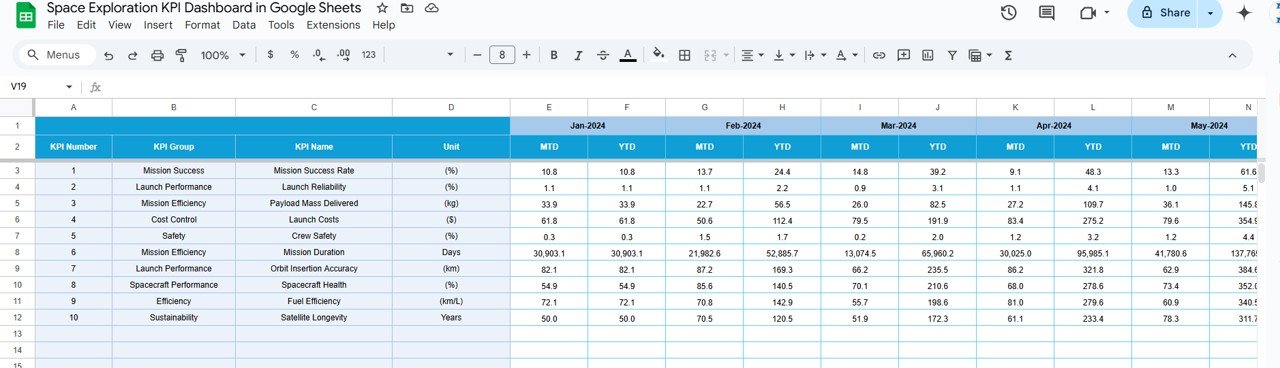
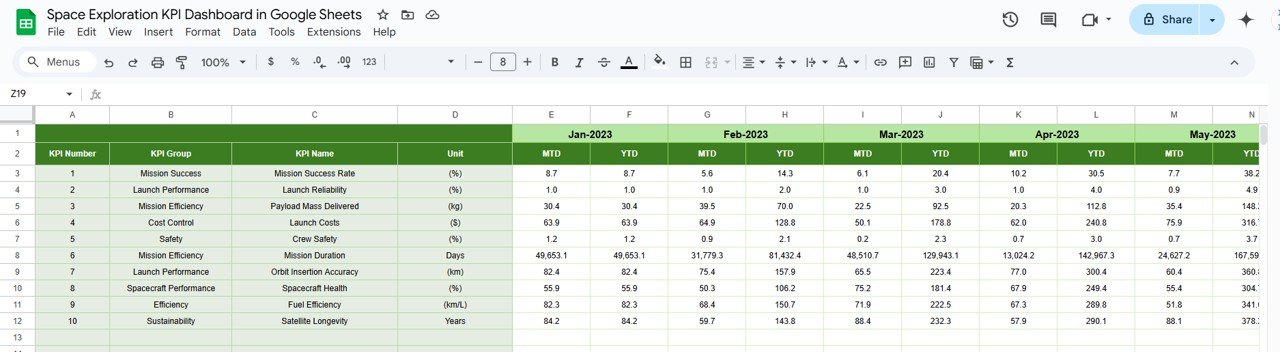
📥 Actual Number Sheet Tab
Log MTD and YTD actuals for each KPI. Change the reporting month via E1 and keep your data clean and flexible.
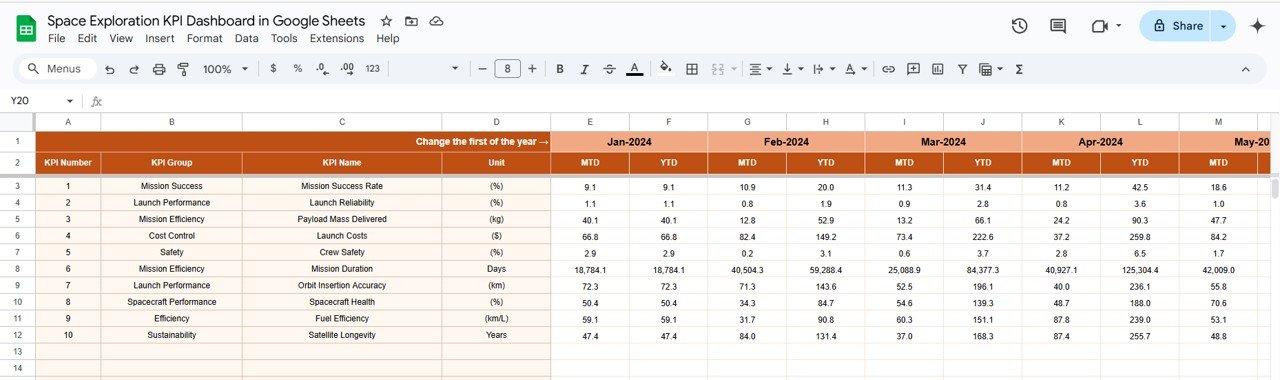
🎯 Target Sheet Tab
Set your monthly and annual performance targets for all KPIs. Your dashboard will visually compare these against actuals.
📊 Previous Year Sheet Tab
Enter last year’s values to compare current performance and evaluate long-term improvement.
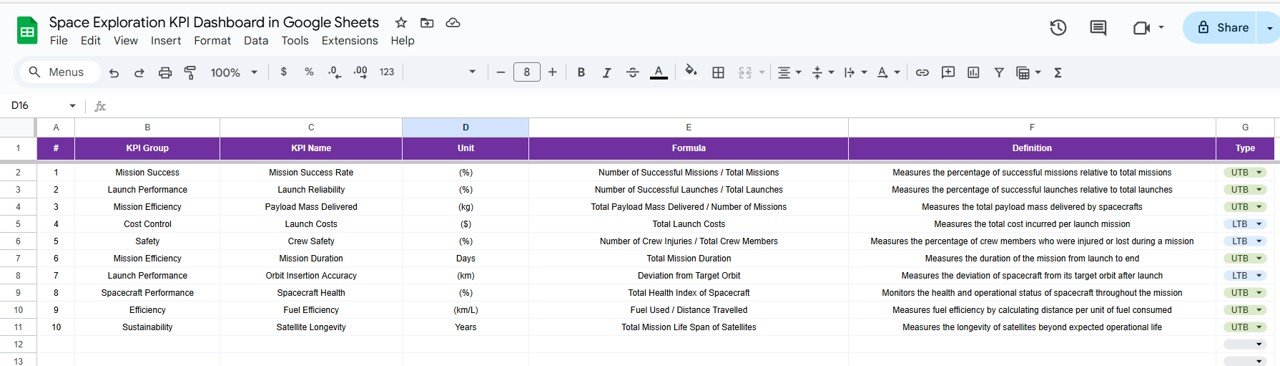
📘 KPI Definition Sheet Tab
Understand each metric clearly with:
-
KPI Name and Group (e.g., Mission Success, Launch Cost)
-
Unit of measurement (%, $, # of satellites)
-
Formula and detailed definition
Everything is dynamically connected to provide instant insight with zero coding or manual updates.
🛰️ What’s Inside the Dashboard?
The Google Sheets file includes:
-
✅ Dashboard Sheet – Visual KPIs with target vs actual tracking
-
✅ KPI Trend Sheet – Historical views for performance analysis
-
✅ Actual Numbers – Data entry tab for monthly and annual metrics
-
✅ Target Sheet – Input performance goals
-
✅ Previous Year Sheet – Store and compare last year’s data
-
✅ KPI Definition Tab – Central reference for understanding KPIs
All sheets work together to generate automated visualizations and progress tracking.
🧑🚀 How to Use the Space Exploration KPI Dashboard
🗓️ Step 1: Select the month and enter MTD/YTD actual data
🎯 Step 2: Input your target values and previous year’s benchmarks
📈 Step 3: Use the Dashboard to monitor performance with visual cues
📊 Step 4: Analyze trends using the KPI Trend tab
⚙️ Step 5: Customize KPIs or add new ones to meet mission-specific goals
From rockets to rovers—this dashboard works for every space project.
👥 Who Should Use This Dashboard?
🛰️ Aerospace Engineers & Mission Planners – Track launch metrics, mission outcomes, and system reliability
📊 Data Analysts & Research Teams – Monitor and compare KPIs across timelines
🚀 Space Startups & Government Agencies – Make informed decisions using real-time performance data
🧑💼 Project Managers & Strategists – Align efforts across engineering, logistics, and operations
🧬 Space Innovation Units – Benchmark progress and communicate performance clearly
🌟 Why This Google Sheets Dashboard Is a Game-Changer
✅ 100% Cloud-Based – Accessible from anywhere
✅ Visual Alerts – Arrows show progress against targets
✅ Fully Customizable – Add your own KPIs and categories
✅ No Software Needed – Built entirely in Google Sheets
✅ Real-Time Updates – See changes instantly
✅ Great for Presentations – Export reports or share as view-only
✅ Designed for Collaboration – Ideal for remote and multi-agency teams
Whether you’re launching satellites or optimizing cost per mission, this dashboard keeps your exploration efforts grounded in data.
🔁 Click here to read the Detailed blog post
Click here to read the Detailed blog post


Reviews
There are no reviews yet.