

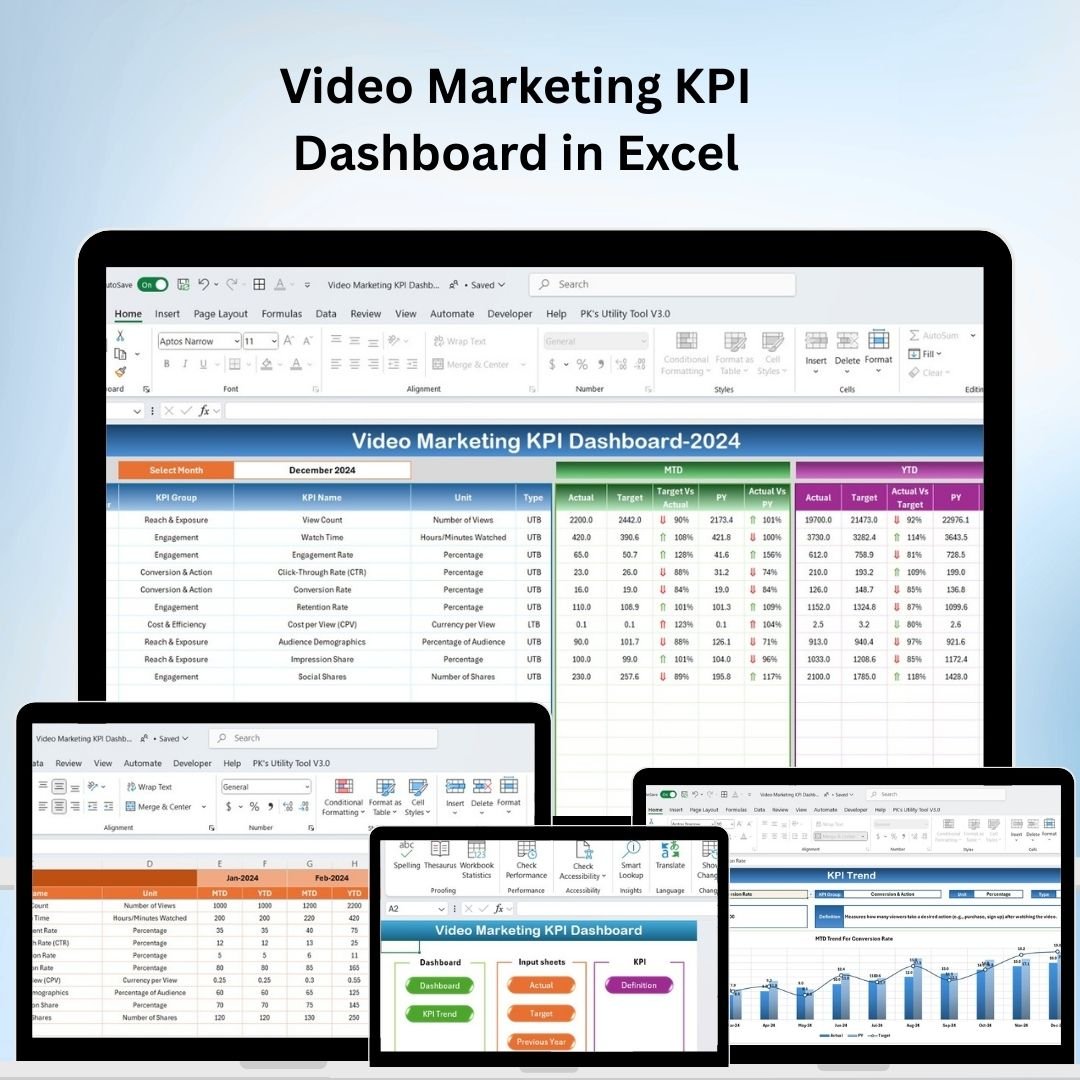
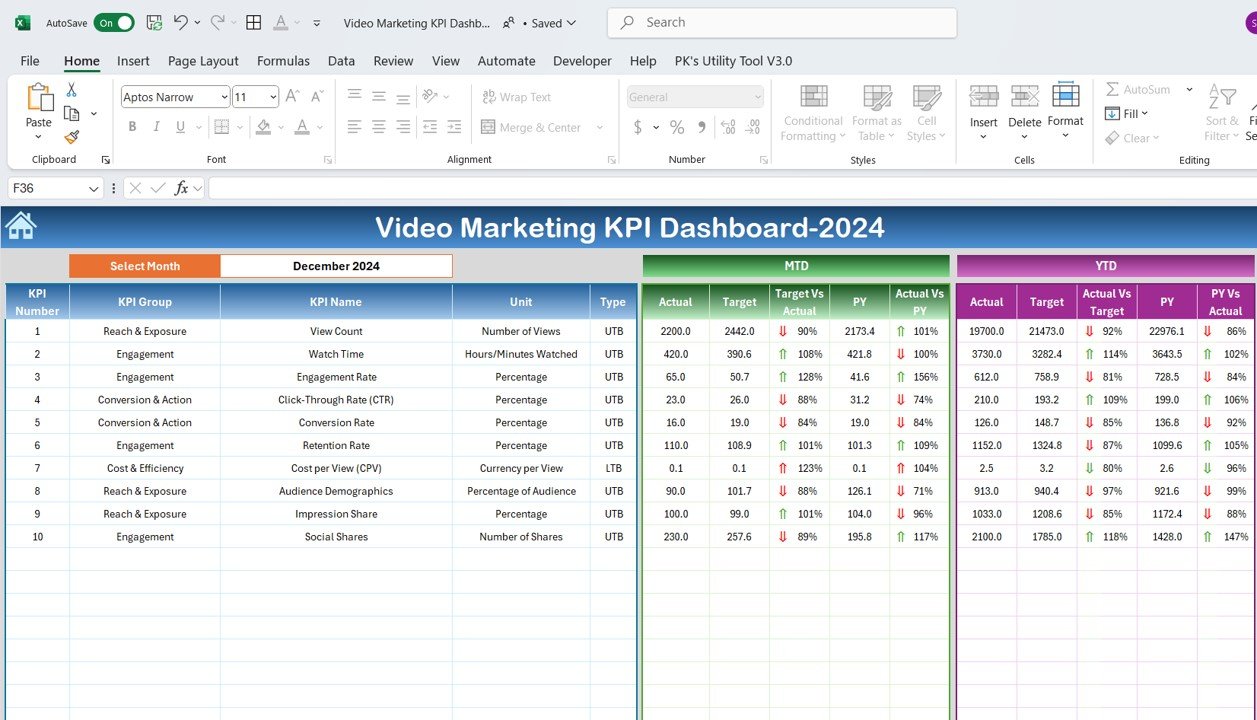
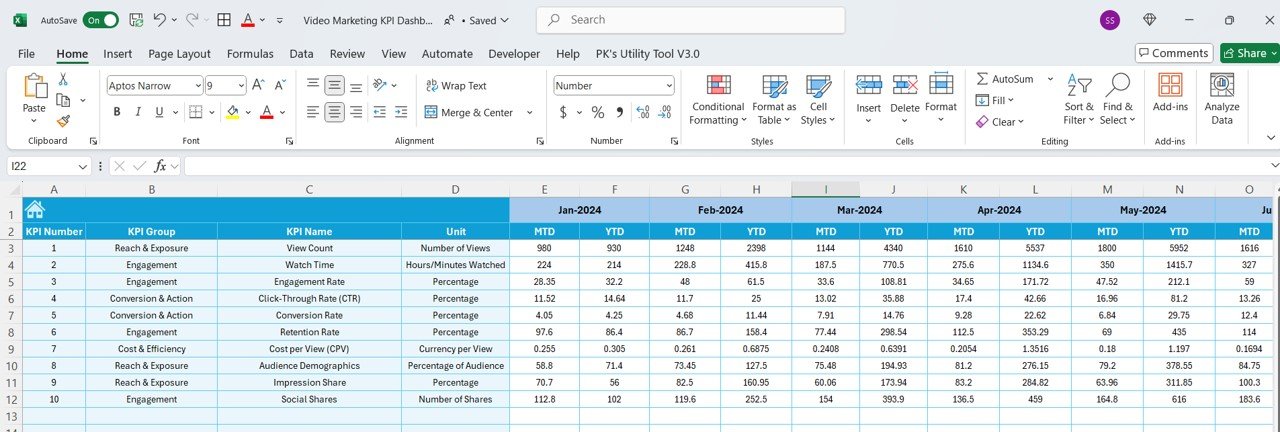
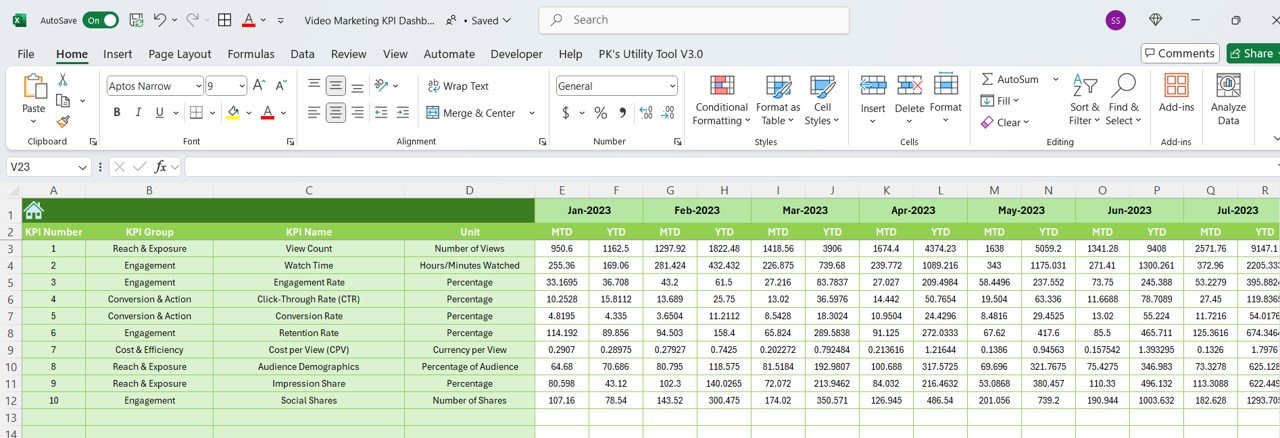
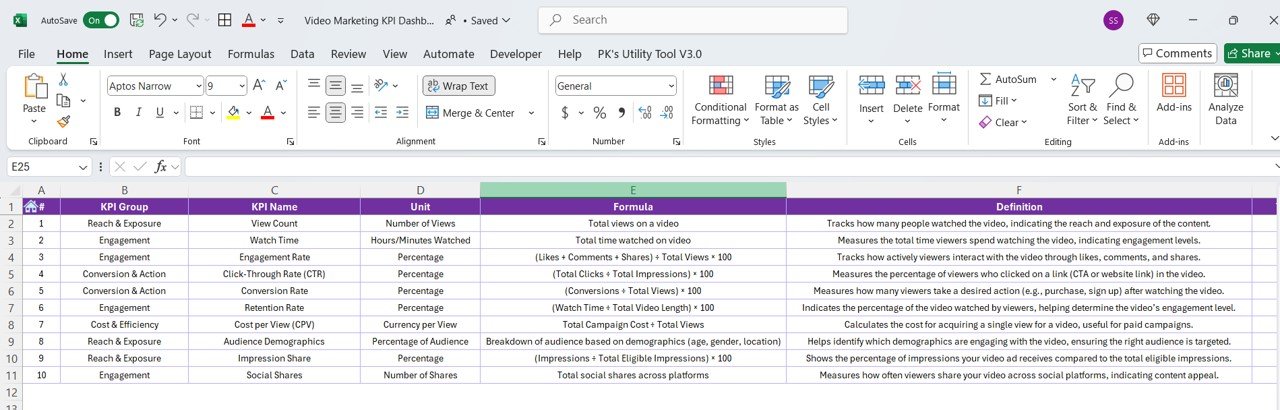

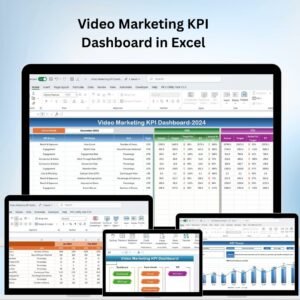
The Video Marketing KPI Dashboard in Excel is an essential tool for marketers, content creators, and businesses to track the performance of video campaigns. Whether you’re promoting products, services, or brand content, this Excel-based dashboard enables you to monitor key metrics, such as views, engagement rates, click-through rates (CTR), conversion rates, and more, to assess the effectiveness of your video marketing strategies.
This dashboard is designed to simplify the complex task of managing video performance, allowing you to analyze the impact of your video content on audience engagement, lead generation, and conversions. With easy-to-understand visuals and real-time data integration, this tool helps you optimize your video marketing efforts and achieve better results.
Key Features of the Video Marketing KPI Dashboard in Excel
📊 Comprehensive KPI Tracking
Track essential video marketing KPIs such as total views, engagement rates, watch time, and subscriber growth. Monitor the performance of each video to understand which content resonates best with your audience.
📈 Click-Through Rate (CTR) Monitoring
Measure the effectiveness of your video content in driving traffic to your website or landing pages. Monitor the click-through rate (CTR) to determine how well your call-to-action (CTA) is performing.
🎯 Conversion Rate Analysis
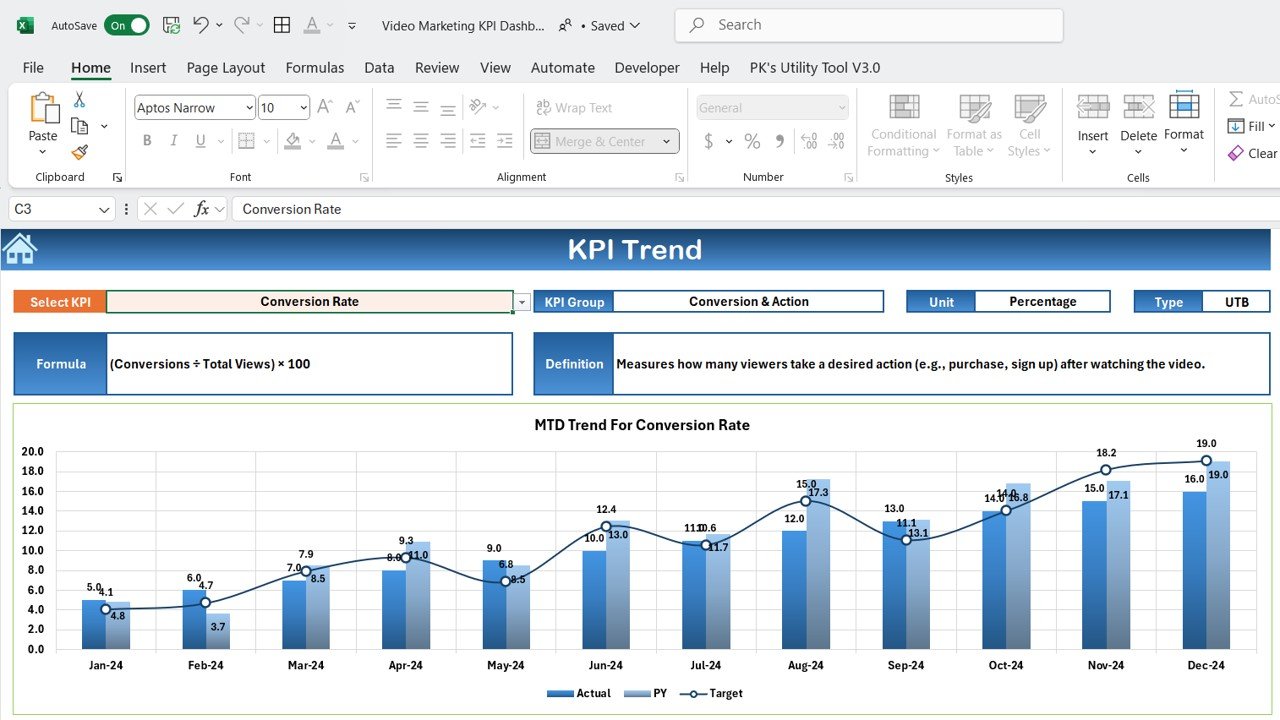
Track the conversion rate for video campaigns. Analyze how many viewers take the desired action, whether it’s signing up for a newsletter, downloading a resource, or making a purchase.
⏱ Time-Based Tracking & Reporting
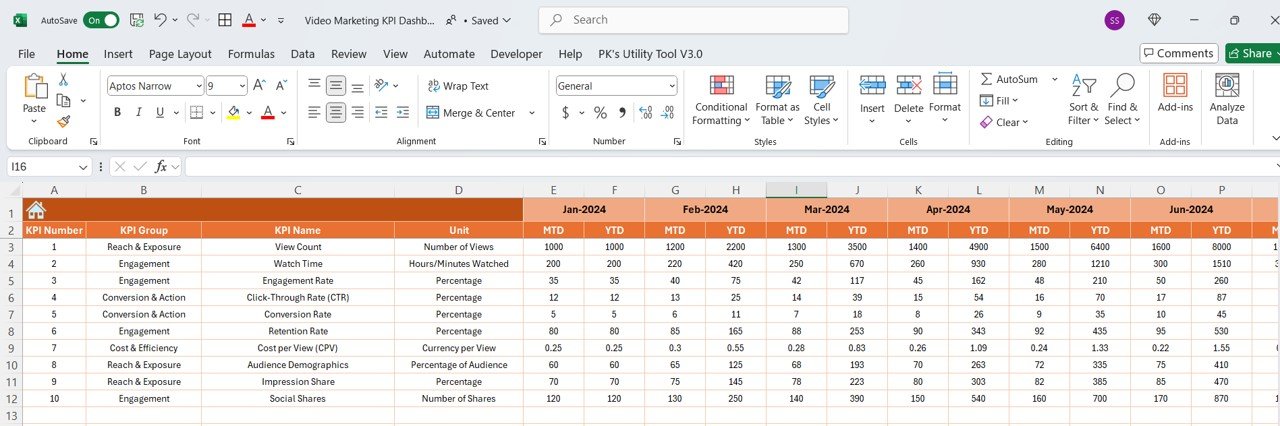
Monitor video performance over time, including daily, weekly, and monthly metrics. Use this feature to identify trends and adjust your content strategy for better results.
📊 Engagement Rate Metrics
Measure likes, shares, comments, and other forms of engagement to determine how well your videos are resonating with your audience.
⚙️ Customizable Dashboard
Tailor the dashboard to your specific video marketing campaigns. Customize the KPIs, metrics, and visuals to reflect your goals and the platforms you’re using, whether YouTube, Facebook, Instagram, or others.
Why You’ll Love the Video Marketing KPI Dashboard in Excel

✅ All-in-One Video Performance Tracking
Track all essential metrics for your video marketing campaigns in one centralized location. Monitor views, engagement, CTR, and conversions for effective decision-making.
✅ Optimize Campaigns for Better Results
Analyze data to optimize your video content and strategies. Identify high-performing videos and replicate successful tactics to improve overall campaign effectiveness.
✅ Increase Audience Engagement
By monitoring engagement metrics such as likes, shares, and comments, you can refine your video content to better connect with your audience and boost interaction.
✅ Boost Conversions & ROI
Measure conversion rates to assess the direct impact of your videos on your business goals. Improve the effectiveness of your CTAs to drive more leads and sales.
✅ Data-Driven Insights
Leverage real-time data to make data-driven decisions and optimize your video marketing efforts. Use historical trends to adjust your approach and maximize results.
What’s Inside the Video Marketing KPI Dashboard in Excel?
Comprehensive KPI Tracking: Monitor views, engagement, CTR, and conversion rates.
Click-Through Rate (CTR): Analyze how well your videos drive traffic.
Conversion Rate Analysis: Track how many viewers take desired actions.
Time-Based Tracking & Reporting: Analyze performance over different time periods.
Engagement Rate Metrics: Measure likes, shares, and comments for audience interaction.
Customizable Dashboard: Tailor the dashboard to fit your video marketing needs.
How to Use the Video Marketing KPI Dashboard in Excel
1️⃣ Download the Template: Instantly access the Video Marketing KPI Dashboard in Excel.
2️⃣ Integrate Your Video Data: Import your video performance data into the dashboard.
3️⃣ Track & Monitor KPIs: Monitor views, engagement, CTR, and conversions for each video.
4️⃣ Analyze Trends: Use time-based analysis to track video performance over various periods.
5️⃣ Optimize Campaigns: Use insights from the dashboard to refine your video marketing strategy and boost results.
Who Can Benefit from the Video Marketing KPI Dashboard in Excel?
🔹 Marketing Teams & Managers
🔹 Content Creators & Video Producers
🔹 Social Media Managers
🔹 Brand Managers & Digital Marketers
🔹 E-commerce & Online Businesses
🔹 Influencers & YouTubers
🔹 Video Advertising Agencies
Ensure your video marketing campaigns are effective and driving results with the Video Marketing KPI Dashboard in Excel. Track key performance metrics, optimize content, and improve your campaign ROI.
Click here to read the Detailed blog post
Visit our YouTube channel to learn step-by-step video tutorials
Youtube.com/@PKAnExcelExpert






























Reviews
There are no reviews yet.