


The Scientific Research KPI Scorecard in Excel turns 12 months of research KPI data into a 4-sheet scorecard with MTD/YTD comparisons, actual vs target values, trend charts, and documented KPI definitions. Instead of paying for per-user analytics software or rebuilding reports every month, research teams can start in under 10 minutes. NextGenTemplates is used by 8,400+ teams in 40+ countries, and this workbook is a one-time purchase with editable Excel sheets, lifetime access, no subscription, and no vendor lock-in.
Key Features of Scientific Research KPI Scorecard in Excel
- 4 worksheet structure – Scorecard, KPI Trend, Input Data, and KPI Definition sheets work together in one Excel file.
- Month, MTD, and YTD views – switch reporting periods quickly from dropdown menus.
- Actual vs target comparison – review every research KPI against planned performance.
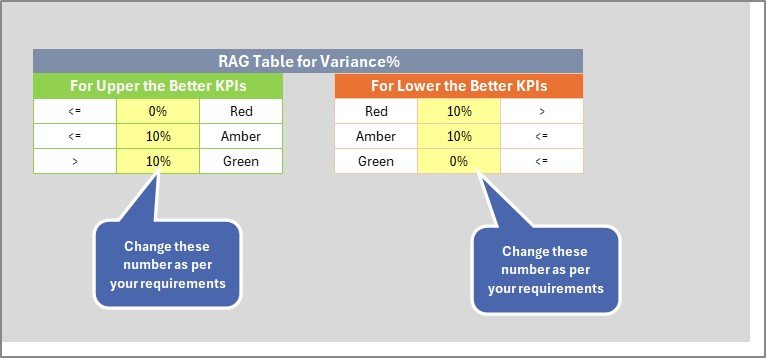
- Color-coded status indicators – identify underperforming KPIs without scanning every number.
- KPI trend charts – compare Actual, Target, and Previous Year values across time.
- KPI definition library – keep formulas, units, KPI type, and definitions documented.
- Editable Excel workbook – change KPI names, groups, formulas, targets, and sample values.
- No macros required – built with standard Excel features for easier adoption.
What’s Inside the Scientific Research KPI Scorecard in Excel
This template has 4 worksheets designed for research labs, universities, R&D departments, innovation teams, grant offices, and research project managers who need a practical monthly KPI review process.
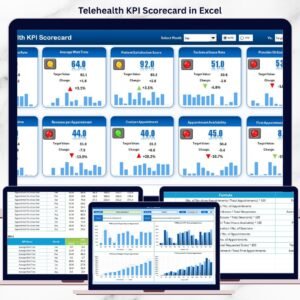
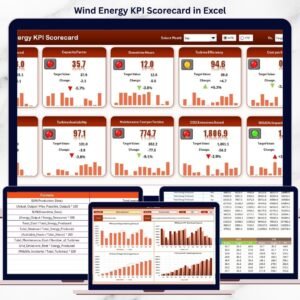
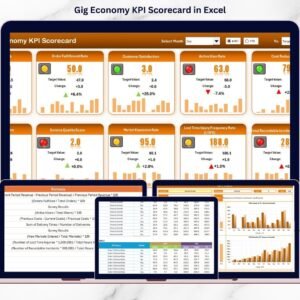
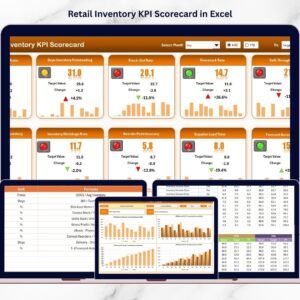
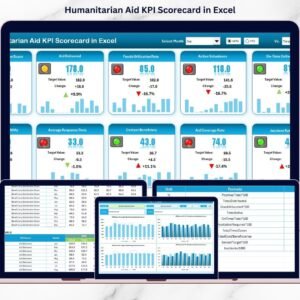
1. Scorecard Sheet
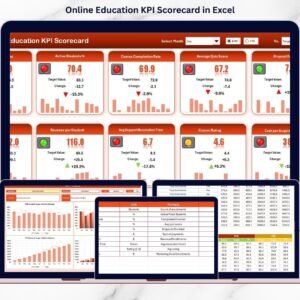
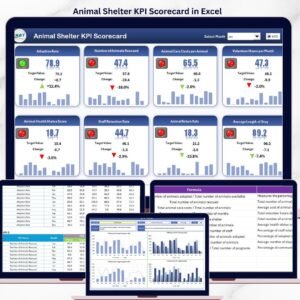
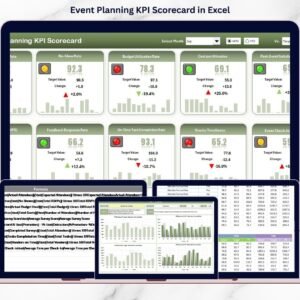
The Scorecard sheet is the main interface where you can view KPI performance. Dropdown menus let you select the month, MTD, or YTD view. Each KPI shows Actual vs Target values, variance context, and visual status indicators. Use it to monitor metrics such as grant utilization, publication output, experiment success rate, research project delay rate, ethics review cycle time, citation growth, and patent filing progress.
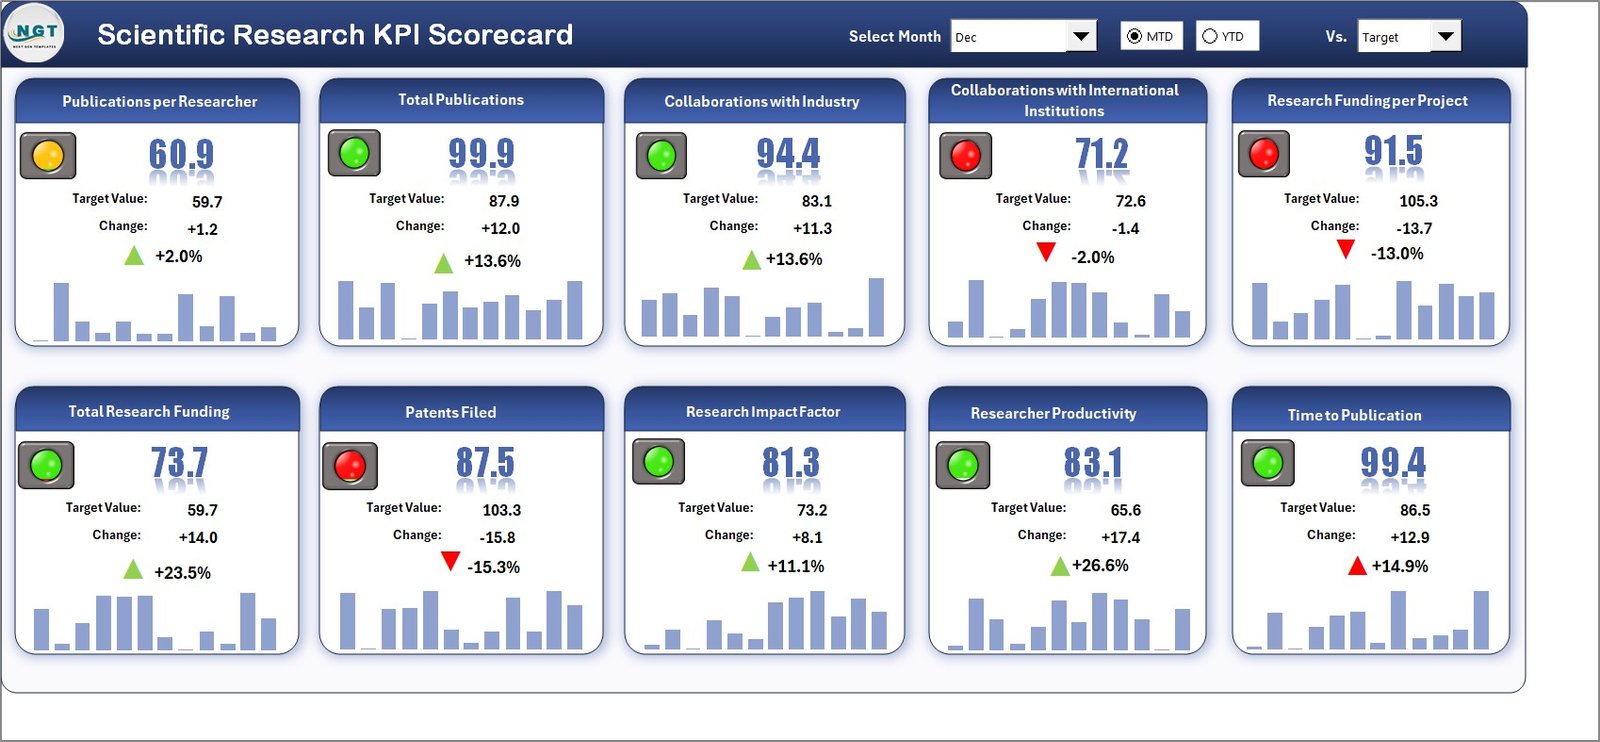
Scientific Research KPI Scorecard in Excel
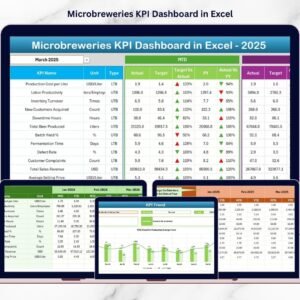
2. KPI Trend Sheet
On the KPI Trend sheet, select a KPI name from the dropdown in cell C3. The sheet displays the KPI Group, Unit, KPI Type, Formula, and Definition. It also shows MTD and YTD trend charts for Actual, Target, and Previous Year numbers, helping research leaders see whether performance is improving, slipping, or becoming inconsistent.
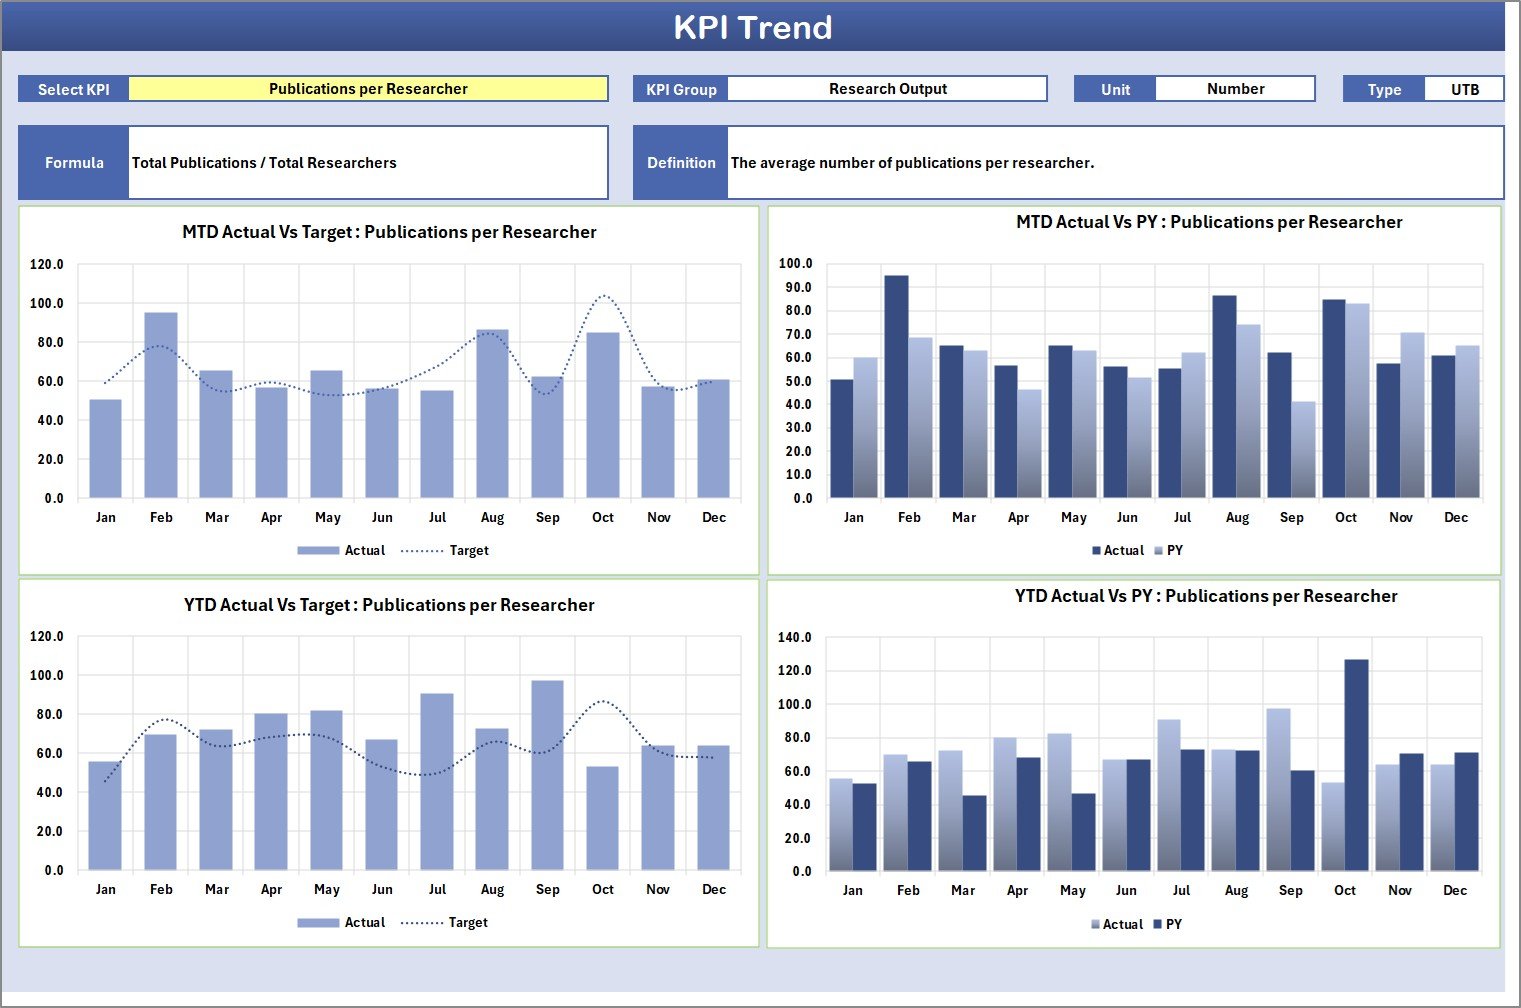
KPI Trend Sheet
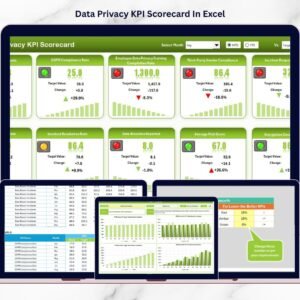
3. Input Data Sheet
The Input Data sheet is where you enter monthly KPI data. Add actual values, target values, and previous-year values as results become available. This keeps the scorecard current without rebuilding the report. It is useful for monthly research reviews, lab performance meetings, grant reporting, and department-level performance tracking.
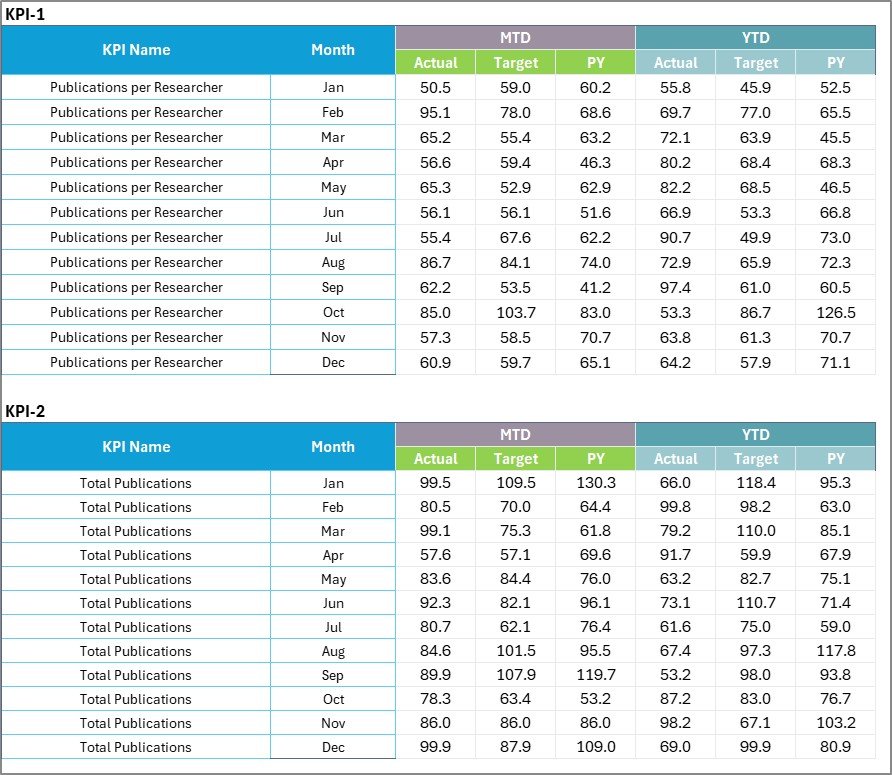
Input Data Sheet
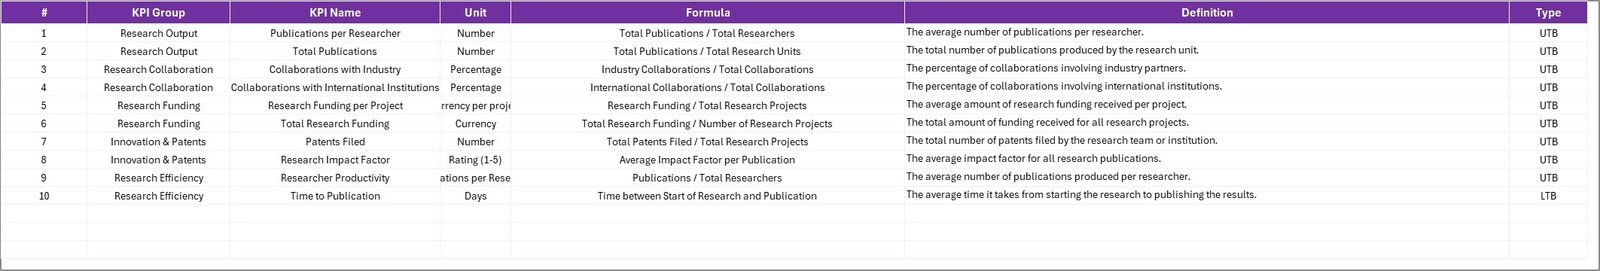
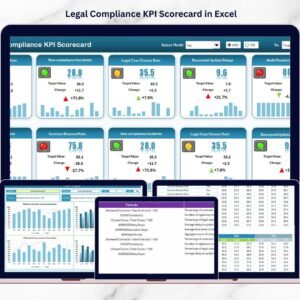
4. KPI Definition Sheet
The KPI Definition sheet stores the KPI Name, KPI Group, Unit, Formula, and KPI Definition. This is important in research environments where stakeholders may interpret metrics differently. A single KPI dictionary keeps reporting consistent across principal investigators, lab managers, grant administrators, and senior leadership.
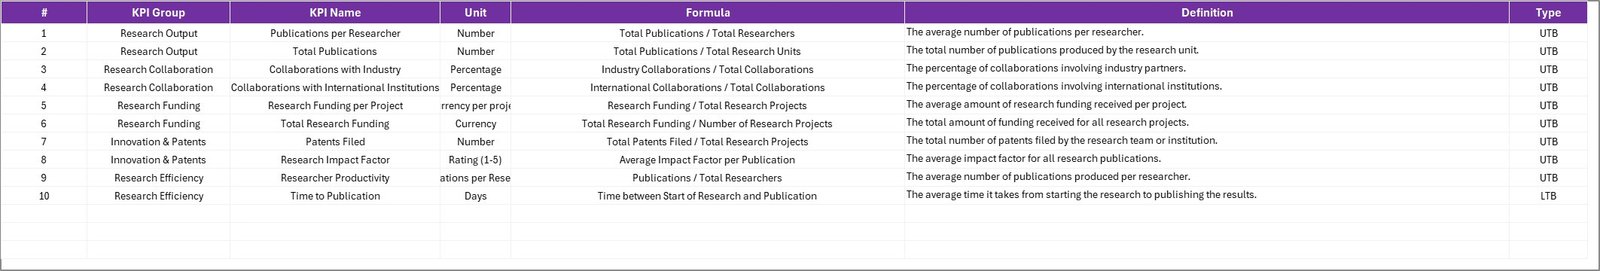
KPI Definition sheet tab
Scientific Research KPI Scorecard additional preview
Scientific Research KPI Scorecard in Excel vs. Google Sheets vs. Paid Research SaaS – Where This Fits
| Feature | This Excel Scorecard | Google Sheets Alternative | Paid Research SaaS |
|---|---|---|---|
| Cost | $12.99 one-time | One-time template or DIY build | Often monthly or annual subscription |
| Platform | Microsoft Excel desktop or Microsoft 365 | Browser-based Google Sheets | Vendor-hosted platform |
| Setup time | Under 10 minutes with sample data | Fast if structure already exists | Usually requires setup and onboarding |
| Offline access | Yes | Limited | No, usually web-only |
| Custom KPI formulas | Fully editable | Editable | Often limited by plan or configuration |
| MTD/YTD KPI trends | Built in | Available in the Sheets version | Available, but tied to subscription |
| Year-1 cost at 5 users | $12.99 total | Template cost only | Can be hundreds or thousands per year |
Who This Template Is For – and Who It’s Not For
This template is for: research directors, lab managers, university departments, scientific program coordinators, grant administrators, R&D teams, and analysts who need a clean KPI review workbook without building one from scratch.
This template is not for: teams needing automated lab instrument integration, role-based enterprise permissions, live database refreshes, or a full research information management system.
How to Use the Scientific Research KPI Scorecard in Excel
- Open the Excel file and review the sample research KPIs.
- Update the KPI Definition sheet with your KPI names, groups, units, formulas, and definitions.
- Enter monthly actuals, targets, and previous-year values in the Input Data sheet.
- Use the Scorecard dropdown menus to select month, MTD, or YTD views.
- Open the KPI Trend sheet to review a single KPI across Actual, Target, and Previous Year values.
- Share the workbook with leadership or save it to OneDrive/SharePoint for review.
Real-World Use Cases
Dr. Meera, a university research director, uses the scorecard to review publication output, grant utilization, project delays, and citation growth during monthly department meetings.
Alex, an R&D operations analyst, tracks experiment success rate, patent filings, lab utilization, and project budget variance for a private research unit.
Jordan, a grant program manager, uses the KPI Definition sheet to standardize formulas across multiple funded projects before preparing quarterly reports.
Frequently Asked Questions
Can I change the KPI names and formulas?
Yes. The KPI Definition sheet is editable, so you can replace the sample research KPIs with your own metrics, formulas, units, and definitions.
Does this workbook use macros?
No. It is designed with standard Excel functionality, so users do not need to enable VBA macros.
Can I track both monthly and yearly research performance?
Yes. The Scorecard sheet supports month, MTD, and YTD analysis, while the KPI Trend sheet displays MTD and YTD charts for the selected KPI.
What types of scientific research KPIs can I track?
You can track publication output, grant utilization, experiment success rate, research project delays, budget variance, lab utilization, patent filings, ethics review cycle time, and any other metric you define.
Is this suitable for universities and private R&D teams?
Yes. The workbook is flexible enough for academic departments, research institutes, labs, scientific nonprofits, and corporate R&D teams.
Can multiple users review the file?
Yes. You can share it through OneDrive, SharePoint, Teams, or another file-sharing workflow used by your organization.
About the Author
Built by PK – Microsoft Certified Professional with 15+ years of Excel, Google Sheets, and Power BI experience. Founder of NextGenTemplates, reaching 300K+ subscribers across YouTube channels. Every template is hand-built and tested before release.
Explore Related Templates
- Scientific Research KPI Dashboard in Excel – use this when you need a broader dashboard view for research performance.
- Scientific Research KPI Dashboard in Google Sheets – a browser-based alternative for collaborative research teams.
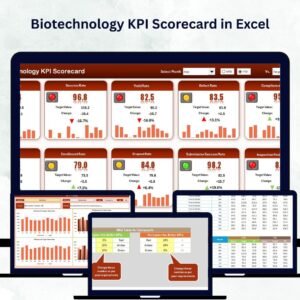
- Biotechnology KPI Scorecard in Excel – useful for life sciences and biotech performance tracking.
- Space Exploration KPI Scorecard in Excel – another research-focused scorecard for mission and engineering KPIs.
Browse more Excel KPI Dashboard Templates and MS Excel Templates on NextGenTemplates.
Ready to monitor research performance with a clean Excel workflow? Add the Scientific Research KPI Scorecard in Excel to your toolkit and turn monthly KPI updates into clear, decision-ready reporting.
Click here to read the detailed blog post.
Last updated: May 2026


Reviews
There are no reviews yet.