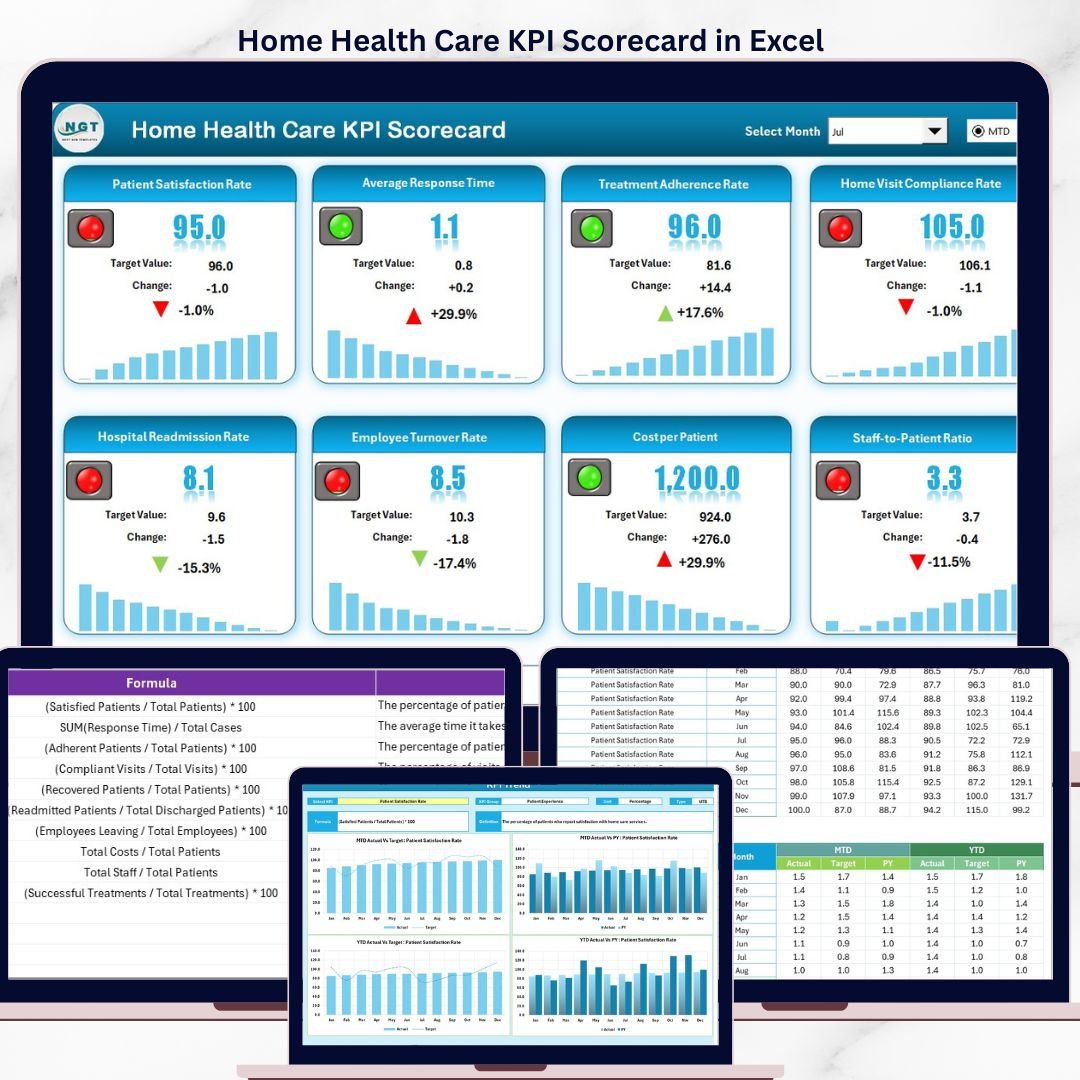

The Home Health Care KPI Scorecard in Excel tracks 10+ patient care and operational KPIs across 4 structured worksheets, with MTD and YTD comparisons, 12-month trend charts, and color-coded conditional formatting. Setup takes under 10 minutes — replace the sample data with your agency’s metrics and every scorecard view updates automatically.
🌍 Join 8,400+ teams in 40+ countries using NextGenTemplates to replace paid SaaS tools with one-time-purchase Excel, Google Sheets, Power BI, and HTML templates.
✅ Instant download · One-time payment of $12.99 · No subscription · No per-user fees · Lifetime access
🔑 Key Features of the Home Health Care KPI Scorecard in Excel
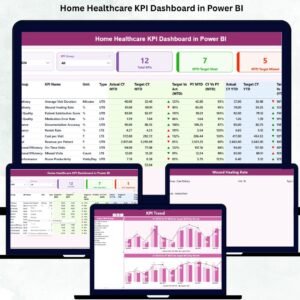
📊 4-worksheet Excel structure – Scorecard, KPI Trend, Input Data, and KPI Definition sheets give home health agency administrators and clinical managers a single workbook to monitor patient outcomes, caregiver productivity, readmission rates, and service delivery efficiency.
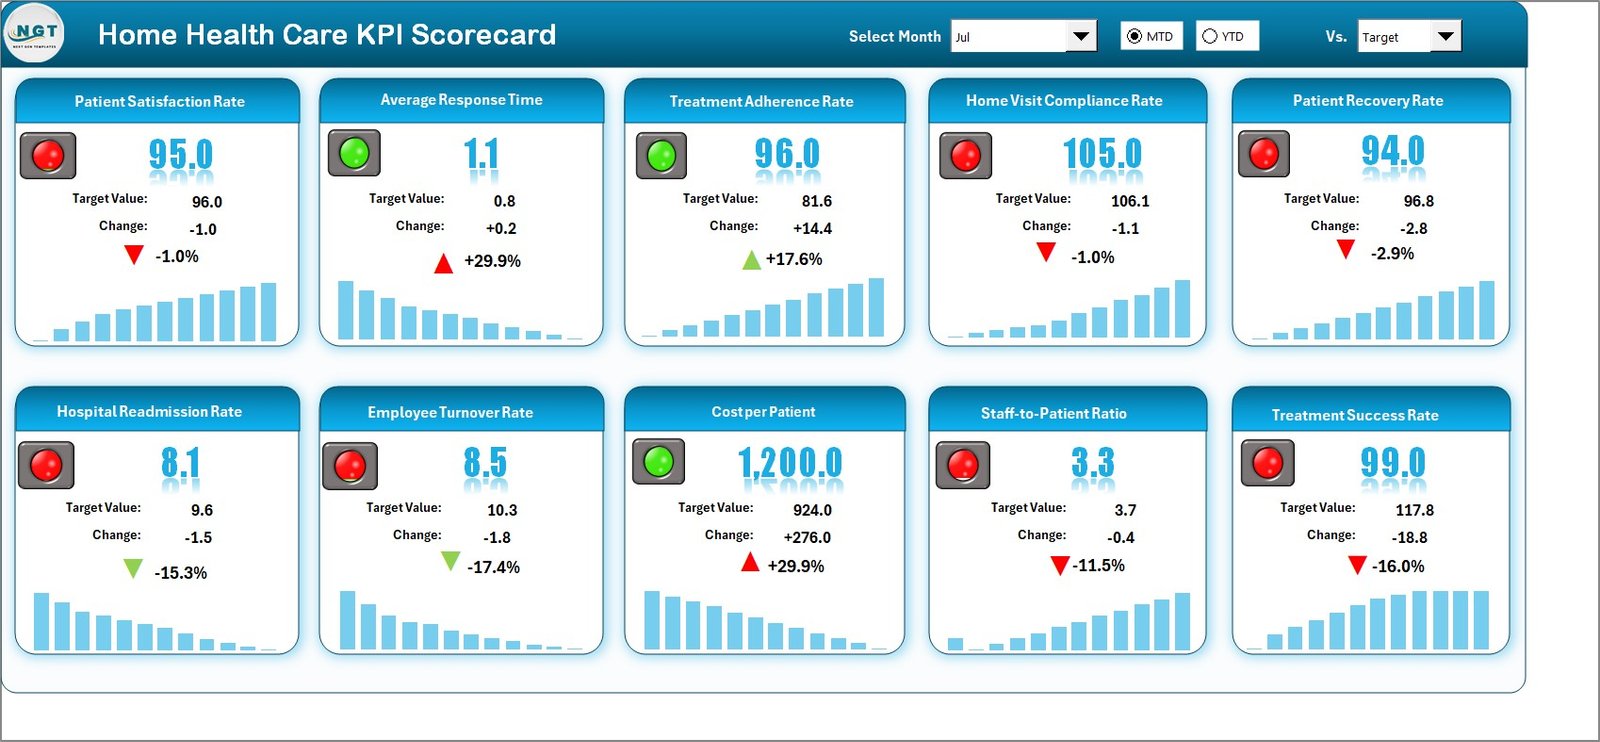
🎯 MTD and YTD performance tracking – Each KPI shows Actual vs Target values for the selected month and year-to-date, plus Previous Year comparison for trend analysis. Select any month from the dropdown and the entire scorecard refreshes instantly.
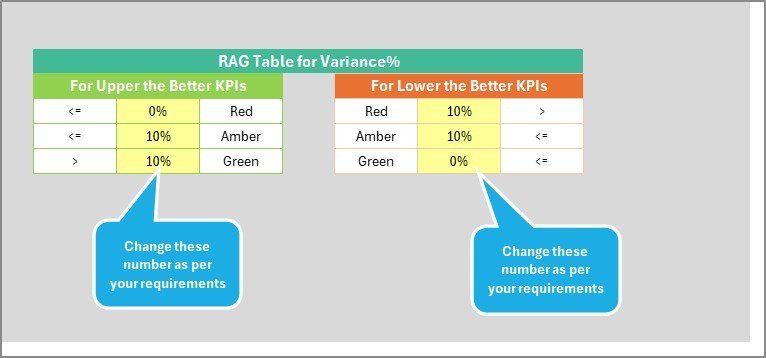
🟢🔴 Color-coded visual indicators – Conditional formatting highlights KPIs meeting targets in green and underperforming metrics in red. The scorecard automatically applies LTB (Lower the Better) and UTB (Upper the Better) logic per KPI type — so metrics like patient fall rate flag red when they increase, while patient satisfaction score flags red when it drops.
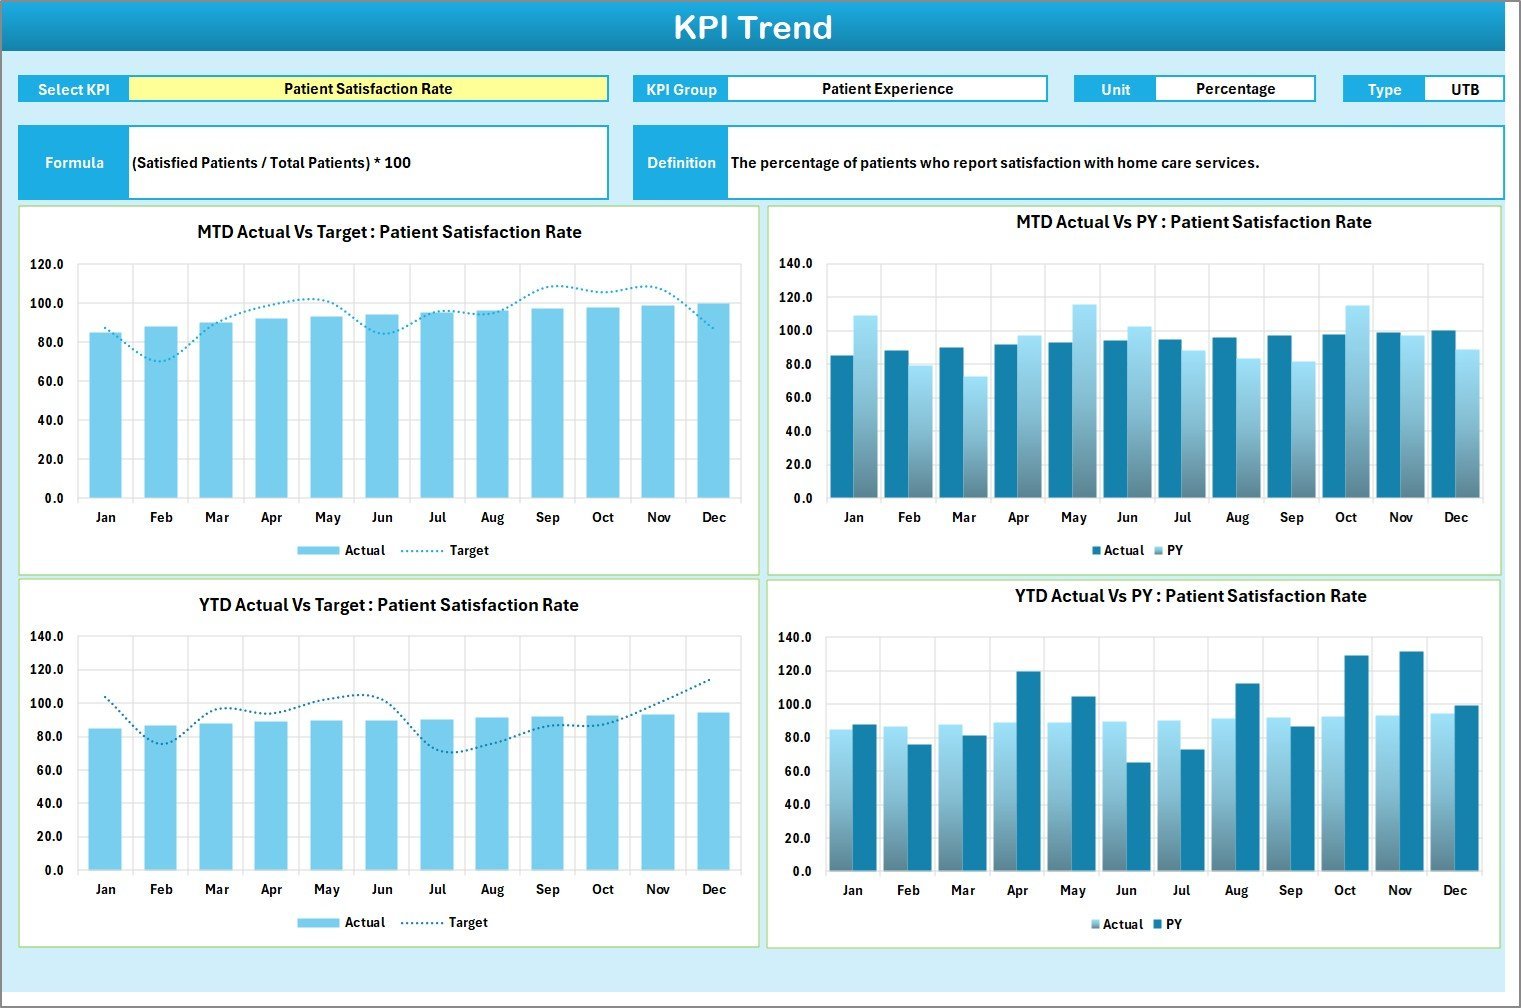
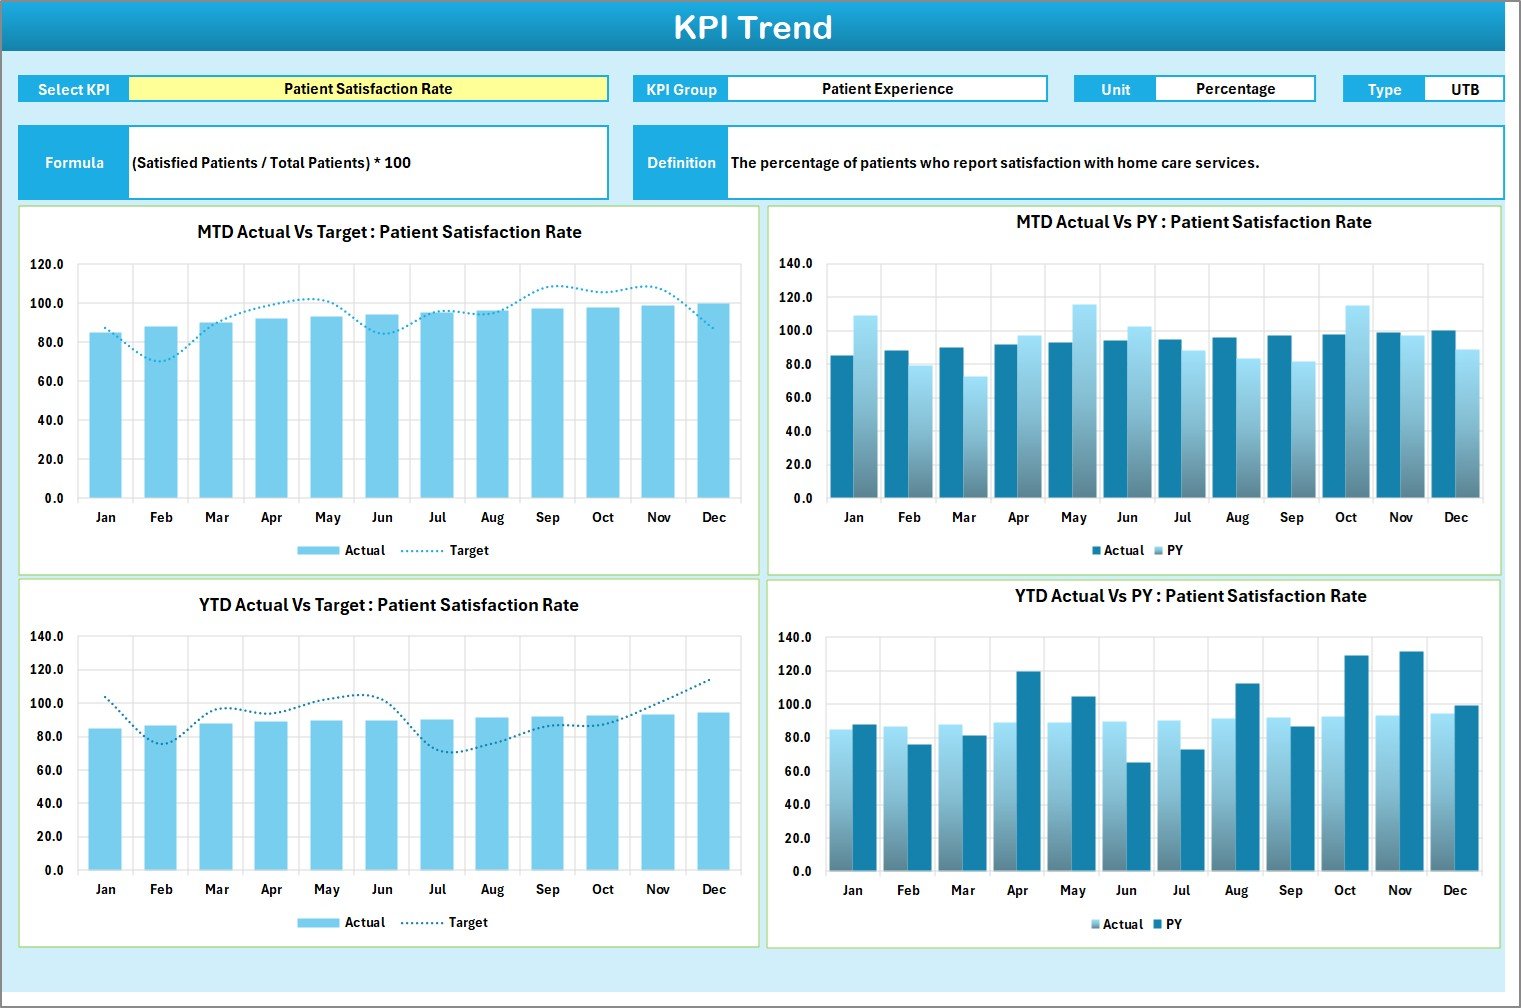
📈 12-month KPI Trend charts – Select any KPI from the dropdown on the KPI Trend sheet to view its MTD and YTD trend lines for Actual, Target, and Previous Year numbers side by side. Spot seasonal patterns, staffing impacts, and areas needing intervention at a glance.
📝 Structured KPI definitions – Every KPI includes its group, unit of measurement, formula, and plain-language definition on the dedicated KPI Definition sheet. New team members understand each metric without external documentation.
🔗 Looking for more healthcare tracking tools? Browse our KPI Dashboard Templates collection or explore the Telehealth Dashboard in Excel for clinical operations monitoring.
📦 What’s Inside the Home Health Care KPI Scorecard
The workbook contains 4 worksheets designed for home health care agencies:
📌 Scorecard Sheet – The main interface displaying all KPIs with dropdown selectors for Month, MTD, and YTD views. Actual vs Target values appear side by side with color-coded status indicators.
 Home Health Care KPI Scorecard in Excel
📌 KPI Trend Sheet – Select any KPI from the dropdown to view its 12-month trend chart showing Actual, Target, and Previous Year lines. Includes KPI Group, Unit, Type (LTB/UTB), Formula, and Definition.
 KPI Trend Sheet
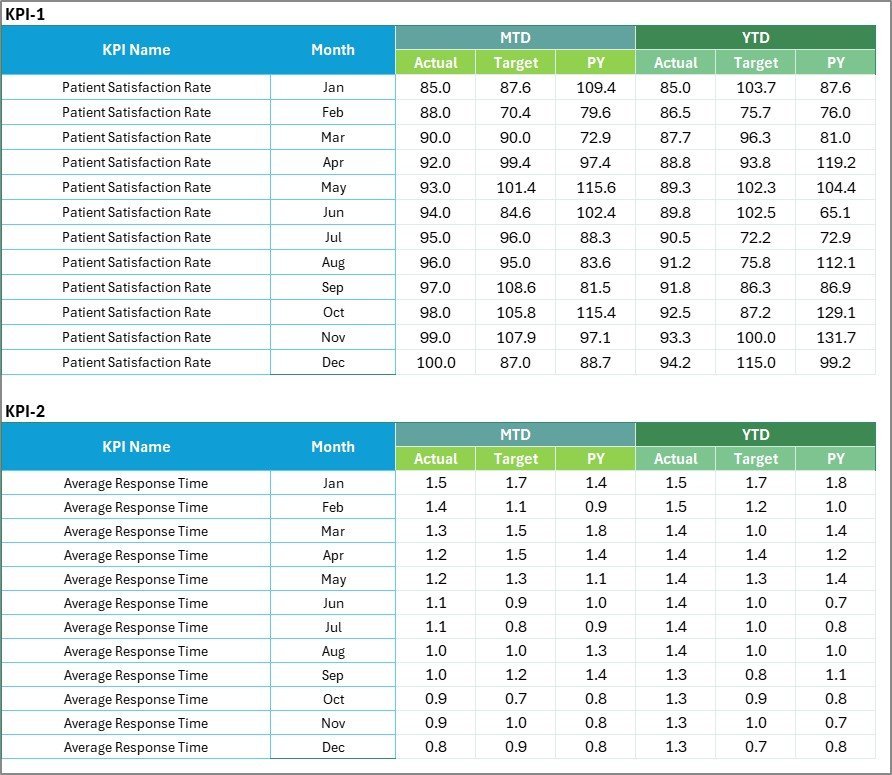
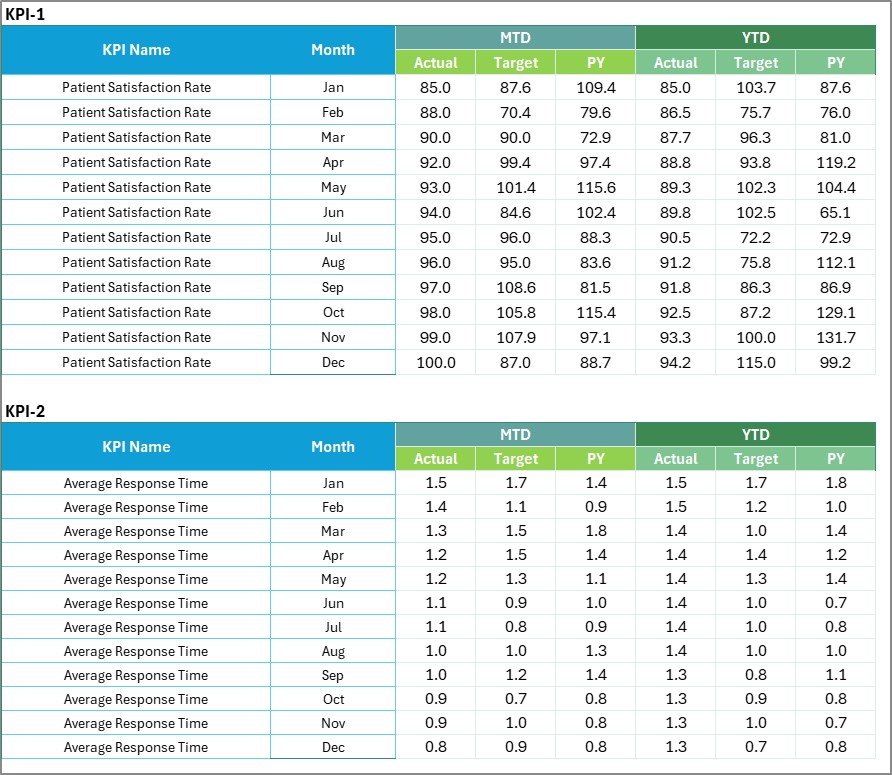
📌 Input Data Sheet – Enter actual values, targets, and previous year figures for each KPI. Data entry is organized by month for easy updating.
 Input Data Sheet
📌 KPI Definition Sheet – Define each KPI with its name, group, unit, formula, and description. This serves as the reference guide for all tracked metrics.
 KPI Definition Sheet
📊 Home Health Care KPI Scorecard vs. Google Sheets vs. Athenahealth — Where This Fits
| Feature | Home Health Care KPI Scorecard in Excel | Google Sheets Equivalent | Athenahealth / Kareo |
|---|---|---|---|
| Cost | $12.99 one-time | Free (build from scratch) | $140-350/provider/month |
| Platform | Microsoft Excel (offline) | Browser-based | Cloud SaaS |
| Setup Time | Under 10 minutes | 8-20 hours (manual build) | 2-6 weeks onboarding |
| Real-Time Team Collaboration | Via OneDrive/SharePoint | Built-in | Built-in |
| Customizable KPIs | Fully editable | Fully editable | Limited to vendor fields |
| Offline Access | Full offline use | Limited offline | No offline mode |
| MTD/YTD Trend Charts | Built-in with dropdowns | Manual chart setup | Preset reports only |
| Year-1 Cost (5 Users) | $12.99 total | $0 (+ build hours) | $8,400-21,000 |
| Data Ownership | 100% yours | Google servers | Vendor-hosted |
For home health agencies that want structured KPI tracking without paying per-provider SaaS fees, the Home Health Care KPI Scorecard in Excel sits in the sweet spot.
👥 Who This Template Is For — and Who It’s Not For
✅ This template is built for:
- Home health agency administrators tracking patient outcomes and caregiver performance across 5-200 staff members
- Clinical directors at home care organizations monitoring readmission rates, patient satisfaction, and visit compliance
- Quality improvement coordinators preparing monthly and quarterly performance reports for accreditation bodies
- Small to mid-size home health agencies that need KPI tracking without investing in enterprise software
❌ This template is NOT for:
- Large hospital systems requiring EHR-integrated dashboards with real-time patient data feeds
- Agencies needing HIPAA-compliant cloud hosting with role-based access controls and audit trails
- Organizations that require automated data import from billing or scheduling systems
⚙️ How to Use the Home Health Care KPI Scorecard
1️⃣ Download and open the Excel file on your computer.
2️⃣ Go to the KPI Definition sheet and review or customize the KPI names, groups, units, formulas, and definitions to match your agency’s metrics.
3️⃣ Enter your data on the Input Data sheet — fill in Actual values, Targets, and Previous Year figures for each month.
4️⃣ Switch to the Scorecard sheet and select the desired month from the dropdown. The entire scorecard refreshes with MTD and YTD comparisons and color-coded indicators.
5️⃣ Use the KPI Trend sheet to select individual KPIs and view their 12-month trend charts for deeper analysis.
💼 Real-World Use Cases
Maria manages a 45-caregiver home health agency in Texas. She uses the Home Health Care KPI Scorecard to track monthly patient readmission rates, caregiver visit compliance, and patient satisfaction scores. Before board meetings, she selects YTD view and prints a one-page summary — no separate report-building needed.
David is a quality director at a home care company serving 3 counties. He uses the KPI Trend sheet to compare fall incident rates across quarters, identifies which months spike, and adjusts caregiver training schedules accordingly. The color-coded indicators flag underperforming metrics before they become compliance issues.
Priya runs a small home nursing service with 12 staff. She replaced a manual Excel tracker that took 2 hours to update monthly. With this scorecard, she enters data in 15 minutes and gets instant MTD/YTD views with trend charts — saving 20+ hours per year on reporting alone.
❓ Frequently Asked Questions
What KPIs does the Home Health Care KPI Scorecard track?
The Home Health Care KPI Scorecard in Excel tracks 10+ key performance indicators including patient readmission rate, caregiver visit compliance, patient satisfaction score, fall incident rate, medication error rate, and average length of stay. All metrics update automatically when you replace sample data.
Can I add or remove KPIs from the scorecard?
Yes. The KPI Definition sheet lets you add, rename, or remove any KPI. Update the corresponding rows in the Input Data sheet and the Scorecard and Trend sheets reflect changes automatically.
How does this compare to Athenahealth for home health tracking?
The Home Health Care KPI Scorecard in Excel costs $12.99 one-time versus Athenahealth at $140-350 per provider per month. For agencies wanting focused KPI tracking without full EHR costs, this Excel scorecard delivers MTD/YTD comparisons and trend charts at a fraction of the price.
How long does setup take?
Setup takes under 10 minutes. Download the file, open in Excel, enter your KPI definitions and data on the Input Data sheet, and the Scorecard and Trend sheets populate automatically with color-coded performance indicators.
Does this work with Google Sheets?
This version is built for Microsoft Excel. For Google Sheets users, check the Public Health KPI Scorecard in Google Sheets or browse our full KPI Dashboard collection.
Is the data I enter stored online?
No. The Home Health Care KPI Scorecard runs entirely in Microsoft Excel on your local machine. Your patient and operational data stays on your computer unless you choose to share the file via OneDrive or SharePoint.
Can multiple team members use this scorecard?
Yes. Share the Excel file via OneDrive or SharePoint for real-time collaboration. Each team member can view the scorecard, and a designated data owner updates the Input Data sheet monthly to keep metrics current.
👤 About the Author
Built by PK — Microsoft Certified Professional with 15+ years of Excel, Google Sheets, and Power BI experience. Founder of NextGenTemplates, reaching 300K+ subscribers across YouTube channels (@PK-AnExcelExpert, @NextGenTemplates, @NeoTechNavigators). Every template is hand-built and tested before release.
🔗 Explore Related Templates
📌 Substance Abuse Center KPI Scorecard in Excel — Track recovery program KPIs with the same scorecard format.
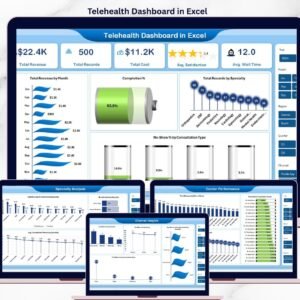
📌 Telehealth Dashboard in Excel — Monitor virtual care metrics across 5 interactive dashboard pages.
📌 Public Health KPI Scorecard in Google Sheets — Same scorecard concept in Google Sheets for browser-based teams.
📌 Hospital Patient Flow Dashboard in Google Sheets — Track patient admissions, discharges, and bed occupancy.
📖 Click here to read the Detailed Blog Post
🎥 Visit our YouTube channel for step-by-step video tutorials
👉 YouTube.com/@NextGenTemplates


Reviews
There are no reviews yet.