



Healthcare tender management is a high-impact and highly regulated process. Hospitals, health departments, and medical institutions manage tenders for medical equipment, pharmaceuticals, IT systems, facility services, and infrastructure projects. Because budgets are tight and compliance requirements are strict, even small inefficiencies in tender handling can lead to financial loss, audit issues, and delayed patient services. However, many healthcare organizations still rely on manual spreadsheets and disconnected reports. As a result, visibility drops and decisions become reactive instead of strategic.
That is exactly where the Health Tender Dashboard in Excel becomes a powerful and practical solution.
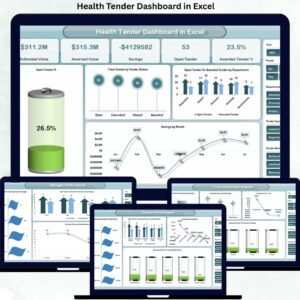
This ready-to-use Excel dashboard converts complex healthcare tender data into clear, visual, and actionable insights. Instead of spending hours compiling reports, procurement teams and leadership gain a centralized view of estimated value, awarded value, savings, tender status, vendor performance, and manager efficiency—all in one interactive Excel file. Because the dashboard is built in Excel, it delivers strong analytical capabilities without the cost or complexity of BI tools.

✨ Key Features of the Health Tender Dashboard in Excel
📊 Centralized Tender Monitoring
Track all healthcare tenders from a single dashboard instead of managing multiple files and reports.
💰 Cost & Savings Visibility
Monitor estimated value vs awarded value and identify savings opportunities across departments and tender types.
🏥 Department-Level Performance Tracking
Analyze how different hospital departments perform in closing and managing tenders.
🤝 Vendor Performance Insights
Evaluate suppliers based on awarded value, success rate, and savings contribution.
🧩 Fully Customizable Excel Model
Easily add new departments, vendors, tender types, or KPIs as per organizational needs.
📦 What’s Inside the Health Tender Dashboard in Excel
🖥️ Overview Sheet Tab – Executive Summary
The Overview sheet works as the command center of the dashboard and provides instant clarity on overall tender performance.
KPI Cards Included
Estimated Value – Total estimated cost of all tenders
Awarded Value – Total value of awarded tenders
Savings – Difference between estimated and awarded value
Open Tender – Number of tenders still open
Awarded Tender % – Tender success rate
These KPI cards help decision-makers quickly understand cost efficiency and tender progress.
Charts in the Overview Sheet
Open Tender % – Tracks pending workload
Total Tender by Tender Status – Open, Awarded, Cancelled, Closed
Open Tender vs Awarded Tender by Department – Department-wise efficiency
Savings by Month – Monthly cost optimization trends
📊 Tender Analysis Section
This section focuses on tender-level performance across categories and statuses.
Charts Included
Awarded Value by Tender Status
Open Tender vs Awarded Tender by Tender Type
Savings by Tender Status
Estimated Value by Tender Status
This analysis helps teams understand which tender types and stages generate the best outcomes.
🏗️ Vendor Performance Analysis
Suppliers directly influence cost, quality, and delivery in healthcare procurement.
Charts Included
Awarded Value by Vendor Name
Open Tender vs Awarded Tender by Vendor Name
Savings by Vendor Name
Awarded Tender % by Vendor Name
These insights support better vendor selection, negotiation, and long-term partnerships.
💰 Cost & Savings Analysis
This section highlights financial efficiency across departments and tender categories.
Charts Included
Estimated Value by Department
Awarded Value by Tender Type
Savings by Tender Type
Awarded Tender % by Tender Manager
It helps finance teams strengthen budgeting and cost control.
👤 Manager Performance Analysis
Tender managers play a critical role in procurement success.
Charts Included
Total Tender by Tender Manager
Open Tender vs Awarded Tender by Tender Manager
Cancelled Tender by Tender Manager
This analysis promotes accountability, training, and performance improvement.
🎯 Who Can Benefit from This Health Tender Dashboard in Excel
🏥 Hospitals & Healthcare Institutions – Improve procurement governance
📦 Procurement Teams – Gain full tender visibility
💼 Finance Teams – Track cost and savings accurately
🧾 Audit & Compliance Teams – Improve transparency
🧠 Senior Management – Enable faster, data-backed decisions
### Click here to read the Detailed blog post
Watch the step-by-step video tutorial:
Visit our YouTube channel to learn step-by-step video tutorials — Youtube.com/@PKAnExcelExpert
Compatibility and Requirements
- Works in Microsoft Excel desktop (Excel 2016 or later, or Microsoft 365).
- The dashboard is built from charts and KPI cards. Microsoft explains how to build charts in Create a chart from start to finish.
Frequently Asked Questions
Which KPIs does the Overview sheet show?
Five KPI cards: Estimated Value, Awarded Value, Savings, Open Tender and Awarded Tender %.
How are savings calculated?
Savings is the difference between the estimated value and the awarded value of the tenders.
Can I see how each vendor performs?
Yes. The Vendor Performance Analysis section charts awarded value, open vs awarded tenders, savings and awarded tender % by vendor name.
Can I compare tender managers?
Yes. Charts show total tenders, open vs awarded tenders and cancelled tenders by tender manager.
Is there a Power BI version?
Yes. See the Health Tender Dashboard in Power BI.
Related Health Tender and Healthcare Templates
- Health Tender Dashboard in Power BI: the same tender dashboard in Power BI
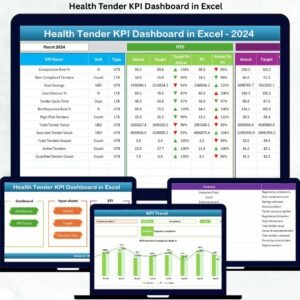
- Health Tender KPI Dashboard in Excel: a KPI-focused view of health tenders
- Healthcare Dashboard in Excel: a wider healthcare overview
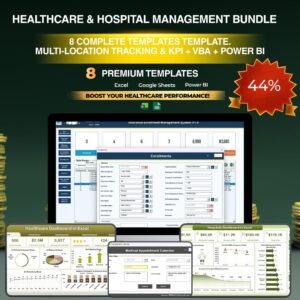
- Healthcare & Hospital Management Bundle: 8 templates for hospital teams in one download
Browse all Excel dashboards.












Reviews
There are no reviews yet.