



Healthcare organizations manage a wide range of complex projects every year. These projects include hospital expansions, medical equipment installations, IT system upgrades, compliance initiatives, digital transformation programs, and patient service improvements. Because budgets are limited and timelines are critical, healthcare project teams must monitor cost, progress, and performance continuously. However, when project data remains scattered across spreadsheets and manual reports, visibility drops and risks increase.
That is exactly why the Health Project Management Dashboard in Excel becomes a powerful and practical solution.
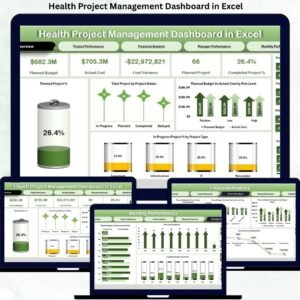
This ready-to-use Excel dashboard converts raw healthcare project data into clear, visual, and actionable insights. Instead of manually reviewing multiple files, healthcare leaders can track budgets, control costs, monitor progress, and evaluate performance from one centralized dashboard. Moreover, because it is built entirely in Excel, it delivers strong project analytics without the need for expensive project management software.
✨ Key Features of the Health Project Management Dashboard in Excel
📊 Centralized Project Visibility
Track all healthcare projects—planned, in progress, and completed—from a single Excel dashboard.
💰 Budget & Cost Control
Compare planned budgets against actual costs and identify overruns early.
⚠️ Risk-Aware Monitoring
Understand how risk levels impact cost, progress, and project delivery.
👤 Manager Performance Tracking
Evaluate project managers based on delivery efficiency and cost discipline.
📈 Monthly Trend Analysis
Monitor how project performance evolves over time to support forecasting.
📦 What’s Inside the Health Project Management Dashboard in Excel
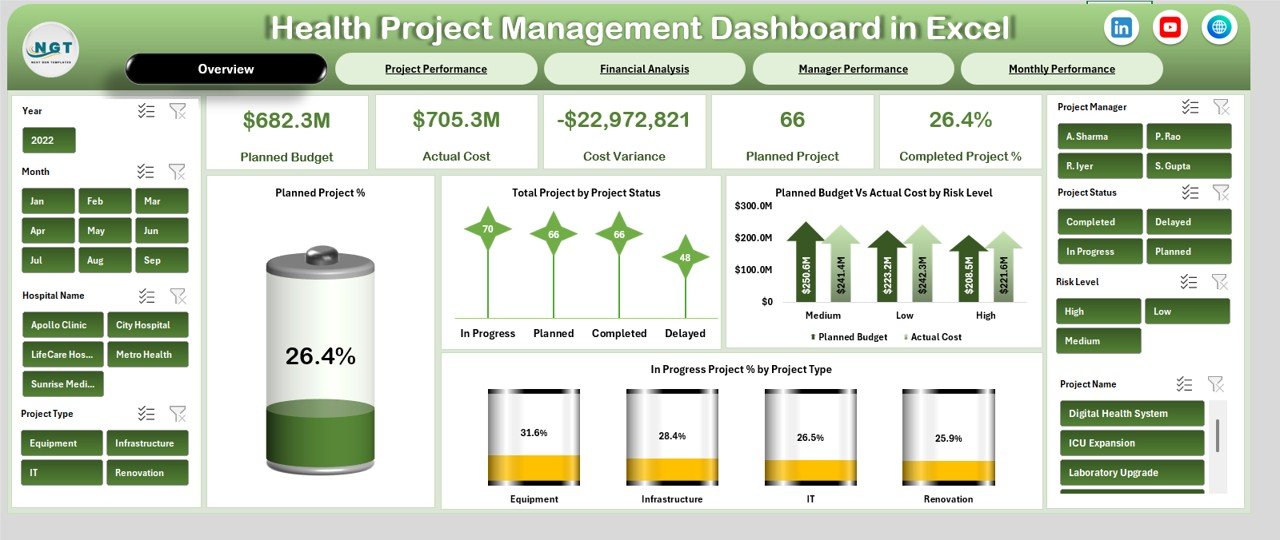
🖥️ Overview Sheet Tab – Executive Summary
The Overview sheet provides instant clarity for senior leadership.
KPI Cards Included
Planned Budget – Total approved budget for all projects
Actual Cost – Total cost incurred to date
Cost Variance – Difference between budget and actual cost
Planned Projects – Total number of approved projects
Completed Project % – Percentage of successfully completed projects
Key Overview Charts
Planned Project %
Total Projects by Project Status
Planned Budget vs Actual Cost by Risk Level
In-Progress Project % by Project Type
This sheet enables executives to assess project health in seconds.
🏗️ Project Performance Analysis
This section focuses on operational project insights.
Charts Included
Total Projects by Project Type
Cost Variance by Project Type
In-Progress Project % by Project Name
Planned Budget vs Actual Cost by Project Name
Project teams use this view to prioritize corrective actions and resource allocation.
💰 Financial Analysis – Budget & Cost Oversight
Healthcare projects demand strict financial discipline.
Charts Included
Planned Budget vs Actual Cost by Hospital Name
Planned Budget vs Actual Cost by Project Type
Planned Budget vs Actual Cost by Project Status
Cost Variance by Project Name
This section supports finance teams during audits, reviews, and budget planning.
👤 Manager Performance Analysis
Leadership accountability drives project success.
Charts Included
Planned Budget vs Actual Cost by Project Manager
In-Progress Project % by Project Manager
Completed vs Planned Projects by Manager
Cost Variance by Project Manager
This analysis helps identify top performers and improvement areas.
📈 Monthly Performance & Trend Analysis
Understanding trends is critical for long-term planning.
Charts Included
Planned Budget vs Actual Cost by Month
Total Projects by Month
Completed Project % by Month
Monthly trends help healthcare organizations anticipate risks and adjust strategies proactively.
🎯 Who Can Benefit from This Dashboard
🏥 Hospitals & Healthcare Groups
📋 Project Management Offices (PMO)
💼 Finance & Budget Teams
🧠 Healthcare Administrators & Executives
🧾 Compliance & Audit Teams
Click here to Read Detailed blog post
Watch the step-by-step video tutorial:
📺 Visit our YouTube channel to learn step-by-step video tutorials
👉 https://youtube.com/@PKAnExcelExpert
Compatibility and Requirements
- Works in Microsoft Excel desktop (Excel 2016 or later, or Microsoft 365).
- The dashboard is built with charts and KPI cards. Microsoft explains how charts work in Create a chart from start to finish.
Frequently Asked Questions
Which KPIs does the Overview sheet show?
Five KPI cards: Planned Budget, Actual Cost, Cost Variance, Planned Projects and Completed Project %.
Can I compare budget and actual cost for each hospital?
Yes. The Financial Analysis section has a Planned Budget vs Actual Cost chart by Hospital Name. It has the same comparison by Project Type, Project Status and Cost Variance by Project Name.
Does it show how each project manager is doing?
Yes. The Manager Performance Analysis section charts Planned Budget vs Actual Cost, In-Progress Project %, Completed vs Planned Projects and Cost Variance by Project Manager.
Can I see monthly trends?
Yes. The monthly section shows Planned Budget vs Actual Cost by Month, Total Projects by Month and Completed Project % by Month.
Is there a Power BI version?
Yes. See the Health Project Management Dashboard in Power BI. There is also a Health Project Management KPI Dashboard in Excel.
Related Healthcare and Project Templates
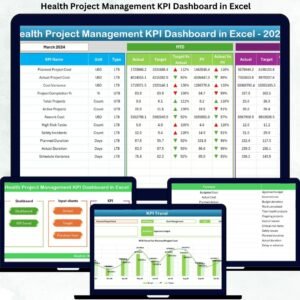
- Health Project Management KPI Dashboard in Excel: a KPI-focused view of healthcare projects
- Health Project Management Dashboard in Power BI: the same topic in Power BI
- Healthcare Project Timeline KPI Dashboard in Excel: tracks project timelines
- Healthcare Project Calendar in Excel: a calendar for healthcare projects
- Healthcare Dashboard in Excel: a wider healthcare overview
Browse all Excel dashboards.










Reviews
There are no reviews yet.