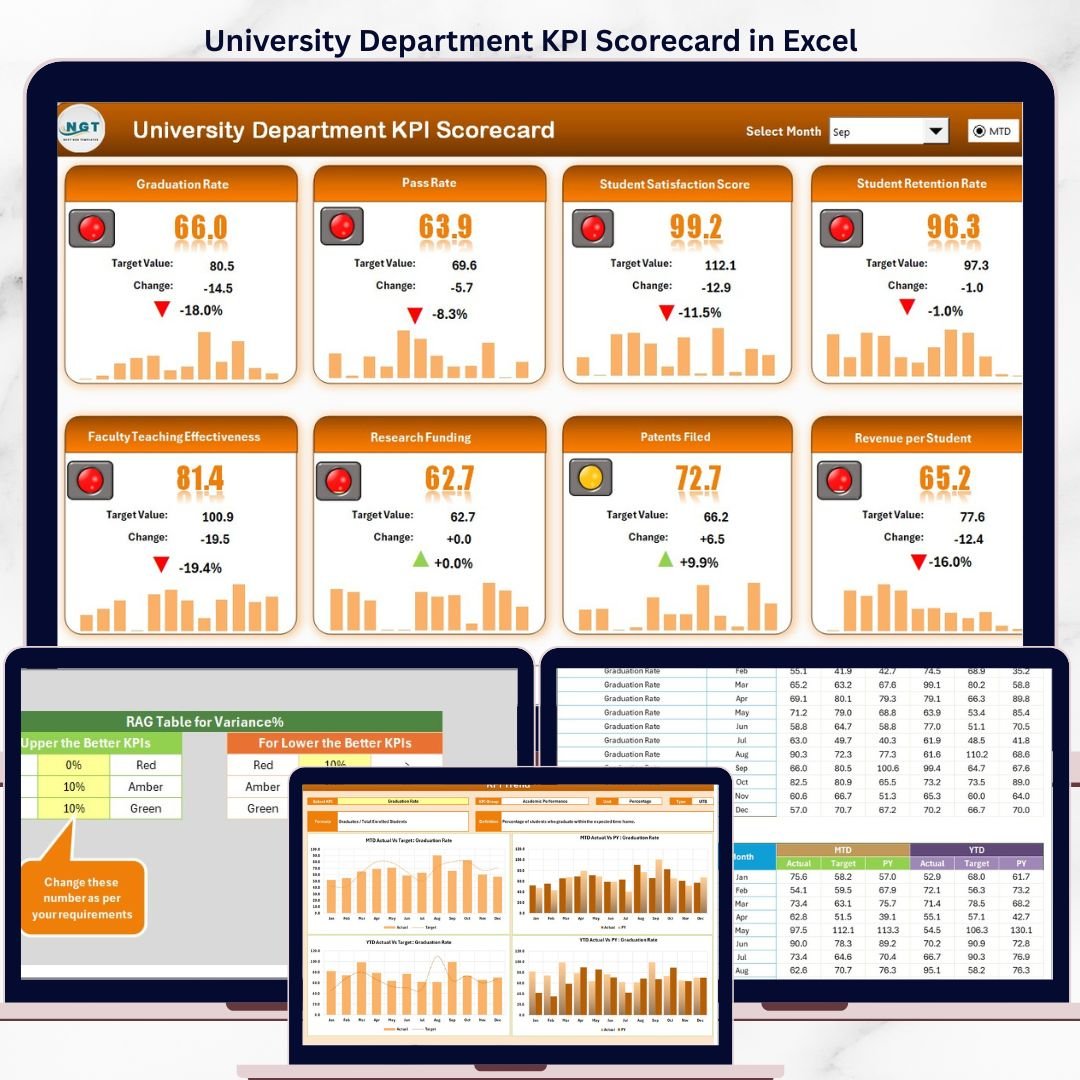


The University Department KPI Scorecard in Excel tracks academic performance across 4 structured worksheets — Scorecard, KPI Trend, Input Data, and KPI Definition — with dropdown-driven MTD and YTD views, Actual vs. Target comparisons, and color-coded visual indicators for every department KPI. Setup takes under 10 minutes: enter your KPI definitions once, add monthly data, and every chart and scorecard row updates automatically.
🌍 Join 8,400+ teams in 40+ countries using NextGenTemplates Excel Dashboard Templates to replace paid SaaS tools with one-time-purchase Excel, Google Sheets, and Power BI templates.
✅ Instant download · One-time payment · No subscription · No per-user fees · Lifetime access
🔑 Key Features of University Department KPI Scorecard in Excel
📊 4 organized worksheets in one workbook — The University Department KPI Scorecard in Excel consolidates Scorecard, KPI Trend, Input Data, and KPI Definition sheets into a single file. Every sheet draws from the same dataset, so a single Input Data update propagates across every chart, indicator, and trend analysis view without manual rework.
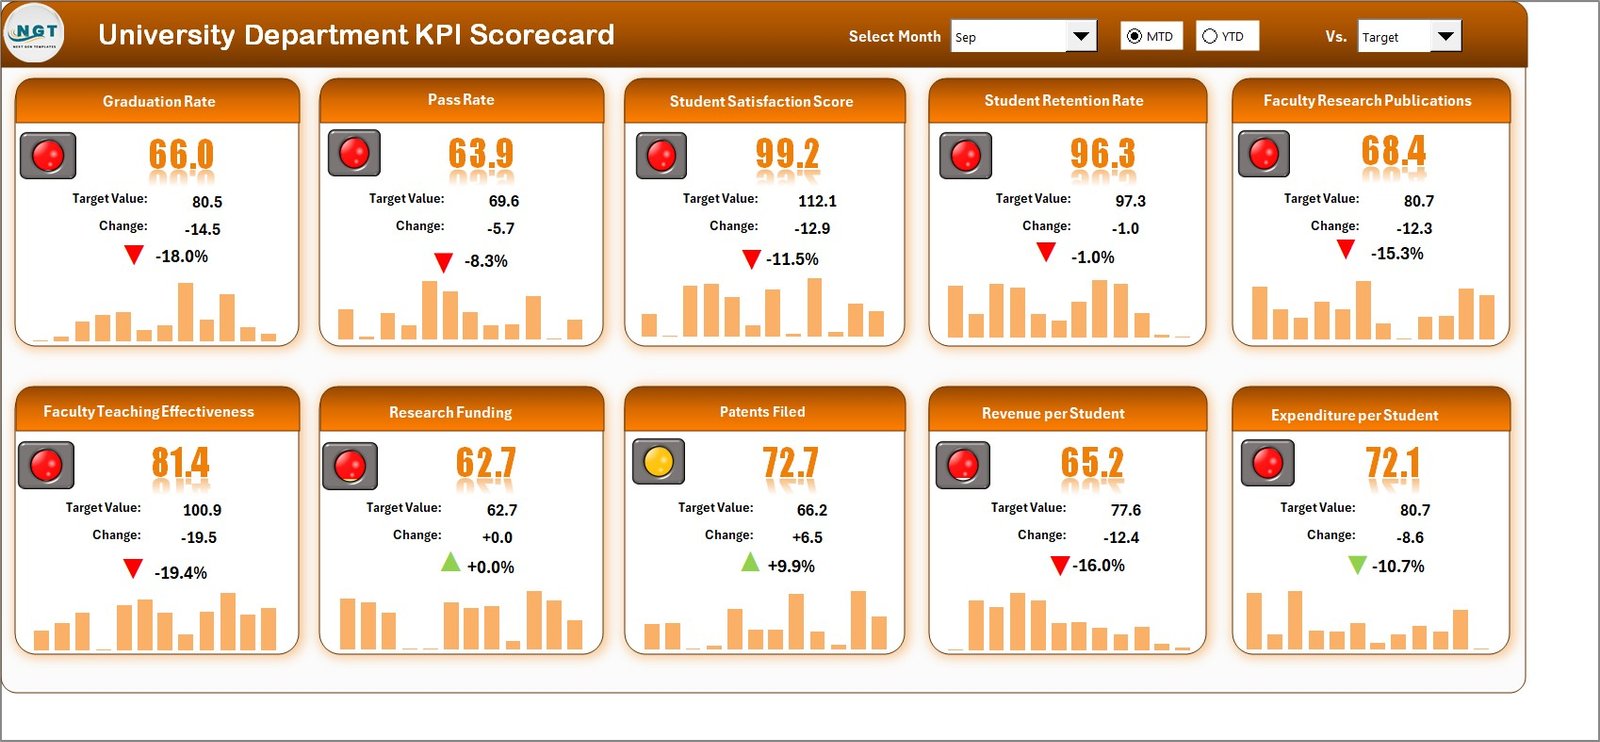
🎯 Dropdown-driven performance view — Select any month from the Scorecard sheet dropdown and the entire view refreshes instantly for MTD or YTD analysis. This scorecard tracks performance across all university department KPIs — including enrollment rate, course completion, faculty research output, student satisfaction, and budget utilization — with no formula editing required.
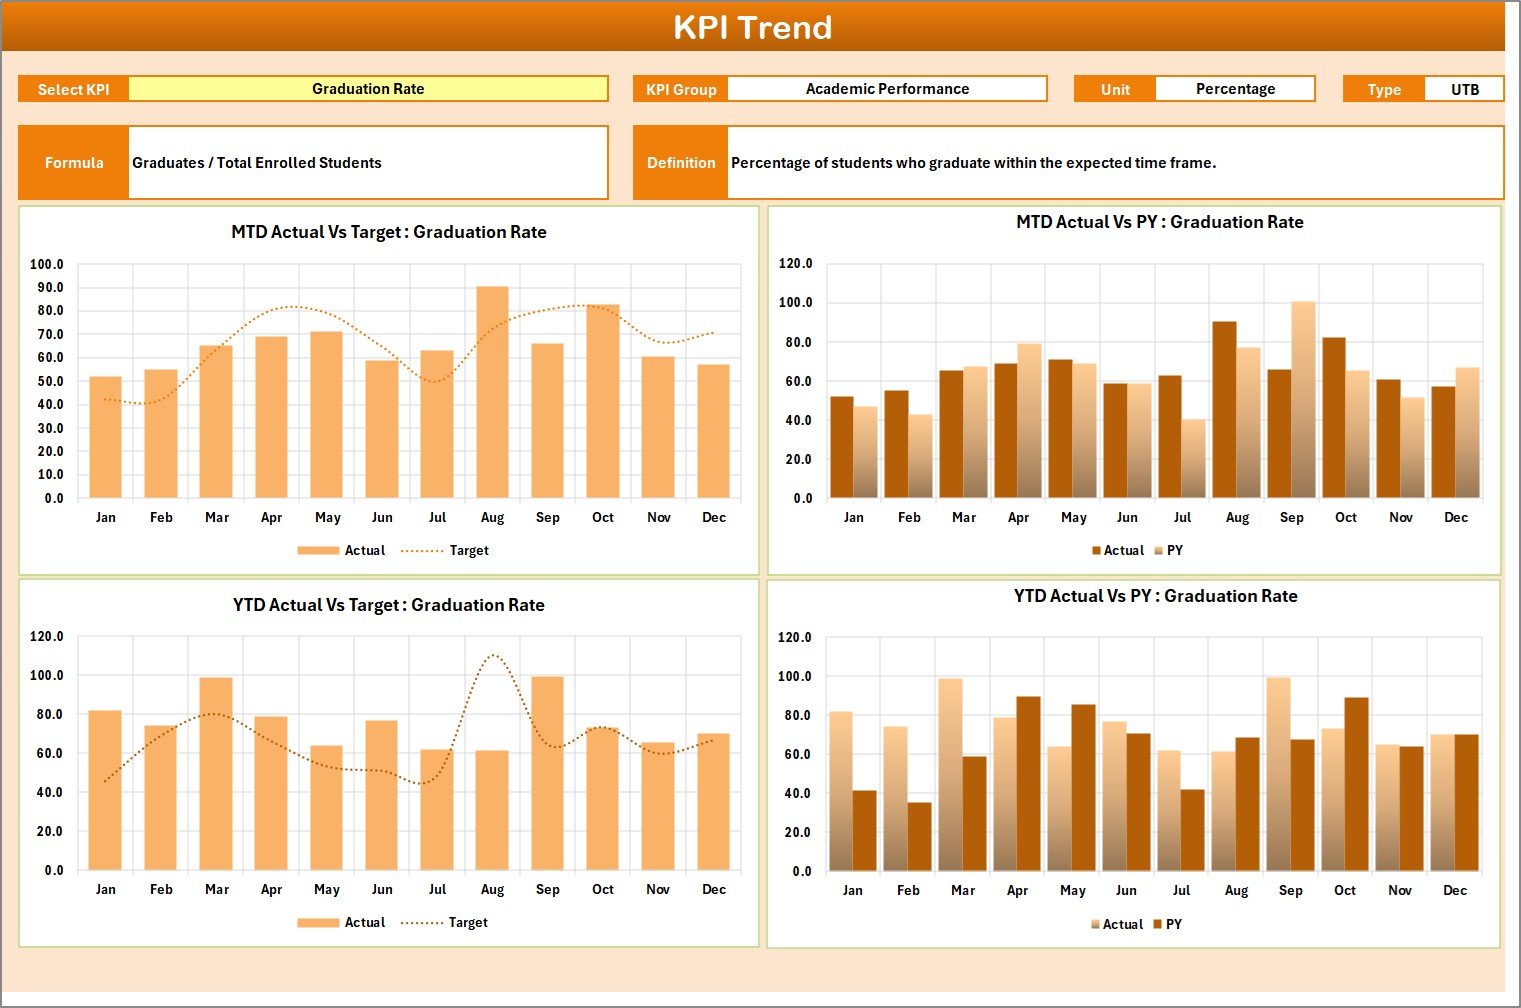
📈 Individual KPI trend analysis — The KPI Trend sheet lets you select any single KPI from the dropdown on cell C3. The sheet displays the KPI Group, Unit, Type (Lower the Better or Upper the Better), Formula, and Definition, alongside MTD and YTD trend charts comparing Actual, Target, and Previous Year figures across all months.
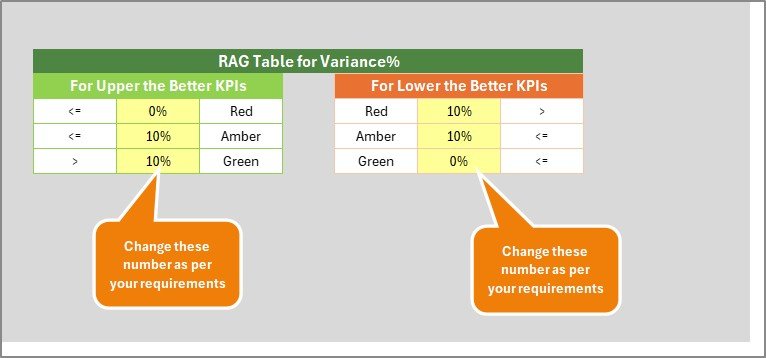
🟢 Color-coded visual indicators — Every KPI on the Scorecard sheet is flagged with conditional formatting so department heads and academic managers can instantly identify which metrics are on track, approaching thresholds, or underperforming — without reading numbers row by row.
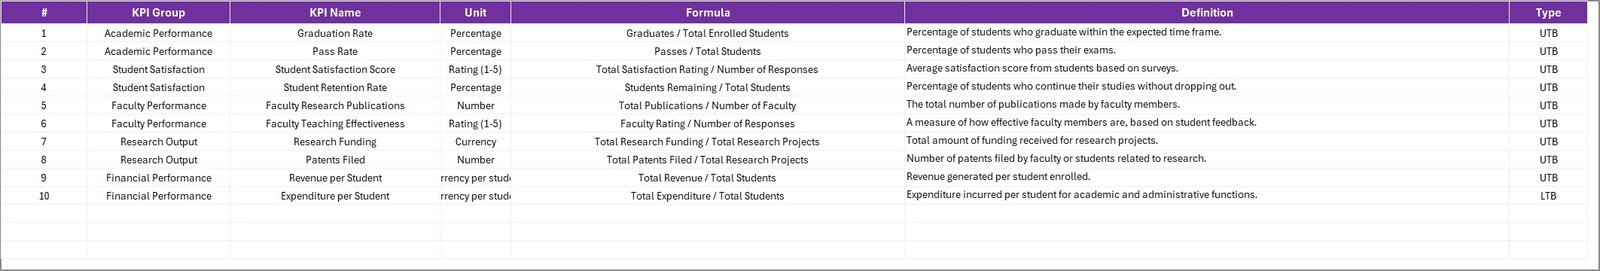
📋 Structured KPI knowledge base — The KPI Definition sheet serves as a single reference for all stakeholders. Enter the KPI Name, KPI Group, Unit, Formula, and Definition once. This ensures consistent interpretation of metrics across department chairs, deans, and institutional research teams.
🔧 No VBA, no macros, no add-ins — Built entirely on native Excel formulas, conditional formatting, and data validation. Compatible with Microsoft Excel 2016, Excel 2019, Excel 2021, Microsoft 365 (Windows and Mac), and Excel Online for read-only review.
📦 What’s Inside the University Department KPI Scorecard in Excel
University Department KPI Scorecard in Excel — Scorecard Sheet
1. Scorecard Sheet — The main performance view. Select the month, choose MTD or YTD, and the sheet displays all university department KPIs with Actual vs. Target values and color-coded visual indicators. Gives department heads, registrars, and deans a single-page overview for monthly or quarterly reviews.
KPI Trend Sheet
2. KPI Trend Sheet — Select any individual KPI from the dropdown on cell C3 to view its Group, Unit, Type (LTB or UTB), Formula, and Definition. MTD and YTD trend charts display Actual, Target, and Previous Year figures side by side across all months — ideal for spotting seasonal dips or consistent underperformance.
Input Data Sheet
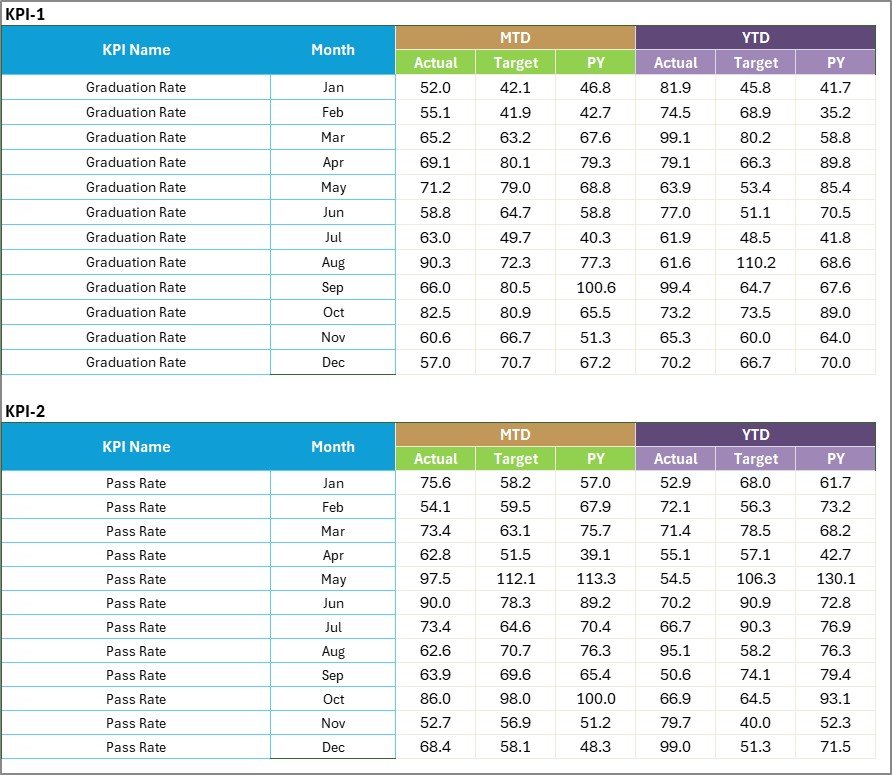
3. Input Data Sheet — The single source of truth for all KPI data. Record actual values, targets, and historical figures for each metric. Update this sheet monthly and every Scorecard and Trend view refreshes automatically, keeping your academic department reporting current without rebuilding formulas.

KPI Definition Sheet
4. KPI Definition Sheet — Enter the KPI Name, KPI Group, Unit, Formula, and Definition for each metric. Acts as a permanent reference guide so all stakeholders — from faculty leads to institutional research officers — understand exactly what each university department KPI measures and how it is calculated.
University Department KPI Scorecard in Excel — Full Overview
📊 University Department KPI Scorecard in Excel vs. Google Sheets Scorecard vs. Paid Higher-Ed Analytics SaaS — Where This Fits
| Feature | University Department KPI Scorecard in Excel | Google Sheets Scorecard | Paid Higher-Ed SaaS (e.g., Tableau, Qualtrics) |
|---|---|---|---|
| Cost | $12.99 one-time | Free (DIY build) | $500–$5,000 / year |
| Platform | Excel 2016+, Microsoft 365, Mac | Google Sheets (browser) | Cloud SaaS, requires IT setup |
| Setup time | Under 10 minutes | 1–3 days to build from scratch | Weeks to months onboarding |
| Real-time collaboration | Via OneDrive / SharePoint | ✅ Native | ✅ Built-in |
| Offline access | ✅ Full offline | ❌ Requires internet | ❌ Web-only |
| MTD/YTD trend charts | ✅ Built-in per KPI | ❌ Build manually | ✅ Configurable |
| Customizable KPIs | ✅ Unlimited | ✅ Manual setup | Limited to plan tier |
| Year-1 cost at 5 users | $12.99 total | $0 + dev time | $2,500–$25,000+ |
| No IT integration needed | ✅ Yes | ✅ Yes | ❌ Often required |
For university departments that want structured KPI tracking with trend charts and color-coded indicators — without paying enterprise analytics pricing — the University Department KPI Scorecard in Excel sits in the sweet spot.
👥 Who This Template Is For — and Who It’s Not For
✅ This template is built for:
- Department chairs and academic managers at colleges and universities tracking 10–30 department KPIs monthly
- Institutional research officers preparing MTD and YTD performance reports for deans and provosts
- Accreditation coordinators needing documented KPI trend data for compliance reviews
- Faculty leads monitoring student outcomes, course completion, and research output against annual targets
- Higher education consultants delivering performance scorecards to multiple client institutions
❌ This template is NOT for:
- University IT teams needing a live dashboard with ERP or SIS data integration (use Tableau or Power BI with live connectors)
- Institutions requiring multi-user role-based access control, SSO, and audit logging (use enterprise SaaS)
- Teams that need real-time dashboards updated automatically from student information systems
⚙️ How to Use the University Department KPI Scorecard in Excel
- Open the file in Microsoft Excel 2016 or later.
- Go to the KPI Definition sheet and enter your KPI names, groups, units, formulas, and definitions.
- On the Input Data sheet, enter actual values, targets, and previous year data for each KPI and month.
- Open the Scorecard sheet, select the month from the dropdown, and choose MTD or YTD view.
- Review color-coded performance indicators for each university department KPI at a glance.
- Switch to the KPI Trend sheet, select any individual KPI, and analyze its MTD/YTD trend charts vs. target and previous year.
- Update the Input Data sheet monthly — every other sheet refreshes automatically.
💼 Real-World Use Cases
Dr. Anita heads the Business Department at a mid-sized university. She uses the University Department KPI Scorecard in Excel to track 16 KPIs — including enrollment rate, course pass rate, faculty publication count, and student satisfaction scores — against monthly targets. Each quarter she presents the Scorecard sheet to the dean, switching to the KPI Trend sheet to walk through any metrics that dipped below target. Total reporting time: 45 minutes monthly, replaced from a day-long manual process.
Marcus manages institutional research at a community college. He uses the KPI Definition sheet to standardize metric definitions across five departments, then collects monthly data from department heads into the Input Data sheet. The YTD trend charts let him identify departments consistently missing completion rate targets, so the provost can allocate academic support resources earlier in the semester.
Priya is an accreditation coordinator at a technical university. The KPI Definition sheet’s formula and definition columns give her a ready-made evidence portfolio for accreditation visits — reviewers can verify exactly how each KPI is defined and calculated, with three years of trend data available from the Trend charts.
❓ Frequently Asked Questions
What KPIs does the University Department KPI Scorecard in Excel track?
The University Department KPI Scorecard in Excel tracks any academic KPIs you define — common examples include student enrollment rate, course completion rate, faculty research publications, student satisfaction score, faculty-to-student ratio, grant revenue, graduate employment rate, and budget utilization. All KPIs are fully customizable from the KPI Definition sheet.
How long does setup take?
Setup takes under 10 minutes. Enter your KPI definitions in the KPI Definition sheet, add your monthly actual and target data in the Input Data sheet, and the Scorecard and KPI Trend sheets update automatically. The file ships with sample data so you can see every feature working before replacing it with your institution’s numbers.
Does the University Department KPI Scorecard in Excel use macros or VBA?
No. The University Department KPI Scorecard in Excel is built entirely on native Excel formulas, conditional formatting, and data validation — no VBA, no macros, no add-ins. The file opens cleanly on managed university laptops where macros are blocked by IT policy, and works with Excel 2016 through Microsoft 365.
Can I customize the KPIs to match my department’s specific metrics?
Yes. The KPI Definition sheet accepts unlimited custom KPIs. Add or rename KPIs, set their group, unit, and formula, and specify whether each is Lower the Better (LTB) or Upper the Better (UTB). The Scorecard and Trend sheets automatically incorporate your updated KPI list.
How does this compare to paid higher-education analytics platforms?
The University Department KPI Scorecard in Excel costs $12.99 one-time. Platforms like Tableau and Qualtrics charge $500–$5,000+ per year and require IT integration and onboarding. For departments needing structured MTD/YTD tracking and trend charts without IT dependency, this template delivers 80% of the functionality at under 1% of the annual cost.
Which Excel versions are supported?
The University Department KPI Scorecard in Excel works with Microsoft Excel 2016, 2019, 2021, Microsoft 365 on Windows and Mac, and Excel Online for read-only review. All conditional formatting, dropdown menus, and trend charts are fully compatible across these versions.
Can multiple team members use the same scorecard?
Yes. Save the file to OneDrive or SharePoint and multiple users can access and edit simultaneously at no extra per-user cost. There are no seat limits — share the University Department KPI Scorecard in Excel with your entire department or institutional research team.
👤 About the Author
Built by PK — Microsoft Certified Professional with 15+ years of Excel, Google Sheets, and Power BI experience. Founder of NextGenTemplates, reaching 300K+ subscribers across YouTube channels (@PK-AnExcelExpert, @NextGenTemplates, @NeoTechNavigators). Every template is hand-built and tested before release.
🔗 Explore Related Templates
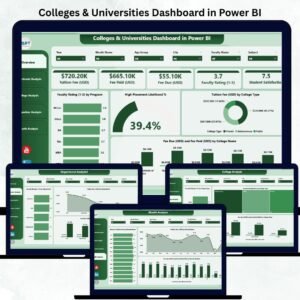
- Open Universities KPI Dashboard in Excel — Full 7-page KPI dashboard for higher-education institutions with detailed trend analysis, target vs. actual, and previous year comparisons.
- Online Universities KPI Dashboard in Excel — Track enrollment, graduation rates, and e-learning performance for online university programs.
- Vocational Training KPI Scorecard in Excel — Same scorecard structure adapted for vocational and trade training programs.
- Browse all KPI Dashboard Templates on NextGenTemplates.
📖 Click here to read the Detailed Blog Post
🎥 Visit our YouTube channel for step-by-step video tutorials
👉 YouTube.com/@NextGenTemplates


Reviews
There are no reviews yet.