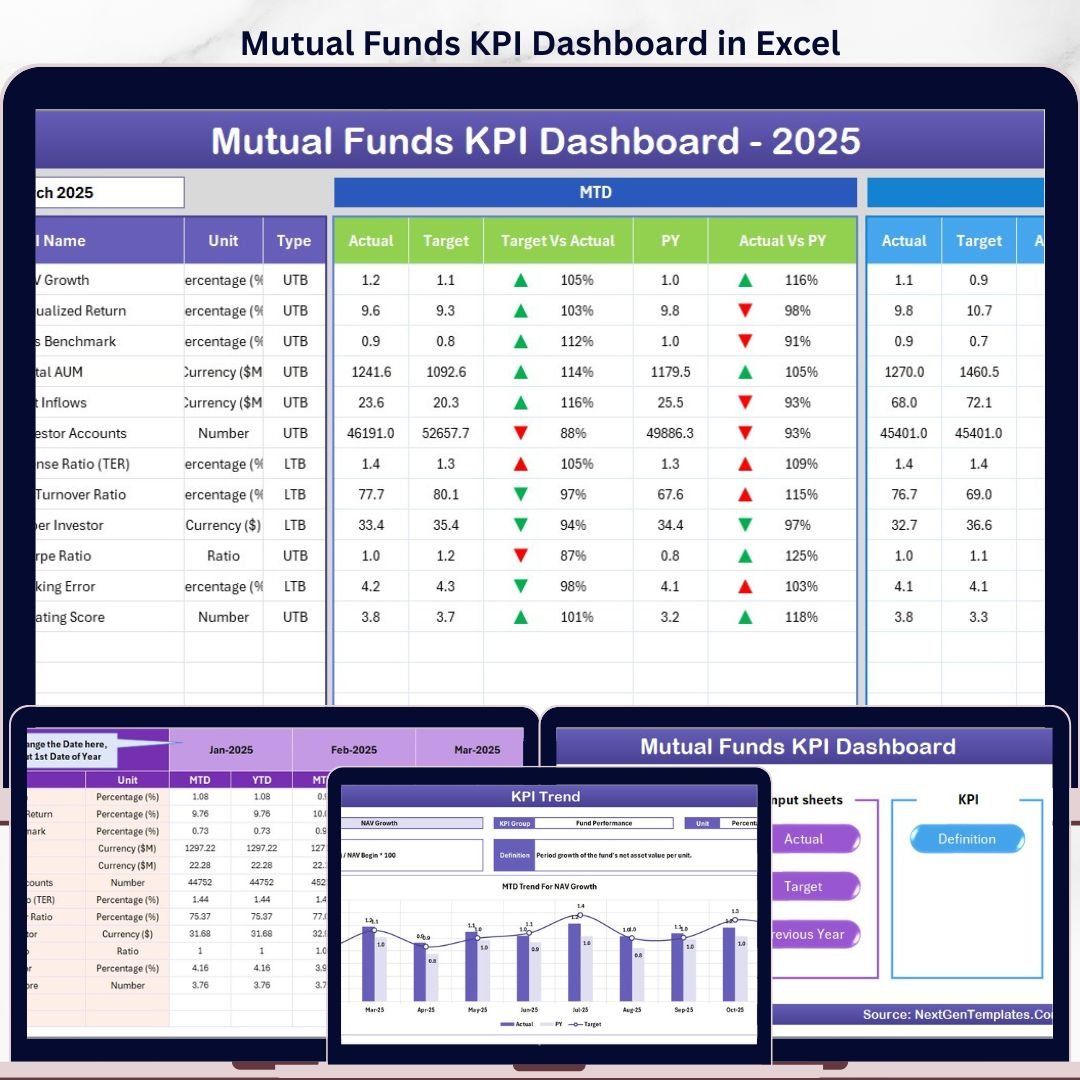


The Mutual Funds KPI Dashboard in Excel tracks performance KPIs across 7 worksheets, with MTD and YTD comparisons against Target and Previous Year, plus conditional-formatting up/down arrows on every metric. Setup takes under 10 minutes — just enter your fund’s actual, target, and prior-year numbers and the whole dashboard updates automatically.
🌍 Join 8,400+ teams in 40+ countries using NextGenTemplates to replace paid SaaS tools with one-time-purchase Excel, Google Sheets, Power BI, and HTML templates.
✅ Instant download · One-time payment · No subscription · No per-user fees · Lifetime access

🔑 Key Features of the Mutual Funds KPI Dashboard in Excel
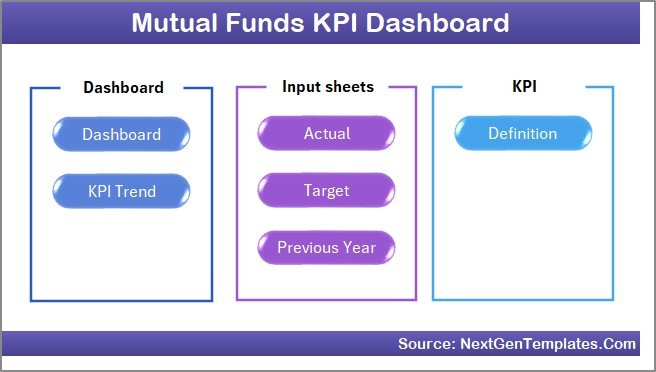
🔹 7 Interactive Worksheets – The Mutual Funds KPI Dashboard in Excel ships with a Home navigation sheet, a Dashboard sheet, a KPI Trend sheet, three input sheets (Actual, Target, Previous Year), and a KPI Definition sheet — every page is pre-wired with formulas so changes flow through instantly.
🔹 Month Selector with Dynamic Recalculation – Range D3 on the Dashboard sheet holds a single drop-down. Pick any month and every KPI card, variance arrow, MTD figure, and YTD figure refreshes on the spot — no formulas to rewrite, no slicers to configure.
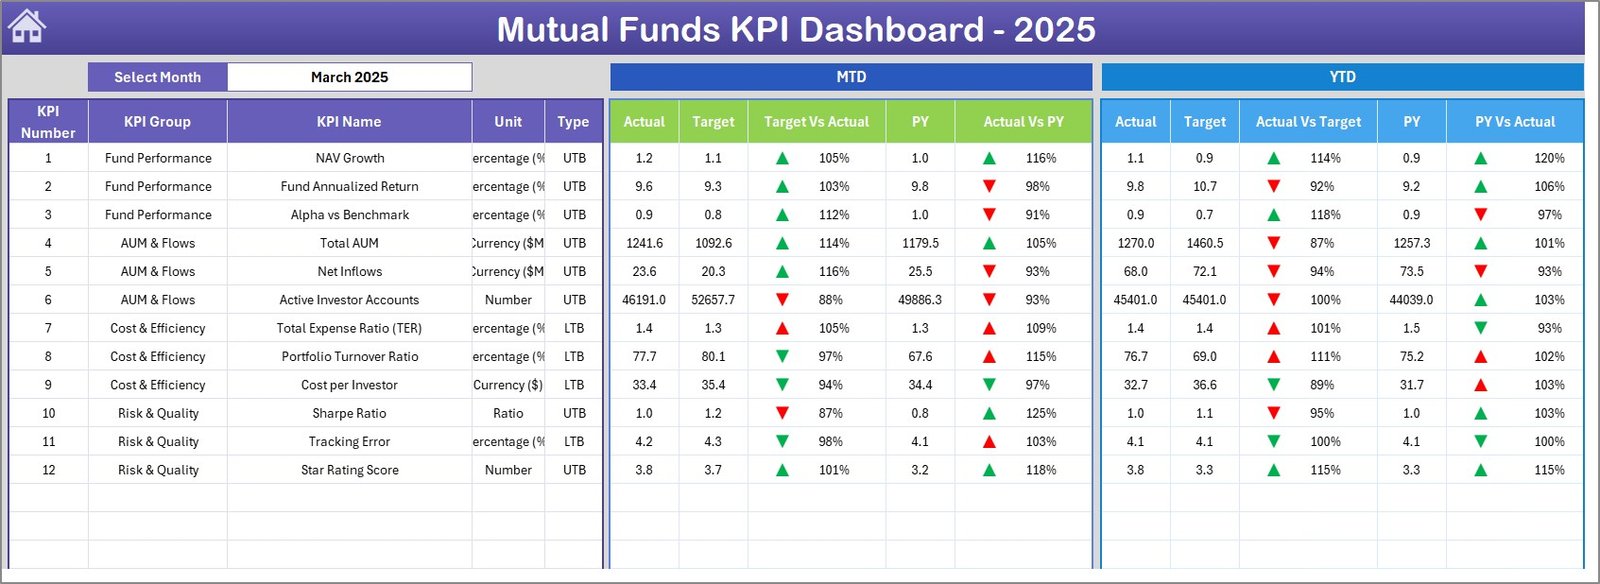
🔹 MTD + YTD Side-by-Side – The dashboard displays Month-to-Date and Year-to-Date values for Actual, Target, and Previous Year in a single screen, so fund managers can read short-term performance and full-year tracking without flipping tabs.
🔹 Target vs. Actual & Previous Year vs. Actual Variance Arrows – Conditional formatting renders an up arrow (green) or down arrow (red) next to every KPI, making over/under-performance readable in seconds — useful for monthly board reviews and investor decks.
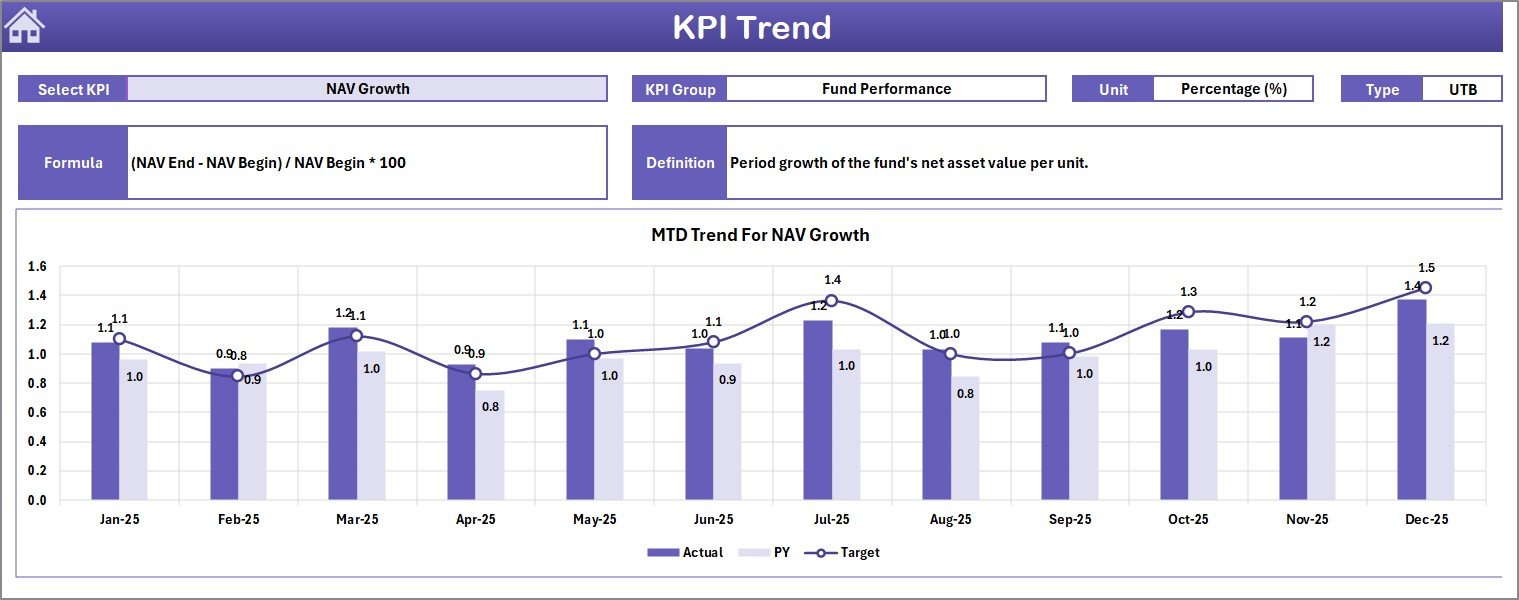
🔹 KPI Trend Sheet with Drop-Down Selector – Cell C3 on the KPI Trend tab holds a KPI selector. Pick any KPI and the page populates its Group, Unit, Type (LTB/UTB), Formula, and Definition, then plots MTD and YTD trend lines for Actual, Target, and PY in two separate charts.
🔹 Separate Actual, Target & Previous Year Input Sheets – Three dedicated input tabs keep your live numbers, plan, and history isolated. The Actual sheet starts the calendar from the month you type in cell E1, so April-March, July-June, or January-December fiscal calendars all work without rebuilding the file.
🔹 LTB / UTB Logic Built In – Every KPI is tagged as Lower-the-Better or Upper-the-Better in the KPI Definition sheet. The arrows on the Dashboard automatically flip direction based on that flag — so “Expense Ratio” going down shows a green up-arrow, and “AUM Growth” going up does the same.
🔹 Editable KPI Definition Sheet – Drop in your own KPIs by editing rows on the KPI Definition sheet: Name, Group, Unit, Formula, Definition, Type. The Dashboard and KPI Trend pages pick them up automatically — no VBA, no named ranges to maintain.
🔹 Suited for Mutual Fund Categories – Works for equity, debt, hybrid, ELSS, index, sectoral, and liquid funds. Track NAV growth, Total Expense Ratio, AUM, redemptions, SIP inflows, fund manager performance, alpha, beta, Sharpe ratio, and tracking error in one place.
🔹 Plug-and-Play, No VBA Required – The entire workbook runs on standard Excel formulas and conditional formatting. It opens cleanly in Excel 2016, 2019, 2021, 365, and Excel for Mac — no macros to enable, no compatibility warnings.
📦 What’s Inside the Mutual Funds KPI Dashboard
📄 7 Worksheets — Home, Dashboard, KPI Trend, Actual Numbers Input, Target Number Input, Previous Year Number, KPI Definition
📊 Dual-Period KPI Views — MTD and YTD shown together for Actual, Target, and Previous Year
📈 2 Trend Charts per KPI — MTD trend and YTD trend with three series each (Actual, Target, PY)
🎯 Conditional Formatting Arrows — Up/Down indicators on Target vs. Actual and PY vs. Actual
🎛️ 2 Drop-Down Controls — Month selector on Dashboard, KPI selector on KPI Trend
📋 Editable KPI Library — Add, edit, or remove KPIs directly on the KPI Definition sheet
1. Home Sheet
The Home sheet is the navigation index for the workbook. Six buttons jump directly to the Dashboard, KPI Trend, Actual Numbers, Target Numbers, Previous Year Numbers, and KPI Definition sheets — useful when sharing the file with leadership who do not want to scan a tab bar.
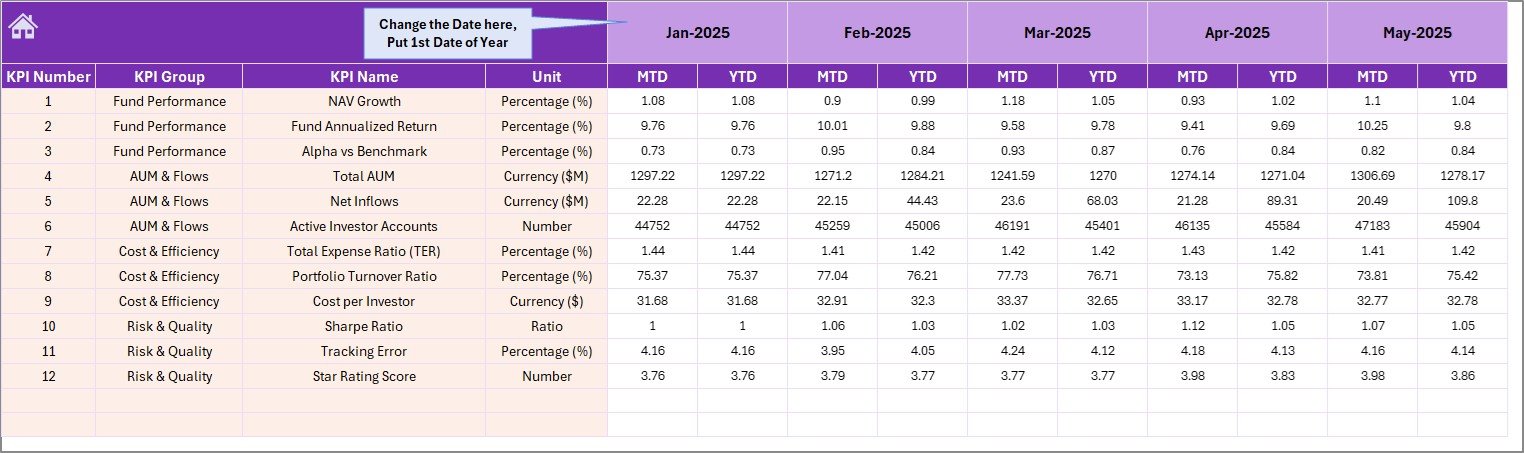
2. Dashboard Sheet
The Dashboard sheet is the main view. Cell D3 holds the month selector — pick any month and every number on the page refreshes. The layout shows MTD Actual, Target, and Previous Year alongside Target vs. Actual and PY vs. Actual with conditional-formatting up/down arrows, and repeats the same block for YTD so monthly and cumulative performance are visible at the same time.

3. KPI Trend Sheet
Pick a KPI from the drop-down on cell C3 and the KPI Trend sheet displays its Group, Unit, Type (LTB / UTB), Formula, and Definition, then plots two trend charts — one for MTD and one for YTD — each showing the Actual, Target, and Previous Year series side by side. Useful for monthly fund-manager reviews and trustee meetings.

4. Actual Numbers Input Sheet
Enter MTD and YTD actual values for every KPI here. The fiscal start month is controlled by cell E1 — type the first month of your fiscal year (April, July, January, etc.) and the month columns regenerate automatically. This is the only place where live performance numbers go.
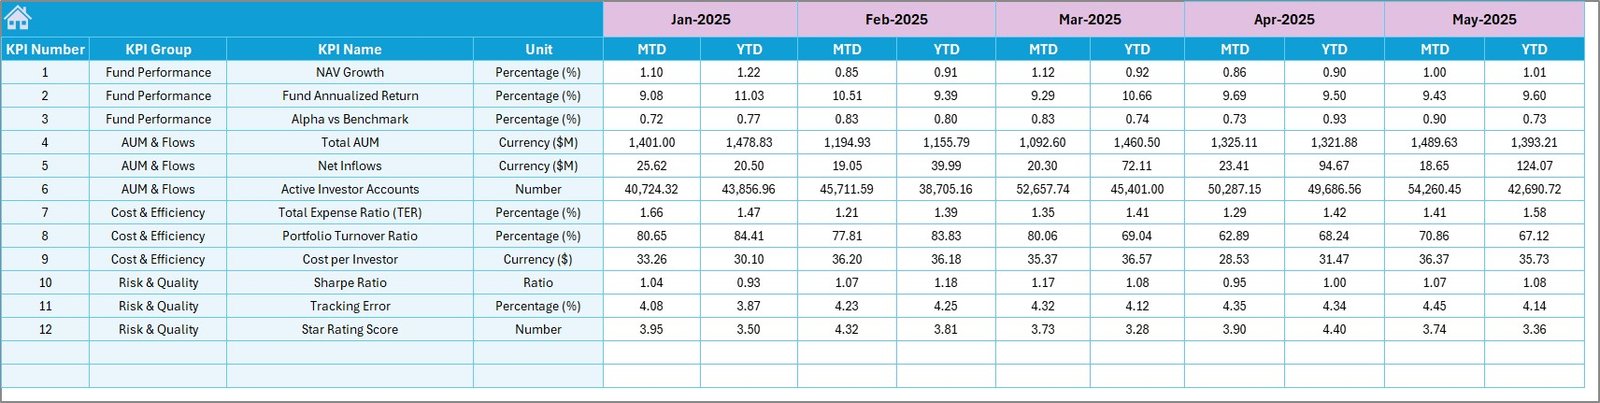
5. Target Number Input Sheet
Enter MTD and YTD target values for every KPI for each month. The Target sheet is what the Dashboard’s Target vs. Actual variance arrows compare against — keep this sheet aligned with your fund’s annual operating plan or AMC budget.
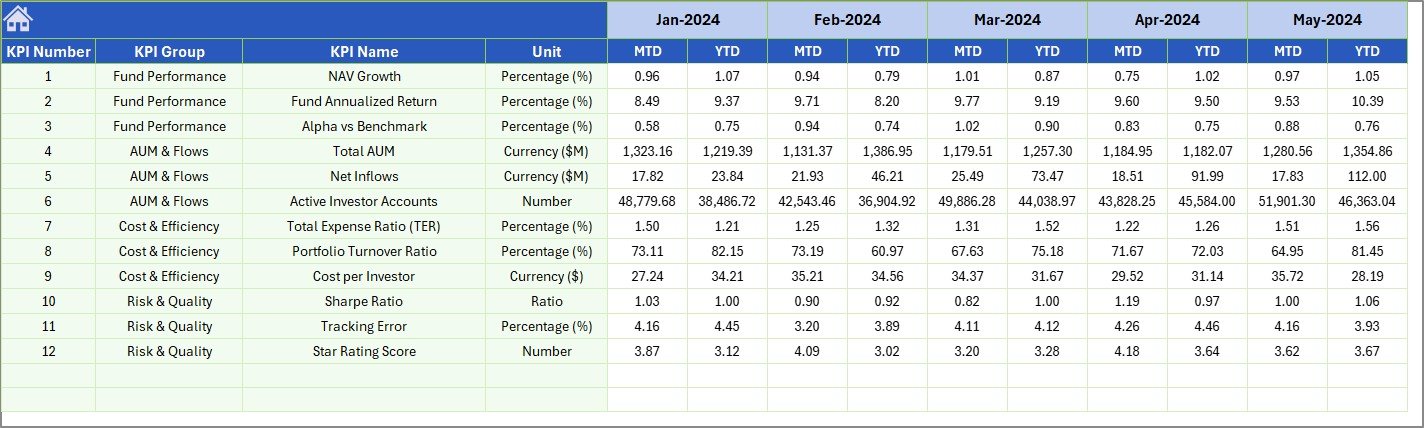
6. Previous Year Number Sheet
Enter MTD and YTD prior-year values for every KPI. These feed the PY vs. Actual comparison on the Dashboard and the Previous Year series on the trend charts — essential for year-over-year analysis of NAV growth, AUM, expense ratio, and redemptions.
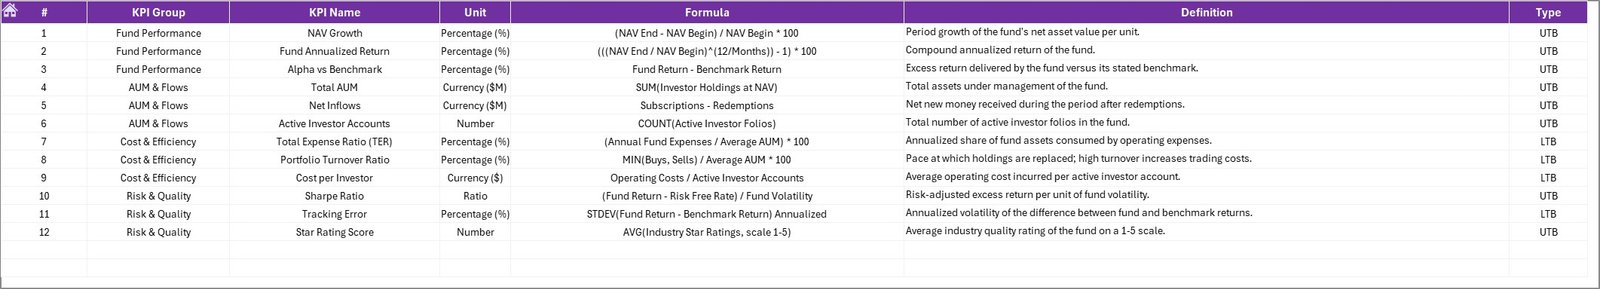
7. KPI Definition Sheet
Define every KPI in one place: KPI Name, KPI Group, Unit, Formula, Definition, and Type (LTB or UTB). Edit, add, or remove rows and the Dashboard plus KPI Trend pages refresh automatically — no formula edits needed elsewhere.

📊 Mutual Funds KPI Dashboard in Excel vs. Google Sheets Equivalent vs. Morningstar Direct / Bloomberg — Where This Fits
| Feature | Mutual Funds KPI Dashboard in Excel | Google Sheets Equivalent | Morningstar Direct / Bloomberg Terminal |
|---|---|---|---|
| Cost | $14.99 one-time | $9.99 one-time (Google Sheets version) | $1,800-$24,000 / user / year |
| Platform | Microsoft Excel (offline) | Google Sheets (browser) | Proprietary desktop / web SaaS |
| Setup Time | Under 10 minutes | Under 10 minutes | 2-6 weeks onboarding |
| MTD + YTD Variance Arrows | ✅ Built-in conditional formatting | ✅ Built-in | ✅ Configurable widgets |
| Real-Time Team Collaboration | Limited (OneDrive required) | ✅ Built-in | ✅ Enterprise plan |
| Mobile Access | Limited (Excel mobile) | ✅ Google Sheets app | ✅ Mobile app |
| Customisable KPIs | ✅ Edit KPI Definition sheet | ✅ Edit KPI Definition sheet | Limited to vendor library |
| Share with Link | ❌ File transfer required | ✅ One-click sharing | Role-based seats only |
| Year-1 Cost at 5 Analysts | $14.99 total | $9.99 total | $9,000-$120,000 |
For AMCs, fund houses, and independent analysts that want clear MTD/YTD mutual fund performance tracking without paying $1,800+ per seat per year, the Mutual Funds KPI Dashboard in Excel sits in the sweet spot.
👥 Who This Template Is For — and Who It’s Not For
✅ This template is built for:
- Asset Management Company (AMC) operations and fund accounting teams tracking monthly fund-level KPIs
- Mutual fund product managers preparing trustee, board, or investor performance decks
- Wealth managers and financial advisors monitoring a portfolio of recommended funds for clients
- Finance students and CFA candidates building a structured mutual fund performance model
- Independent research firms running monthly fund category reviews for retail subscribers
❌ This template is NOT for:
- Trading desks needing live NAV feeds or intraday tick-by-tick data
- SEBI/SEC compliance reporting that requires audited, system-of-record data pipelines
- Index providers running back-tests across thousands of funds — Power BI or a database is a better fit
⚙️ How to Use the Mutual Funds KPI Dashboard
1️⃣ Open the file in Microsoft Excel and start on the Home sheet. Click any navigation button to jump to a tab.
2️⃣ Go to the KPI Definition sheet and replace the sample KPIs with your own — Name, Group, Unit, Formula, Definition, and Type (LTB or UTB).
3️⃣ Open the Actual Numbers Input sheet and type your fiscal start month in cell E1. Enter MTD and YTD actuals for each month.
4️⃣ Fill in the Target Number Input and Previous Year Number sheets with the matching plan and prior-year figures.
5️⃣ Return to the Dashboard sheet, pick a month from cell D3, and review variance arrows for both MTD and YTD. Open the KPI Trend sheet for deeper per-KPI analysis.
💼 Real-World Use Cases
Aarti is a fund operations analyst at a mid-size AMC in Mumbai. Every month-end she rolls up NAV growth, expense ratio, AUM, redemptions, and SIP book size for 14 schemes. She uses the Mutual Funds KPI Dashboard in Excel to drop in actuals on a single sheet, pick the month, and email a clean MTD/YTD variance view to the CIO — replacing a 22-tab legacy file her predecessor maintained.
Daniel runs an independent advisory firm in London. He tracks 8 recommended global equity funds for his clients. Each quarter he updates the Actual, Target (his expected returns), and PY sheets, then exports the Dashboard sheet as a PDF for client review meetings — a workflow that used to require Morningstar Direct at £4,200 a seat.
Priya is a CFA Level 2 candidate in Bangalore studying portfolio management. She uses the template to model her practice fund — alpha, beta, Sharpe ratio, tracking error — using the KPI Trend chart to visualise how a tighter expense ratio changes MTD and YTD performance vs. benchmark.
❓ Frequently Asked Questions
What KPIs can I track with the Mutual Funds KPI Dashboard in Excel?
The Mutual Funds KPI Dashboard in Excel works with any mutual fund KPI you define on the KPI Definition sheet — typical metrics include NAV growth, AUM, Total Expense Ratio, redemptions, SIP inflows, alpha, beta, Sharpe ratio, and tracking error. Each KPI shows MTD and YTD Actual, Target, and Previous Year side-by-side.
Does the dashboard work for non-calendar fiscal years like April-March or July-June?
Yes. The Actual Numbers Input sheet has a fiscal-start cell at E1 — type your fiscal start month (for example, April or July) and the column headers and downstream formulas adjust automatically. The Target and Previous Year sheets follow the same logic.
How are the up/down arrows on the Dashboard calculated?
Each KPI is tagged as Lower-the-Better (LTB) or Upper-the-Better (UTB) on the KPI Definition sheet. Conditional formatting reads that flag and flips the arrow direction so improvements always show green — Expense Ratio going down shows a green up-arrow, AUM going up shows the same.
How does this compare to Morningstar Direct or Bloomberg Terminal?
Morningstar Direct and Bloomberg Terminal cost $1,800-$24,000 per user per year and provide live market feeds, broad fund universes, and audit-grade data. The Mutual Funds KPI Dashboard in Excel costs $14.99 one-time and is designed for internal KPI tracking and reporting where you already have the underlying numbers.
Does the template require Excel macros or VBA?
No. The Mutual Funds KPI Dashboard in Excel runs entirely on standard Excel formulas, drop-down lists, and conditional formatting. There are no macros, no VBA, and no security warnings on open — so it works in locked-down corporate environments where macros are disabled.
How long does setup take?
Setup takes under 10 minutes if you already have your KPI list, monthly actuals, targets, and prior-year numbers. Replace the sample data on the four input sheets and the Dashboard plus KPI Trend pages refresh automatically — no formula edits required.
Can I add or remove KPIs after I have started using the file?
Yes. Open the KPI Definition sheet and edit, add, or delete KPI rows. The KPI selector drop-down on the KPI Trend sheet rebuilds automatically, and the Dashboard layout flexes to match — no need to rewire formulas or named ranges.
👤 About the Author
Built by PK — Microsoft Certified Professional with 15+ years of Excel, Google Sheets, and Power BI experience. Founder of NextGenTemplates, reaching 300K+ subscribers across YouTube channels (@PK-AnExcelExpert, @NextGenTemplates, @NeoTechNavigators). Every template is hand-built and tested before release.
🔗 Explore Related Templates
🔹 Sovereign Wealth Funds KPI Dashboard in Excel — Same MTD/YTD KPI framework tuned for sovereign and pension fund managers.
🔹 Investment Banking KPI Dashboard in Excel — Deal flow, pitchbook conversion, and league-table KPIs for IB teams.
🔹 Investment Management KPI Dashboard in Excel — AUM, alpha, beta, and client-level KPIs for asset managers.
🔹 Personal Investment KPI Dashboard in Excel — Same dashboard structure built for retail investors and family offices.
🔹 Wealth Tech Dashboard in Excel — Wealth-management technology KPIs across AUM, advisors, and digital onboarding.
🔹 Also available as: Personal Investment KPI Dashboard in Google Sheets for teams that prefer browser-based collaboration.
Browse all Excel KPI Dashboards on NextGenTemplates.
📖 Click here to read the Detailed Blog Post
🎥 Visit our YouTube channel for step-by-step video tutorials
👉 YouTube.com/@NextGenTemplates


Reviews
There are no reviews yet.