
In today’s rapidly evolving digital environment, organizations face increasing cybersecurity threats, operational risks, and compliance pressures. Businesses manage sensitive data, cloud platforms, internal systems, and digital assets every day. Therefore, security teams must monitor incidents continuously, analyze risks quickly, and respond before problems escalate.Unfortunately, many organizations still rely on manual spreadsheets and disconnected reports. Because of this, leaders struggle to gain real-time visibility into security performance. Critical warning signs often go unnoticed, resulting in delayed responses, operational disruptions, and financial losses.That’s exactly where the Security Dashboard in Power BI becomes a game-changing solution.This ready-to-use Power BI dashboard transforms raw security data into interactive visuals, enabling organizations to monitor incidents, evaluate risks, and track compliance performance from one centralized platform. Instead of spending hours compiling reports, decision-makers can instantly understand what is happening across their security landscape.
With dynamic analytics, intelligent visuals, and structured KPI tracking, this dashboard helps organizations shift from reactive monitoring to proactive security management.
⭐ Key Features of Security Dashboard in Power BI
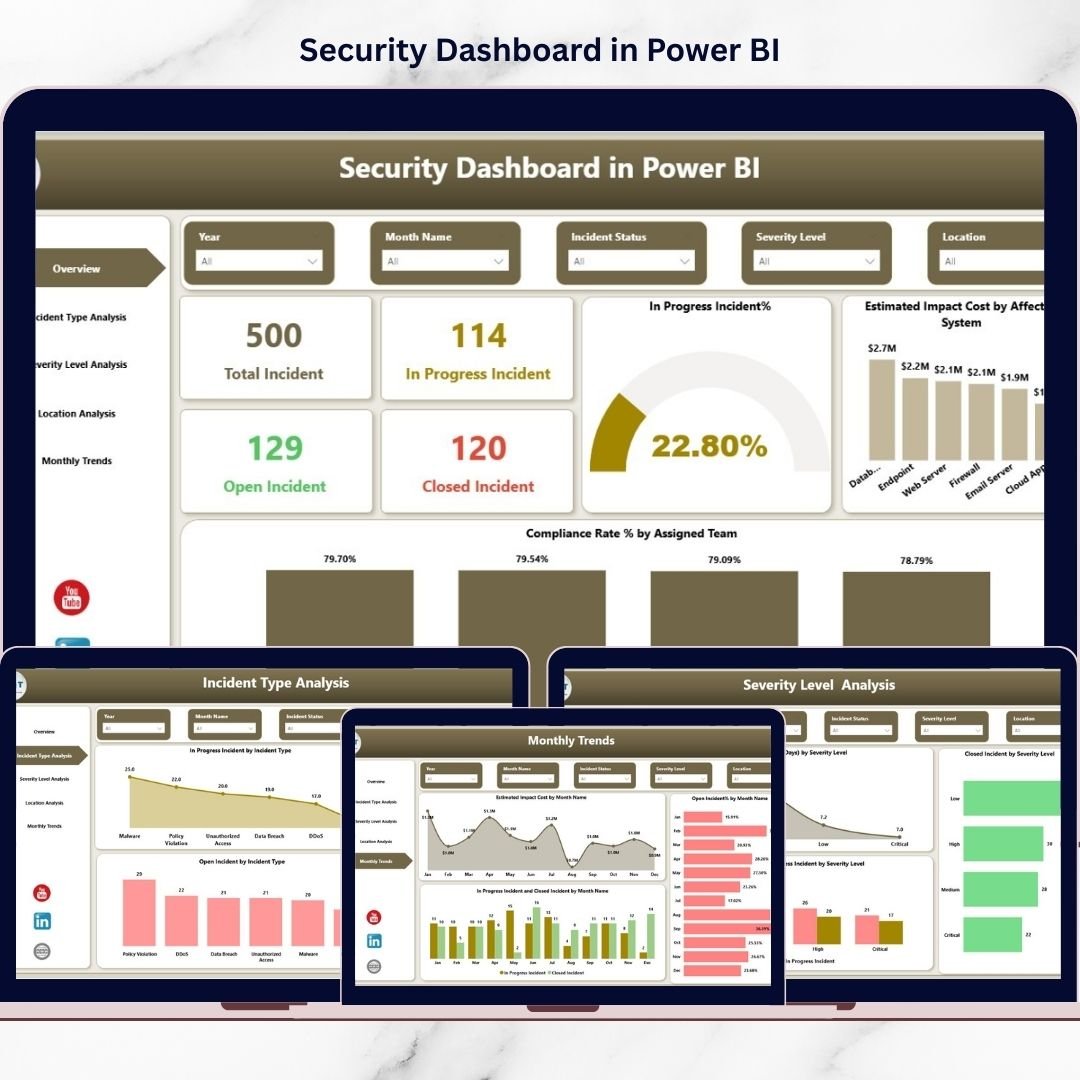
🚨 Real-Time Incident Monitoring
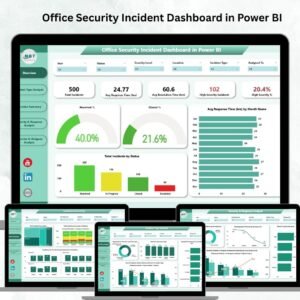
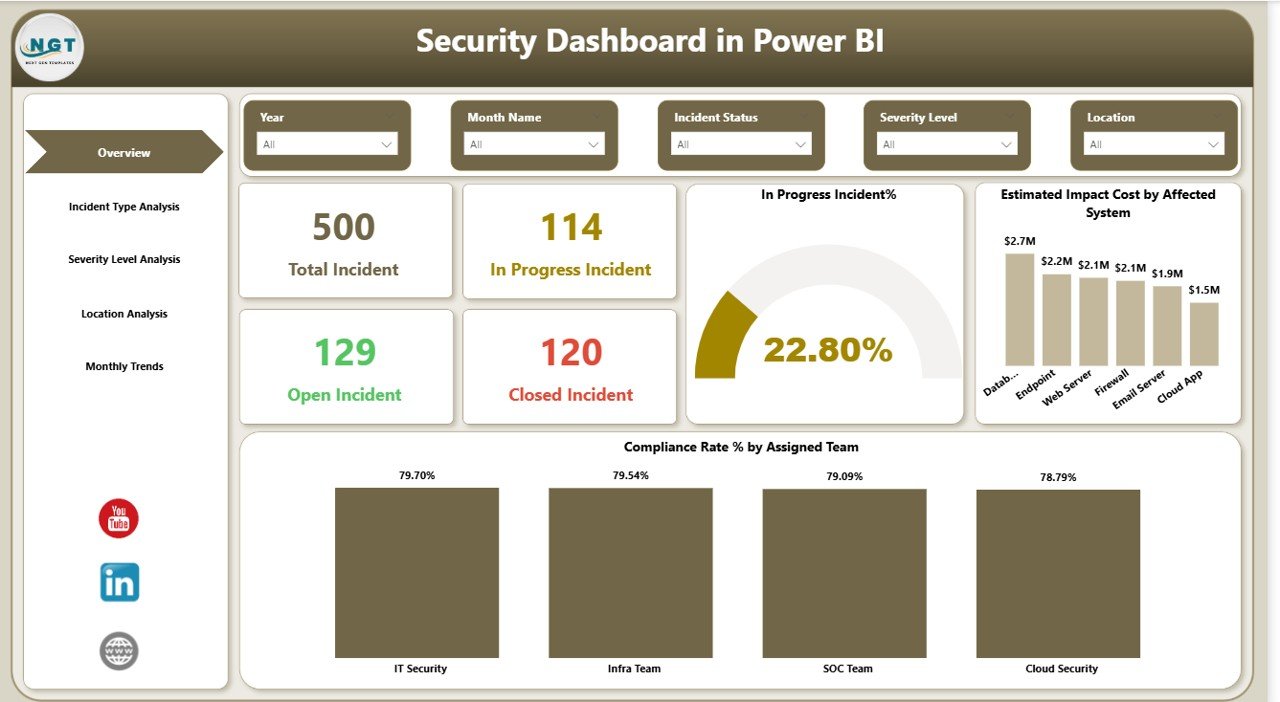
Track open, closed, and in-progress incidents instantly through interactive KPI cards.
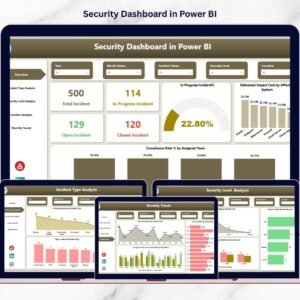
📊 Five Interactive Dashboard Pages
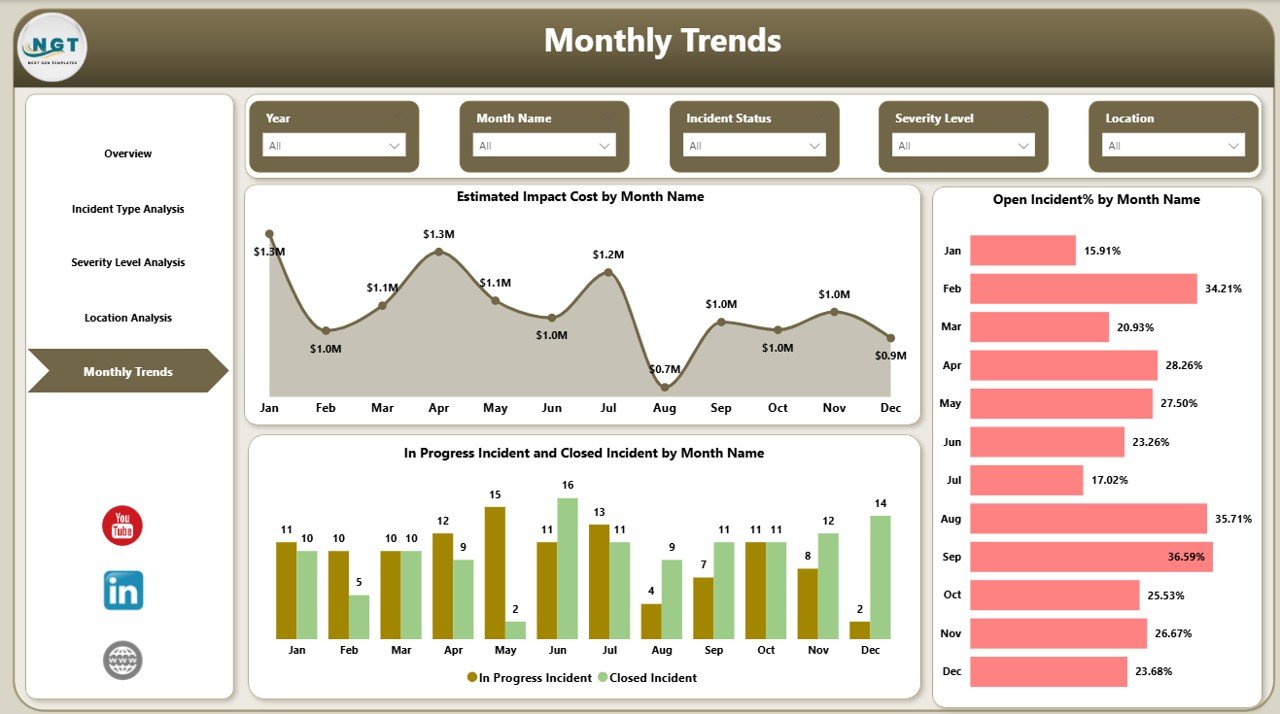
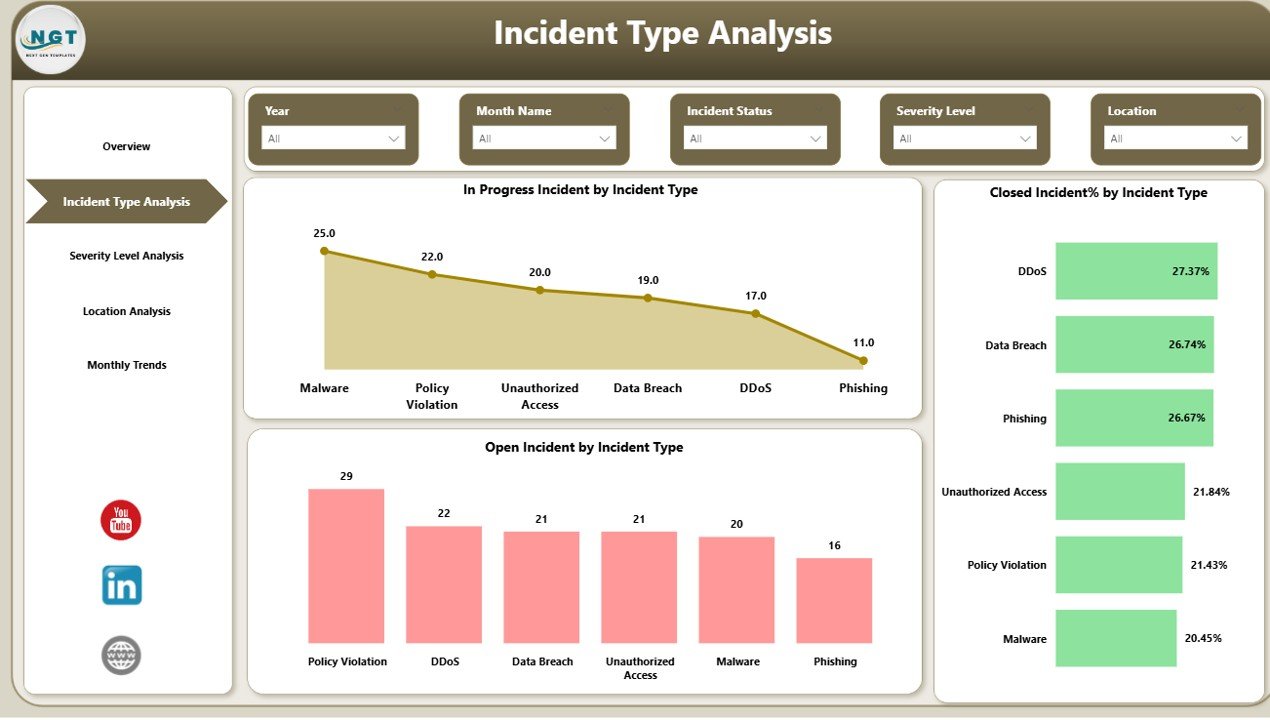
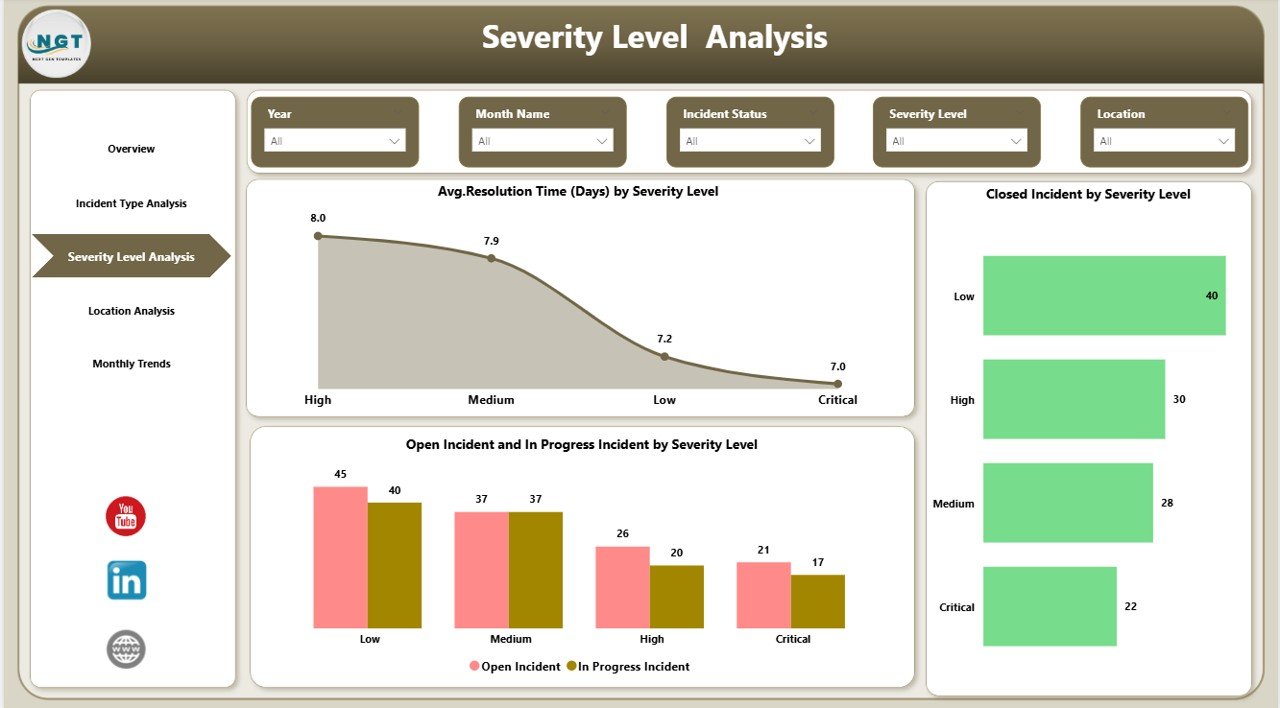
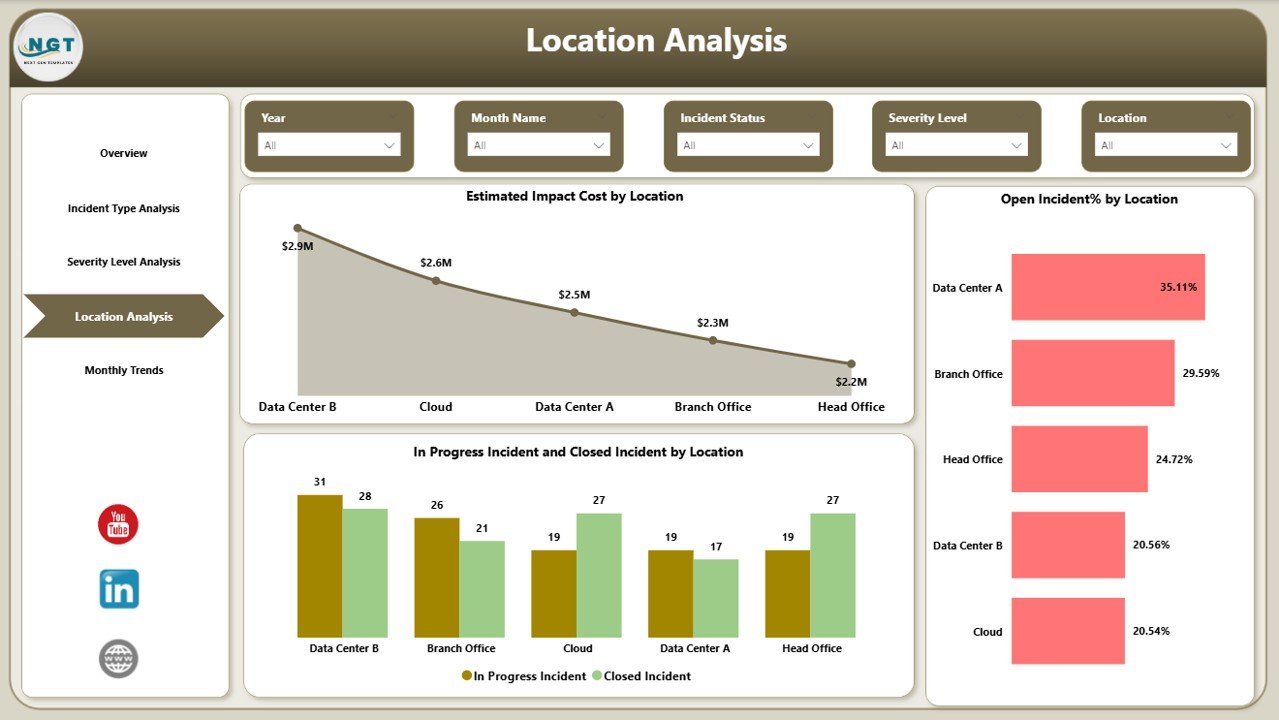
Analyze security performance through Overview, Incident Type, Severity Level, Location Analysis, and Monthly Trends pages.
📈 Advanced Trend Analysis
Monitor monthly performance trends to identify recurring threats and improvement areas.
🌍 Location-Based Risk Insights
Understand which regions or offices face higher security risks using geographic analysis.
⚡ Impact Cost Tracking
Measure estimated financial impact caused by security incidents for better decision-making.
🎯 Compliance Performance Monitoring
Evaluate compliance rates by teams to ensure regulatory alignment.
🔎 Interactive Filtering Experience
Use slicers and filters to explore data dynamically without technical expertise.
📦 What’s Inside the Security Dashboard in Power BI
When you download this product, you receive a professionally designed Power BI solution built for immediate implementation:
✅ Fully designed Power BI dashboard file
✅ Structured security KPI framework
✅ Interactive charts and KPI visuals
✅ Incident monitoring analytics pages
✅ Trend and performance tracking visuals
✅ Easy-to-connect Excel data source structure
✅ Ready-to-use layout optimized for decision-making
Everything is organized to help you start monitoring security performance quickly without complex setup.
🚀 How to Use the Security Dashboard in Power BI
Getting started is simple—even if you are new to Power BI.
1️⃣ Connect your security or incident data source (Excel or system export).
2️⃣ Refresh the dataset using Power Query.
3️⃣ Explore dashboard pages using slicers and filters.
4️⃣ Monitor incidents, compliance, and severity levels instantly.
5️⃣ Share insights with stakeholders through Power BI Service.
Within minutes, your organization gains a centralized security monitoring system powered by visual analytics.
🎯 Who Can Benefit from This Security Dashboard
This dashboard is designed for organizations that require clear visibility into operational and cybersecurity performance.
👨💻 IT Security Teams monitoring daily incidents
🛡️ Cybersecurity Analysts analyzing threats
📋 Compliance Managers tracking regulatory performance
📊 Risk Management Professionals evaluating exposure
🏢 Operations Leaders improving response efficiency
👔 Executives seeking real-time security insights
Because security affects every department, this dashboard supports organization-wide decision-making.
A structured analytics approach helps organizations detect risks early, improve response time, and strengthen overall security posture. Instead of reacting to incidents after damage occurs, teams can proactively manage threats using data-driven insights.
The Security Dashboard in Power BI empowers organizations with centralized reporting, visual intelligence, and actionable analytics — helping businesses protect systems, reduce risks, and make faster strategic decisions.
Click here to read the Detailed blog post
Watch the step-by-step video tutorial:
Visit our YouTube channel to learn step-by-step video tutorials
https://youtube.com/@PKAnExcelExpert
Compatibility and Requirements
- Works in Power BI Desktop, which is free. Power BI Desktop runs on Windows. Microsoft explains the download in Get Power BI Desktop.
- The dashboard reads its data from an Excel file, so you need Excel to enter or paste your incident data.
Frequently Asked Questions
Which pages does the dashboard have?
Five pages: Overview, Incident Type, Severity Level, Location Analysis and Monthly Trends.
Where does the dashboard get its data?
It connects to an Excel data source. You add your incident data there, then refresh the dataset with Power Query.
Can I filter the data?
Yes. Slicers and filters let you explore the incidents by selection without any technical setup.
What can I track with it?
Open, closed and in-progress incidents, estimated impact cost, compliance rates by team, risk by location and monthly trends.
Is there an Excel version?
Yes. See the Cybersecurity Dashboard in Excel and the Security KPI Dashboard in Excel.
Related Security Templates
- Office Security Incident Dashboard in Power BI: incident tracking for office security in Power BI
- Cybersecurity KPI Dashboard in Power BI: cybersecurity KPIs in Power BI
- Cybersecurity Dashboard in Excel: the same topic in Excel
- Security KPI Dashboard in Excel: a KPI view of security in Excel
- IT and Cybersecurity Operations Bundle: 8 templates for IT and security teams in one download
Browse all Power BI dashboards.