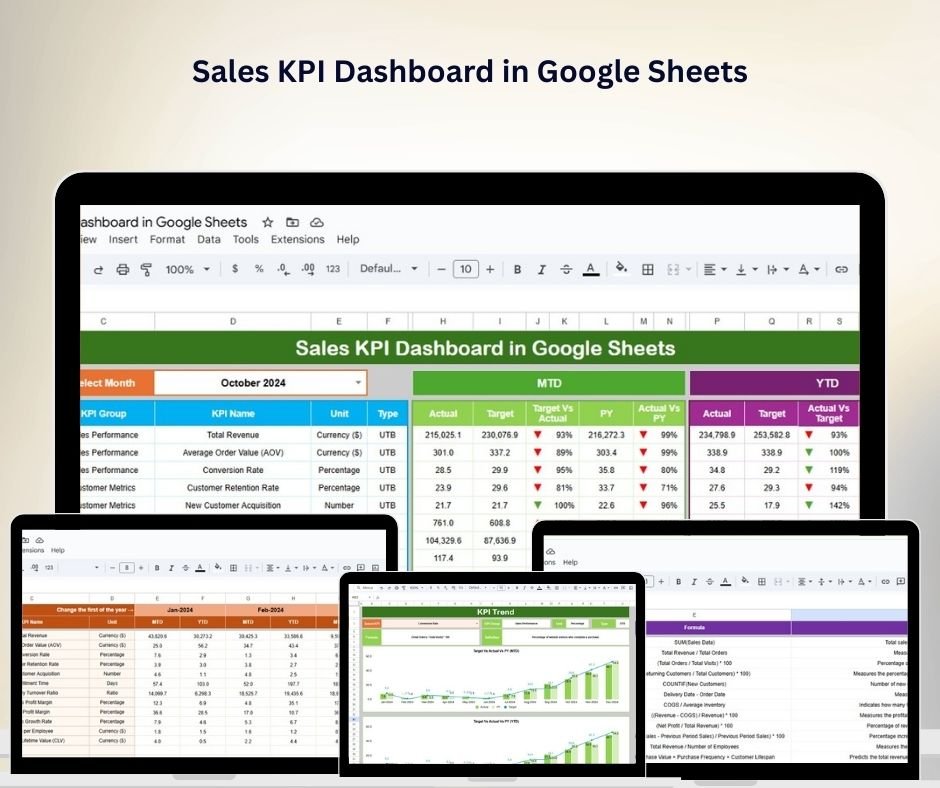


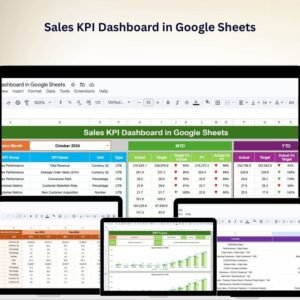
The Sales KPI Dashboard in Google Sheets is a powerful and intuitive tool designed to help businesses monitor and analyze their sales performance effectively. Whether you’re a sales manager, business owner, or analyst, this dashboard provides real-time insights into your sales activities, enabling data-driven decisions that drive growth and profitability.
Built within Google Sheets, the dashboard offers a user-friendly interface with customizable features, ensuring it aligns with your unique sales objectives and metrics. From tracking sales targets to analyzing regional performance, this tool consolidates all your sales data in one place for seamless monitoring.

Key Features of the Sales KPI Dashboard in Google Sheets
📈 Comprehensive Sales Tracking
Monitor total sales, average deal size, and sales conversion rates with ease. The dashboard provides a clear view of your sales pipeline, helping you identify strengths and areas for improvement.
🗺 Regional and Team Performance Analysis
Evaluate sales performance across different regions and teams. Compare metrics to identify top performers and regions needing attention, facilitating targeted strategies for growth.
🎯 Target Achievement Monitoring
Set and track sales targets against actual performance. Visual indicators highlight progress, ensuring your team stays focused on achieving goals.
📊 Visual Data Representation
Utilize charts and graphs to visualize sales trends, seasonal variations, and forecasting. These visual aids simplify complex data, making it accessible and actionable.
🔄 Customizable and Scalable
Tailor the dashboard to fit your specific sales metrics and objectives. As your business grows, the dashboard adapts, accommodating additional data and evolving strategies.
Why You’ll Love This Sales KPI Dashboard
-
Real-Time Data Updates: Ensure your sales data is always current, allowing for timely decision-making.
-
User-Friendly Design: Designed for users at all levels, the dashboard requires no advanced technical skills to operate.
-
Enhanced Collaboration: Share insights with your team effortlessly, fostering collaboration and alignment towards sales objectives.
-
Cost-Effective Solution: Leverage the power of Google Sheets to manage your sales data without the need for expensive software.
What’s Inside the Sales KPI Dashboard?
-
Sales Overview Sheet: A comprehensive view of all sales activities, including totals, averages, and conversion rates.
-
Regional Performance Tracker: Detailed analysis of sales by region, highlighting strengths and opportunities.
-
Team Performance Dashboard: Monitor individual and team sales metrics to drive motivation and performance.
-
Target vs. Actual Analysis: Compare set targets with actual sales to assess performance and adjust strategies accordingly.
-
Data Visualization Charts: Interactive charts that provide visual insights into sales trends and forecasts.
How to Use the Sales KPI Dashboard
-
Download the Template: Access the Google Sheets template instantly after purchase.
-
Customize Your Metrics: Input your specific sales data and adjust settings to align with your business objectives.
-
Analyze Performance: Utilize the dashboard to monitor sales activities, identify trends, and make informed decisions.
-
Share Insights: Collaborate with your team by sharing the dashboard, ensuring everyone is aligned with sales goals.
Who Can Benefit from This Sales KPI Dashboard?
-
Sales Managers: Oversee and optimize sales strategies with clear performance data.
-
Business Owners: Gain a comprehensive understanding of sales operations to drive business growth.
-
Sales Analysts: Analyze data to provide actionable insights and support strategic planning.
-
Marketing Teams: Align marketing efforts with sales data to enhance campaign effectiveness.
Click here to read the Detailed blog post
Sales KPI Dashboard in Google Sheets
Visit our YouTube channel to learn step-by-step video tutorials


Reviews
There are no reviews yet.