
Research and Development Dashboard in Excel

MS Excel - instant download

Original price was: $19.99.Current price is: $13.99.
Details, requirements and demo below
Sale!

Research and Development Dashboard in Excel

Original price was: $19.99.Current price is: $13.99.

🚀 Take full control of your R&D performance with confidence!

🔹 Centralized R&D Dashboard – Monitor budgets, milestones, risks, and innovation in one Excel file
🔹 Budget & Cost Control – Track approved vs spent budgets and variance with clarity
🔹 Timeline Tracking – Identify delays and optimize project delivery
🔹 Risk & Quality Insights – Detect risks and quality issues before they escalate
🔹 Innovation Measurement – Analyze prototypes, experiments, and revenue potential
🔹 Interactive Filters – Slice data by department, location, or product line
🔹 Ready-to-Use Excel Format – No advanced Excel skills required
🔹 Scalable & Customizable – Easily adapt as R&D operations grow

- +

💡 Buy any 2 templates and save 20% automatically at checkout.

Pricing country
Prices follow your selected country; checkout uses your billing country.
Excel Pivot Tables & Dashboards: Basic to Advanced courseLaunch offer
🎓 NEXTGENTEMPLATES ACADEMY
Like this dashboard? Learn to build your own.
Excel Pivot Tables & Dashboards: Basic to Advanced

From your first Pivot Table to the Data Model, DAX, Power Query and a one-page KPI dashboard. 11h 51m of video by PK, with practice files, quizzes and a capstone.

Innovation fuels business growth, but without proper visibility, research and development activities often suffer from budget overruns, missed milestones, and hidden risks. That is exactly why the Research and Development Dashboard in Excel is a must-have solution for modern organizations.

This ready-to-use Excel dashboard transforms complex R&D data into clear, actionable insights. Instead of managing scattered spreadsheets and manual reports, you get one centralized, interactive dashboard that helps you track budgets, timelines, risks, quality metrics, and innovation outcomes with ease. As a result, decision-makers gain clarity, teams improve accountability, and organizations accelerate innovation.

Designed for simplicity and power, this dashboard uses Excel formulas, pivot tables, and dynamic charts. Therefore, you can monitor performance in real time without needing advanced technical skills. Whether you manage multiple departments, locations, or product lines, this dashboard keeps everything structured and easy to analyze.


✨ Key Features of Research and Development Dashboard in Excel

📊 Comprehensive R&D Overview
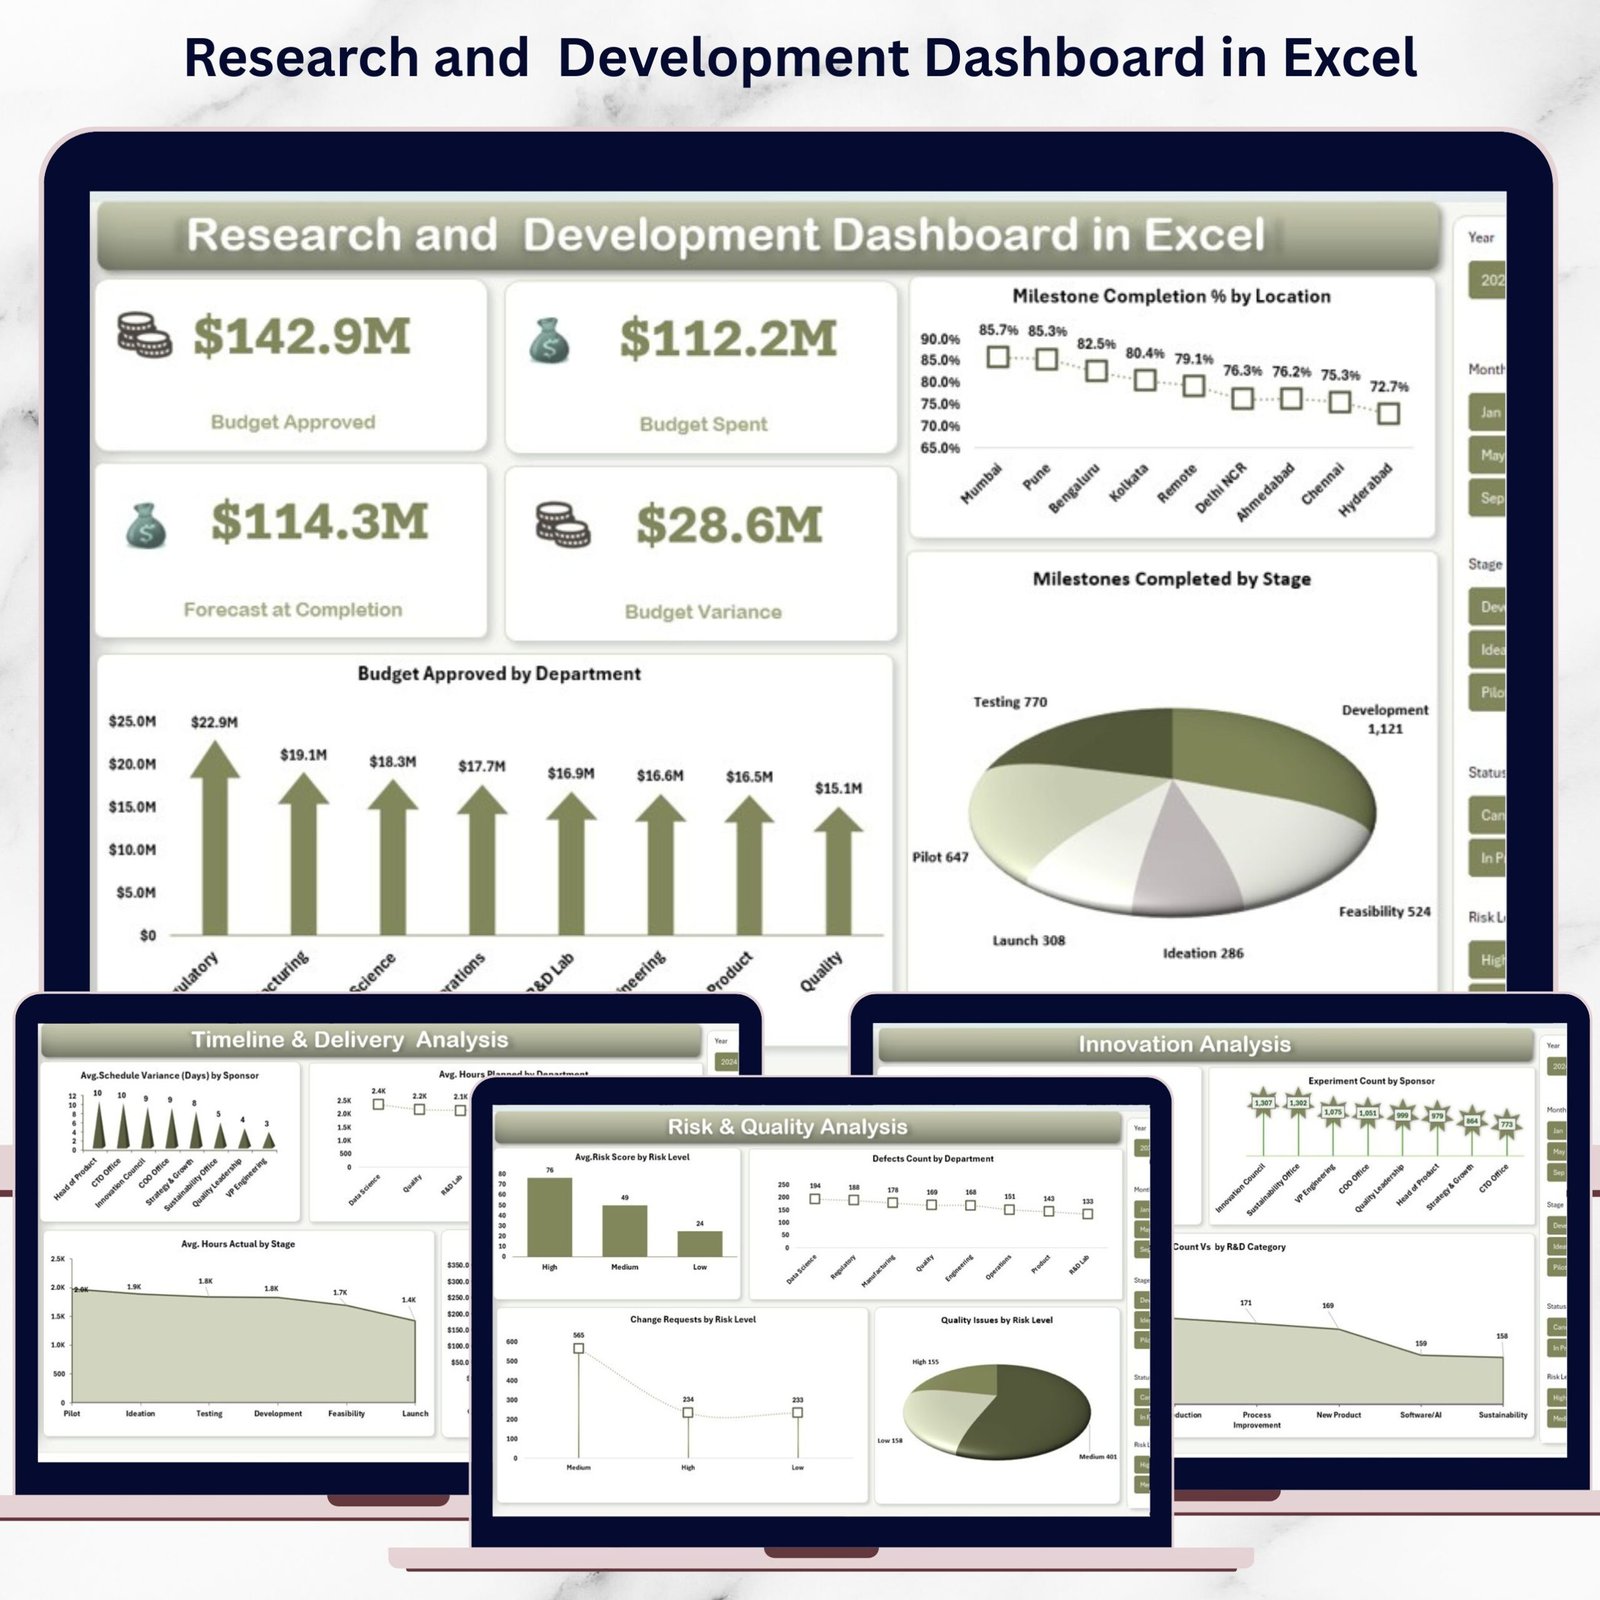
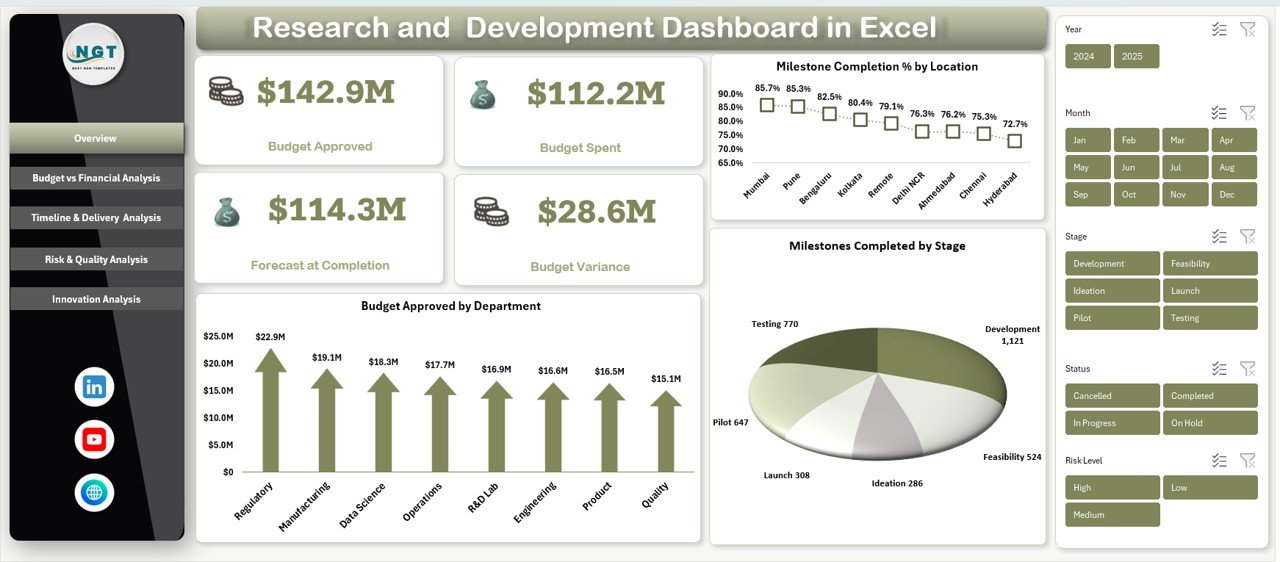
Get instant visibility into Budget Approved, Budget Spent, Forecast at Completion, and Budget Variance to understand overall R&D health at a glance.

📍 Milestone & Location Tracking
Analyze Milestone Completion % by Location and Milestones Completed by Stage to monitor progress across regions and development phases.

💰 Budget vs Financial Analysis
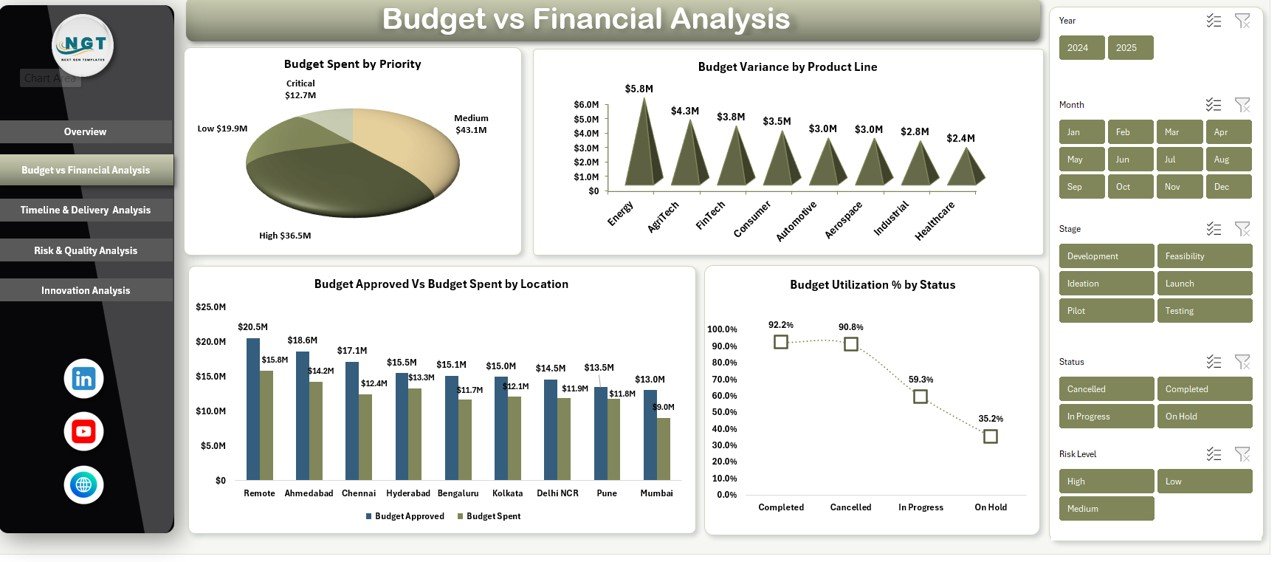
Track Budget Spent by Priority, Budget Approved vs Budget Spent by Location, Budget Variance by Product Line, and Budget Utilization % by Status to maintain cost control.

⏱️ Timeline & Delivery Insights
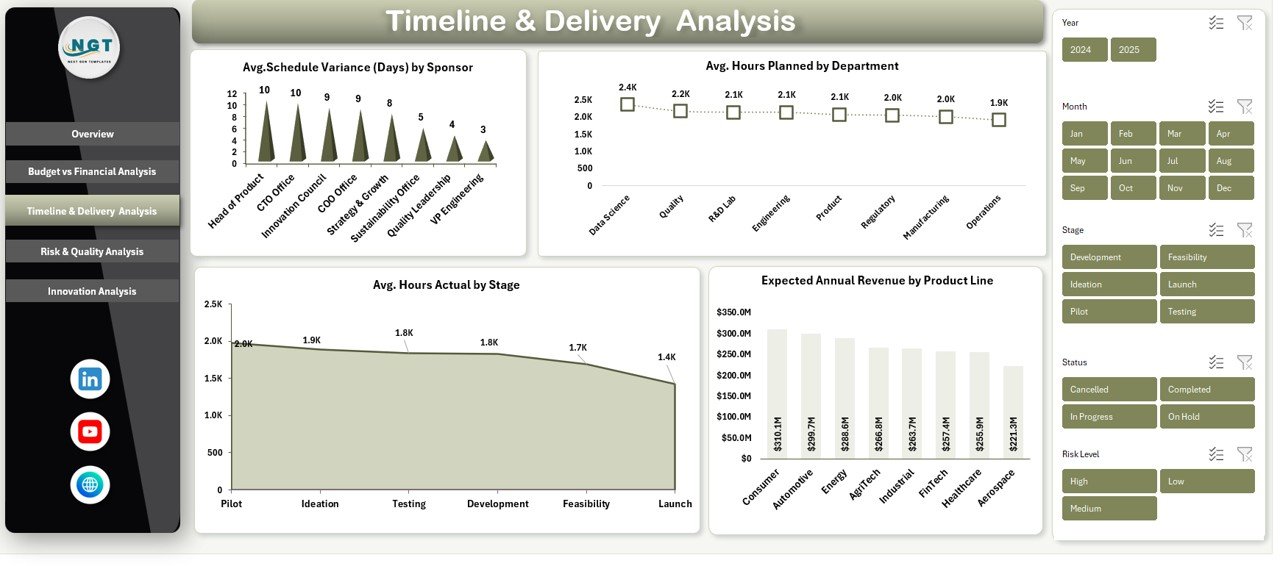
Measure Average Schedule Variance by Sponsor, compare Planned vs Actual Hours, and link timelines with Expected Annual Revenue by Product Line.

⚠️ Risk & Quality Monitoring
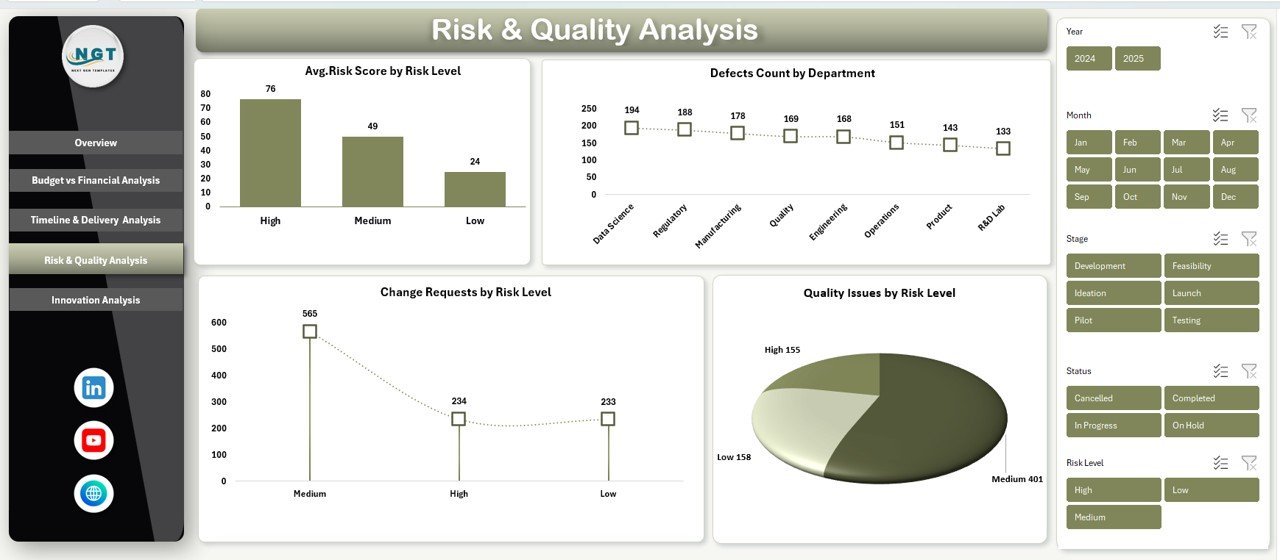
Identify Average Risk Score, Change Requests, Quality Issues by Risk Level, and COGS % by Region to reduce failures early.

🚀 Innovation Performance Analysis
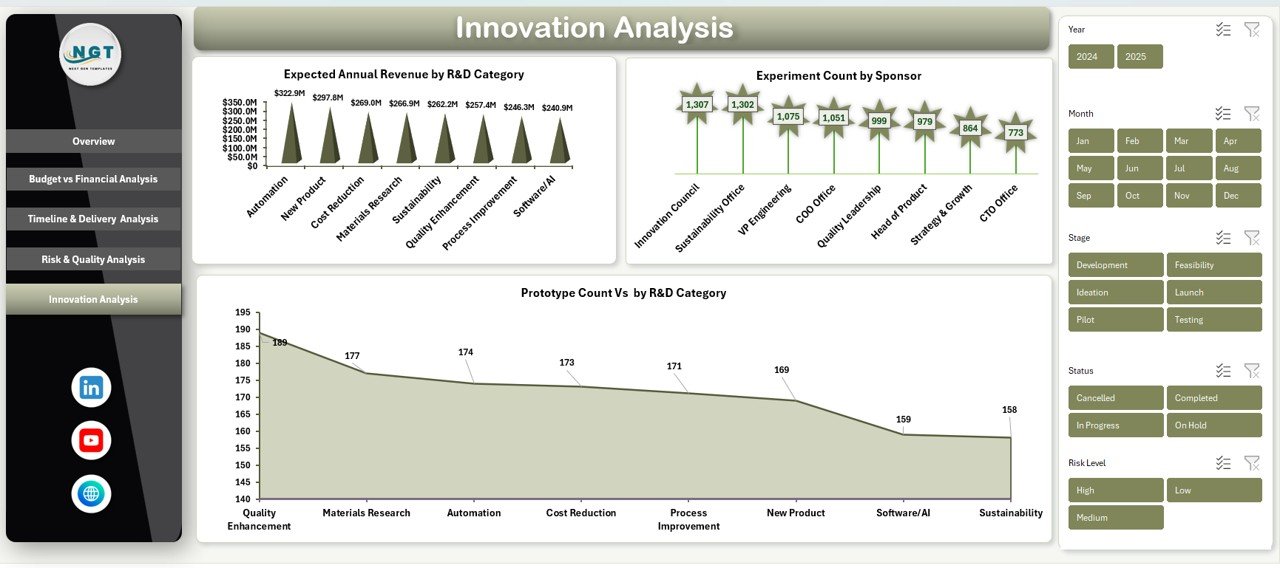
Evaluate Expected Annual Revenue by R&D Category, Prototype Count, and Experiment Count by Sponsor to measure innovation output.

🔄 Dynamic Filters & Slicers
Filter data by Location, Department, Product Line, Sponsor, Risk Level, and R&D Category for deep-dive analysis.
Research and Development Dashboard in Excel

📦 What’s Inside the Research and Development Dashboard in Excel

📁 Overview Sheet
A high-level snapshot showing budgets, milestones, and departmental performance.

📁 Budget vs Financial Analysis Section
Detailed visuals to track spending efficiency and budget utilization.

📁 Timeline & Delivery Analysis Section
Charts that highlight schedule variance, workload distribution, and revenue expectations.

📁 Risk & Quality Analysis Section
Focused analysis to monitor risks, quality issues, and cost efficiency.

📁 Innovation Analysis Section
Insights into prototypes, experiments, and innovation-driven revenue potential.

📁 Structured Data Tables
Well-organized tables designed for seamless pivot-table analysis.


🧭 How to Use the Research and Development Dashboard in Excel

📝 Step 1: Enter Your Data
Input R&D budgets, milestones, risks, quality issues, and innovation metrics into the provided tables.

📊 Step 2: Refresh Pivot Tables
Update pivot tables to instantly reflect the latest data across all charts.

🔍 Step 3: Apply Filters & Slicers
Slice data by department, location, product line, or sponsor to explore insights.

📈 Step 4: Analyze & Decide
Use visuals and KPIs to control budgets, improve timelines, and optimize innovation strategy.

🔁 Step 5: Update Regularly
Keep data updated weekly or monthly for accurate performance tracking.


👥 Who Can Benefit from This Research and Development Dashboard in Excel

👨‍🔬 R&D Managers
Track milestones, manage workloads, and monitor innovation output effectively.

💼 Finance & Budget Teams
Control R&D spending, analyze variance, and support financial forecasting.

🏢 Senior Leadership & Executives
Evaluate ROI, reduce risks, and align R&D initiatives with business strategy.

📌 Project Sponsors & Program Heads
Monitor delivery performance, experiments, and expected revenue.

🏭 Organizations of Any Size
From startups to large enterprises, anyone managing R&D portfolios benefits from this dashboard.



 Click here to read the Detailed blog post

 Visit our YouTube channel to learn step-by-step video tutorials

Watch the step-by-step video tutorial:

Frequently asked questions

Which Excel version do I need?
Microsoft Excel 2016 or later on desktop (Microsoft 365 recommended). Many of our formula templates also open in Excel 2013 and Excel for the web - the exact requirement is listed in this product's description.
Does it work on Mac?
Yes. Formula-based Excel templates (no macros) work in Excel for Mac 2016 or later.
Does it work on mobile or Excel Online?
You can view it in the Excel mobile app and Excel for the web, but for entering data, using slicers and refreshing pivots we recommend desktop Excel.
How do I add my own data?
Replace the sample rows on the data sheet with your own (keep the column headers), then click Data > Refresh All so every chart and pivot updates.
Some sheets are protected - how do I edit them or change the logo?
A few of our trackers, data entry systems and dashboards protect sheets so formulas are not overwritten by mistake. Go to Review > Unprotect Sheet - most have no password. If Excel asks for one, message us with your order number and we will share it straight away.
How many records can it handle?
It has been tested with several thousand rows and suits normal small-business volumes. Excel itself handles over 1 million rows.
Is it a one-time payment or a subscription?
One-time payment. No subscription, no per-user fees and nothing to renew - the file is yours to keep.
How do I get the file after payment?
Instantly. The download link appears on screen after checkout, is emailed to you, and stays under My Account > Downloads on our website. If the email does not arrive within a few minutes, check your spam or promotions folder.
Is a user manual included?
Most of our newer products include a PDF user manual in the download. If yours does not have one, message us with your order number and we will send it.
Do I get free updates?
Bug fixes are always free - if something does not work as described, we fix it and send you the corrected file. New versions with new features are not included in the price, unless this product's description says otherwise.
Can you customise it for me?
Yes. Small changes to this template (your columns, categories, logo, colours, minor layout) cost the template price plus $40-80 (Rs 3,000-6,000 + GST), quoted once you send your list. A fully custom build is usually $100-200 (Rs 8,000-18,000 + GST) with two revision rounds. Email your requirements to [email protected] or message us on WhatsApp.
Can I use it for my business or my clients?
Yes, for your own personal or internal business use, for as long as you like. Reselling or redistributing the template is not allowed.
What is your refund policy?
Because these are digital downloads, they are non-refundable once delivered - except when the product does not match its description (report it within 48 hours of purchase) or there is a technical problem our team cannot fix within 72 hours. Email [email protected] with your order number.
How do I get help?
Email [email protected] (Mon-Fri, 10 AM-7 PM IST) or message us on WhatsApp +91 80770 90260 (chat only, no calls). Please include your order number.

Still have a question? Click Need help? at the bottom-left to ask our assistant, or message us on WhatsApp.

Application

MS Excel

Template Type

Dashboard

Price

Paid

Business Or Department

Research and Development

Reviews

There are no reviews yet.

Only logged in customers who have purchased this product may leave a review.

Research and  Development Dashboard in ExcelResearch and Development Dashboard in Excel
Original price was: $19.99.Current price is: $13.99.
- +
Scroll to Top