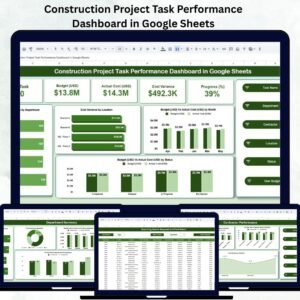
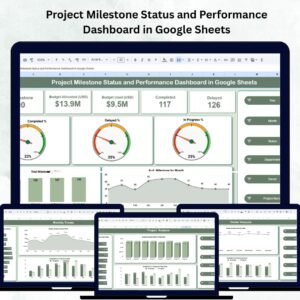
Managing project milestones across departments, owners, and timelines can be complex. The Project Milestone Status and Performance Dashboard in Google Sheets simplifies this process by providing a structured, visual, and data-driven way to track progress, budgets, and performance.
This ready-to-use Google Sheets dashboard helps project managers, coordinators, and teams monitor milestones, identify delays, manage resources, and ensure projects stay on schedule and within budget. With real-time collaboration, automated visuals, and intuitive navigation, this tool transforms raw project data into actionable insights — all without needing complex software.
🔑 Key Features of the Project Milestone Status and Performance Dashboard
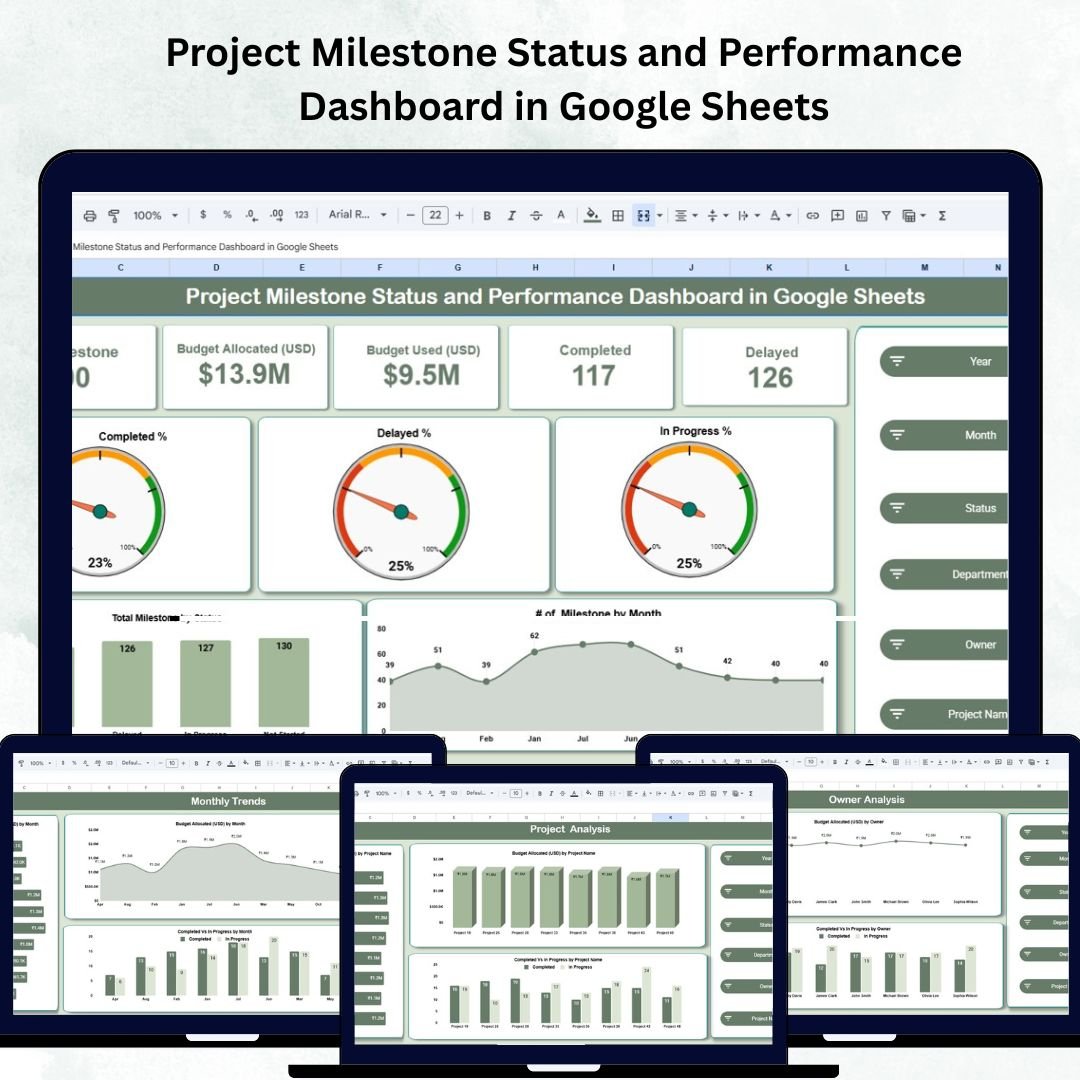
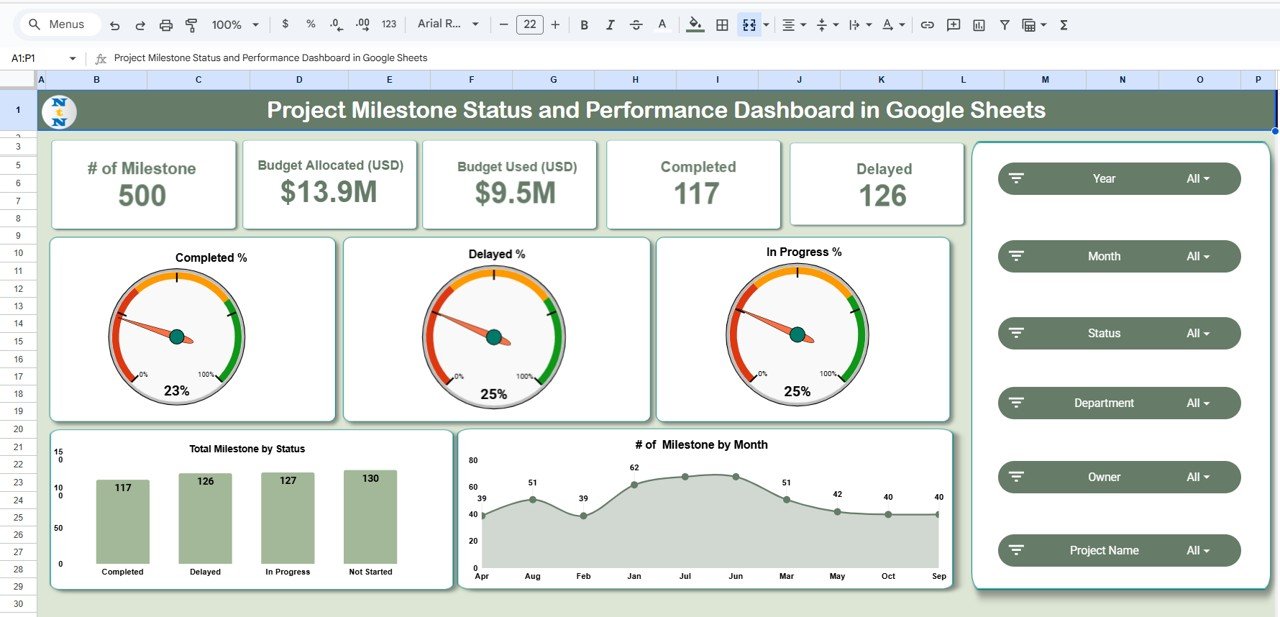
🏠 1. Overview Sheet Tab
The Overview tab provides a high-level summary of all project activities, enabling instant visibility into performance and bottlenecks.
Cards Section Includes:
-
📌 # of Milestones – Total milestones tracked across projects.
-
💰 Budget Allocated (USD) – Total approved budget.
-
💵 Budget Used (USD) – Actual expenditure to date.
-
✅ Completed – Number of milestones achieved.
-
⏰ Delayed – Milestones behind schedule.
Charts Section:
-
📊 Completed % / Delayed % / In Progress % – A visual distribution of project status.
-
📈 Total Milestones by Status – Bar chart comparing ongoing, completed, and delayed tasks.
-
📅 # of Milestones by Month – Trendline showing monthly milestone completion rates.
This section delivers an instant overview of performance health across all active projects.
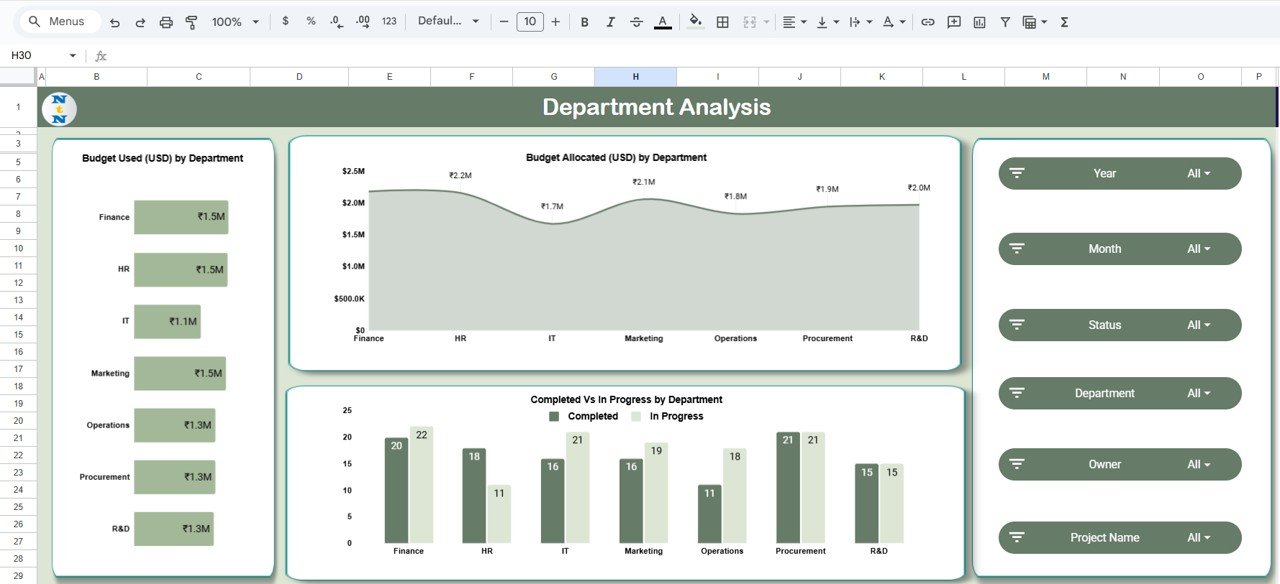
🏢 2. Department Analysis Sheet
Get department-level performance insights with financial and completion metrics.
Charts Include:
-
💰 Budget Used vs. Budget Allocated by Department – Analyze spending efficiency.
-
📈 Completed vs. In Progress by Department – Track team productivity and milestone achievement rates.
Perfect for department heads and leadership teams who need performance transparency at a glance.
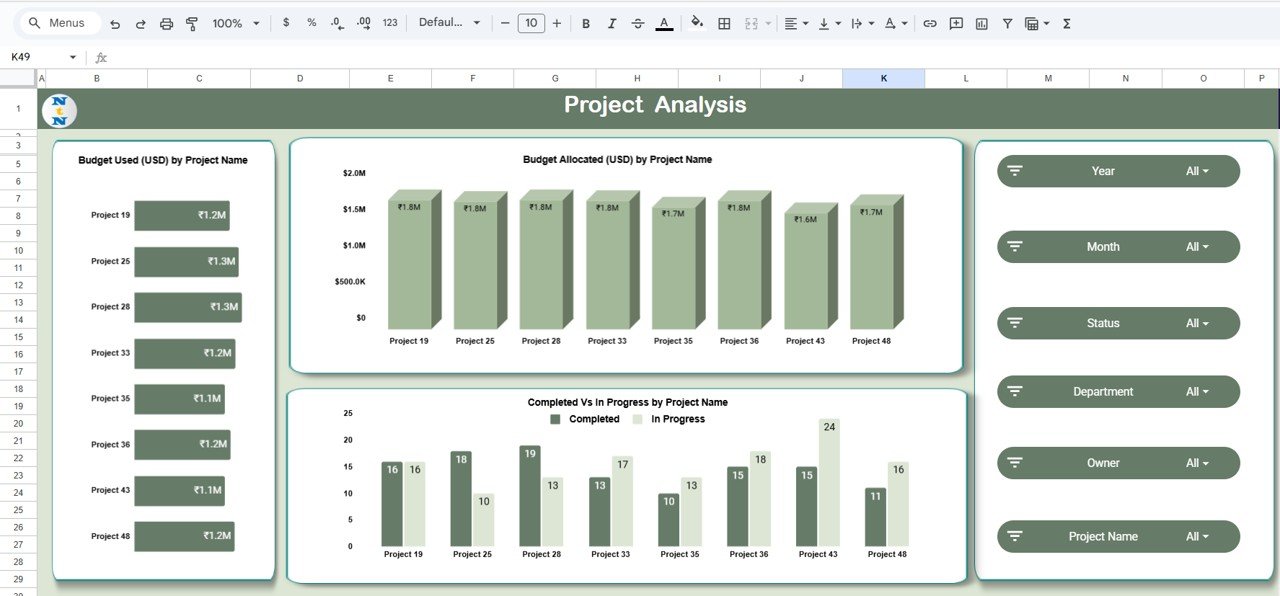
🧩 3. Project Analysis Sheet
Dive deeper into project-level metrics and progress comparisons.
Charts Include:
-
💵 Budget Used vs. Budget Allocated by Project – Monitor cost efficiency.
-
✅ Completed vs. In Progress by Project – Identify delays or underperforming projects.
This section helps project managers assess project health and reallocate resources strategically.
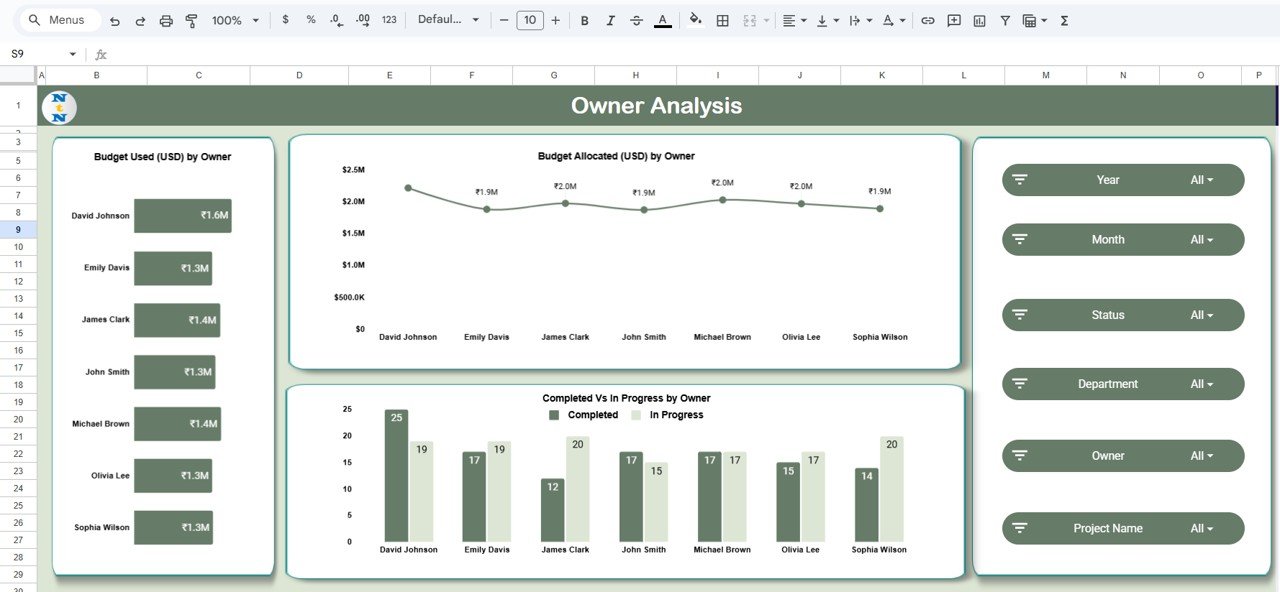
👥 4. Owner Analysis Sheet
Evaluate project owners and their performance across milestones.
Charts Include:
-
👨💼 Budget Used vs. Allocated by Owner – Visualize financial accountability.
-
🧭 Completed vs. In Progress by Owner – Compare owners’ efficiency and delivery rates.
This encourages ownership, accountability, and fair workload distribution among managers.
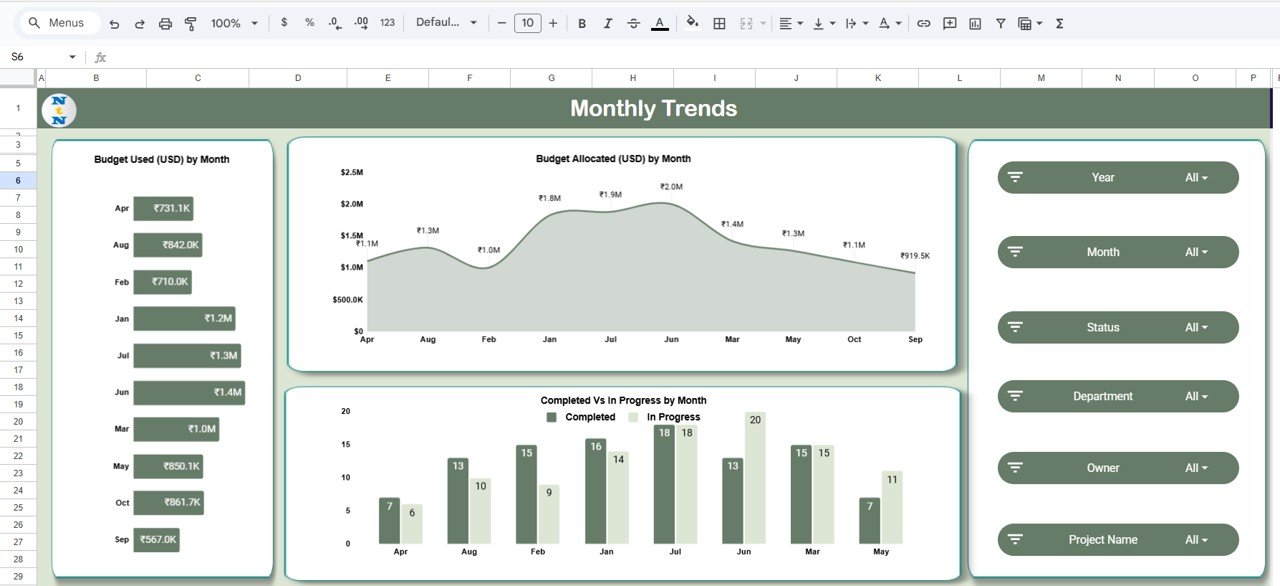
📆 5. Monthly Trends Sheet
Track performance and budget progression month by month.
Charts Include:
-
📅 Budget Used and Allocated by Month – Understand spending trends.
-
📈 Completed vs. In Progress by Month – Identify peak or slow delivery periods.
Use this view for long-term trend analysis and proactive resource planning.
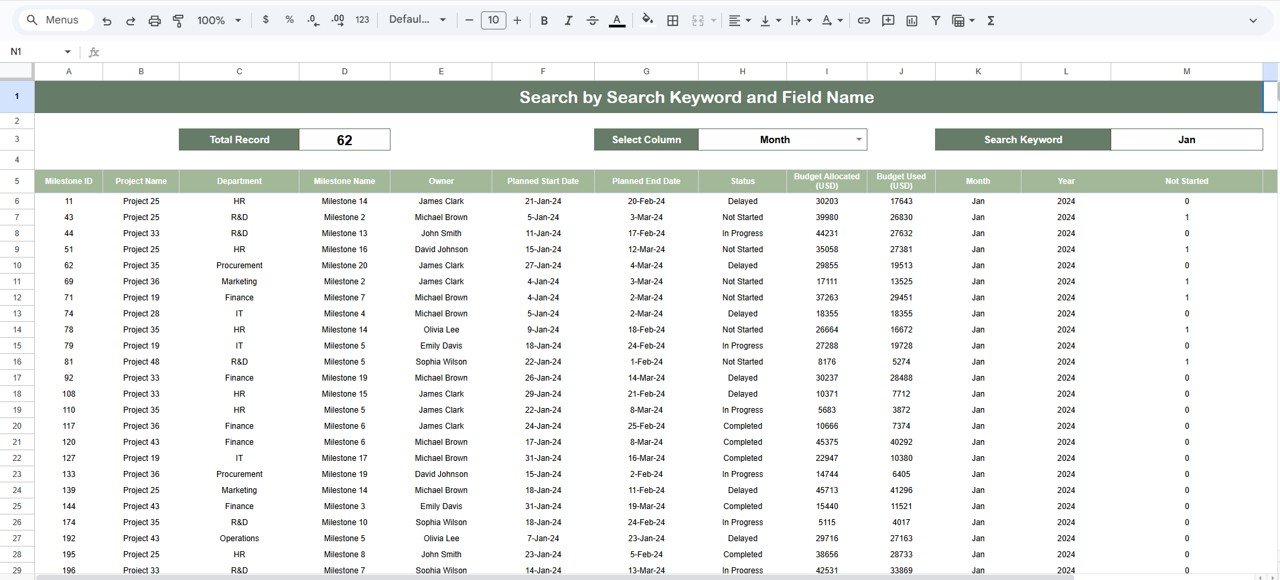
🔍 6. Search Function
Quickly find specific information within the dashboard.
-
Search by Keyword (e.g., project name, department).
-
Filter by Field Name (e.g., owner, status).
This feature eliminates manual searching, helping teams access information in seconds.
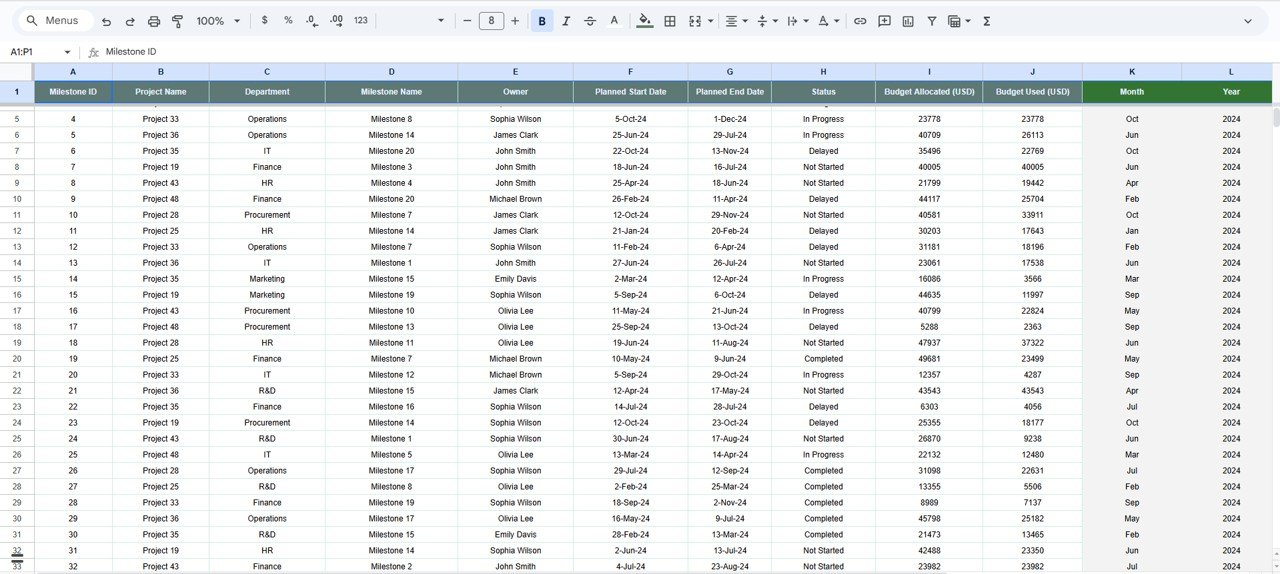
🧾 7. Data Sheet Tab
The heart of the dashboard — this sheet powers all visuals automatically.
Columns Include:
-
Milestone ID
-
Project Name
-
Department
-
Owner
-
Budget Allocated / Used (USD)
-
Status (Completed, In Progress, Delayed)
-
Month / Year
Updating this data instantly refreshes every chart and summary in the dashboard.
🌟 Advantages of Using the Dashboard
-
📊 Centralized Tracking: Monitor milestones, budgets, and performance in one place.
-
⏱️ Real-Time Collaboration: Google Sheets enables simultaneous access for all team members.
-
💡 Actionable Insights: Instantly identify delays or cost overruns with color-coded visuals.
-
🧭 Enhanced Accountability: Assign project owners to improve transparency and responsibility.
-
⚙️ Time Savings: Automates manual reporting and data consolidation.
-
🧮 Customizable: Add KPIs, modify layouts, or adjust visuals to fit your business needs.
💡 Best Practices for Using the Dashboard
✅ Update Regularly: Keep milestone and financial data current for accurate reporting.
✅ Set Milestone Definitions: Define clear criteria for “Completed,” “Delayed,” and “In Progress.”
✅ Review Monthly: Use the Monthly Trends sheet to identify recurring challenges.
✅ Track Departmental Performance: Focus improvement efforts where delays are common.
✅ Encourage Accountability: Review the Owner Analysis sheet to promote transparency.
✅ Customize Visuals: Adapt the charts to your organization’s reporting preferences.
👨💼 Who Can Use This Dashboard
🏗️ Project Managers: Monitor progress and budgets in real time.
📋 Department Heads: Track team efficiency and workload balance.
💼 Executives: Access key metrics instantly for performance reviews.
👥 PMOs: Oversee multiple projects with unified, automated reporting.
🚀 How This Dashboard Helps Project Teams
-
Enhances visibility into progress, costs, and timelines.
-
Improves decision-making with actionable, visual analytics.
-
Increases efficiency by automating performance reporting.
-
Fosters accountability across teams and departments.
-
Strengthens collaboration through cloud-based access.
🔗 Click here to read the detailed blog post
Watch the step-by-step video Demo:


Reviews
There are no reviews yet.