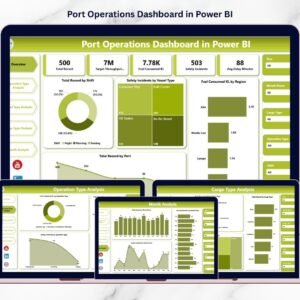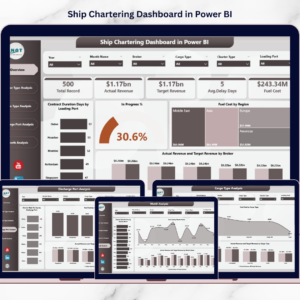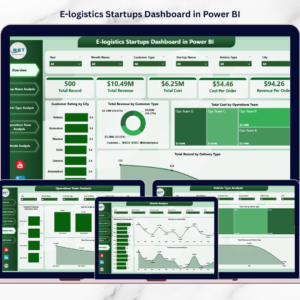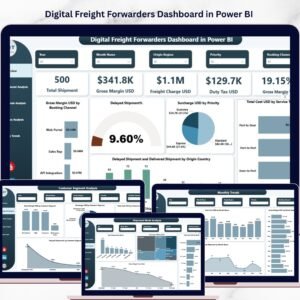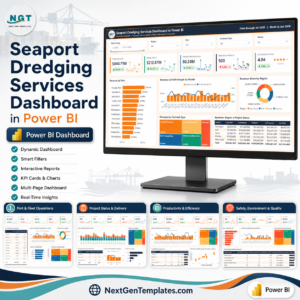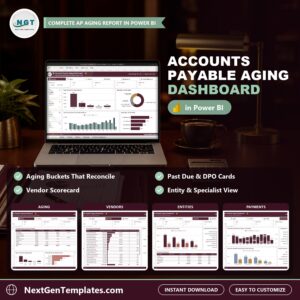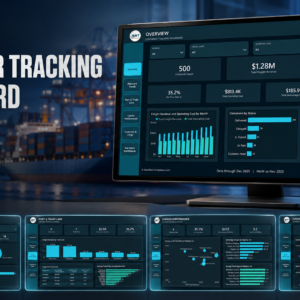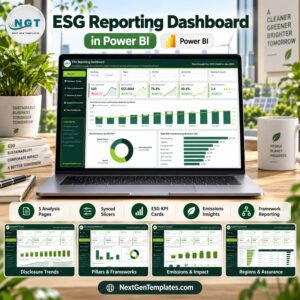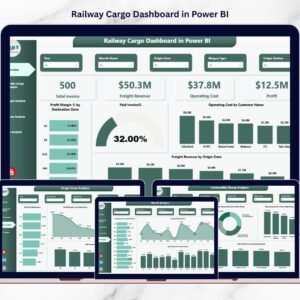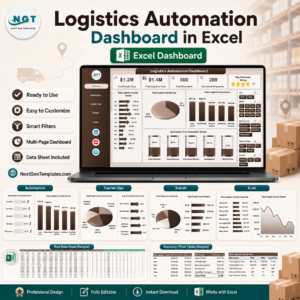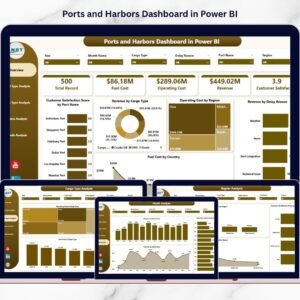

That is why we created the Ports and Harbors Dashboard in Power BI — a powerful, ready-to-use dashboard that transforms maritime data into actionable insights.
This interactive Power BI file helps you monitor revenue, operating cost, fuel expenses, cargo performance, delay reasons, and customer satisfaction — all in one centralized control center.
If you want clarity, control, and faster decision-making, this dashboard is built for you.
🚀 Key Feature of Ports and Harbors Dashboard in Power BI
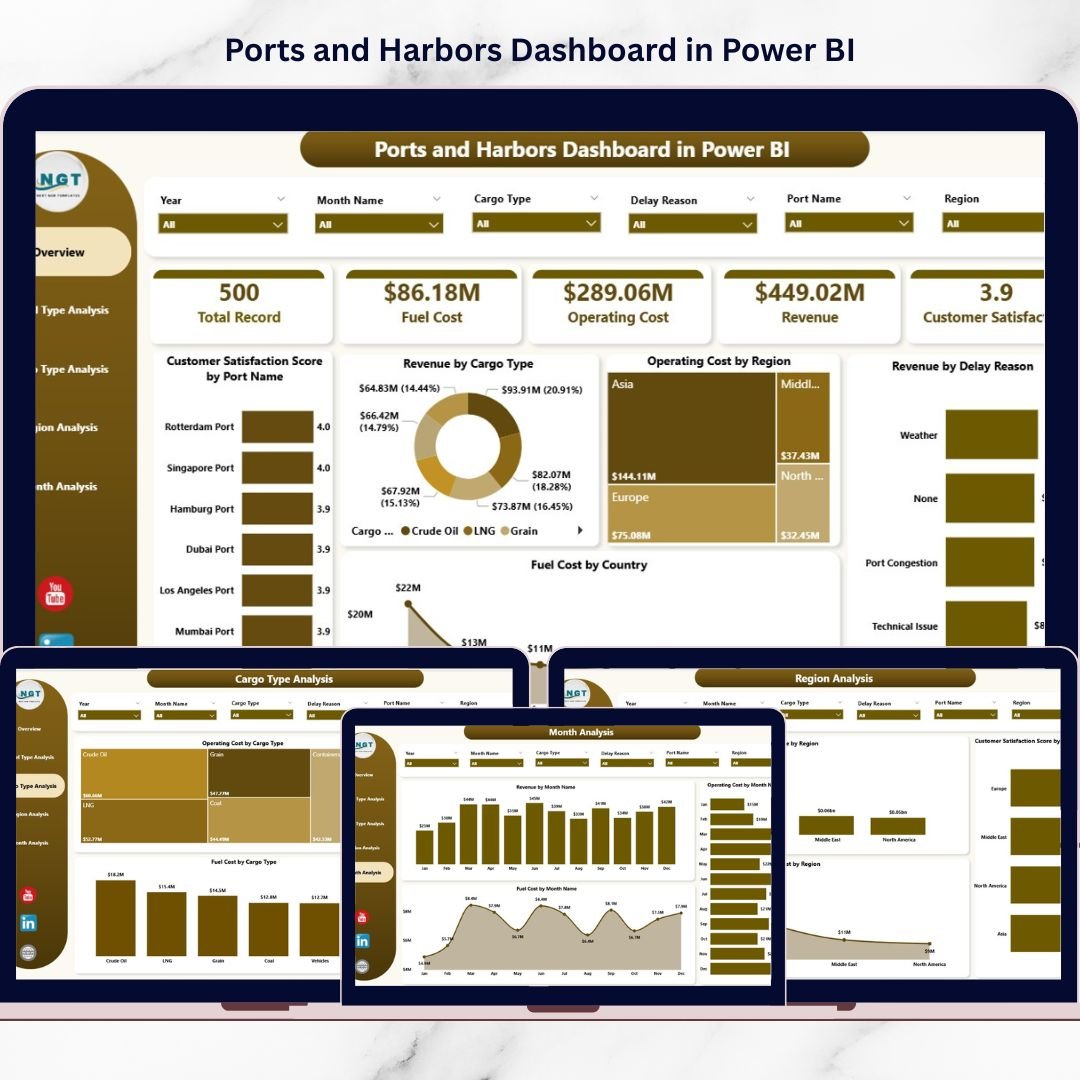
This dashboard includes 5 fully structured analytical pages, each designed to monitor a specific operational dimension.
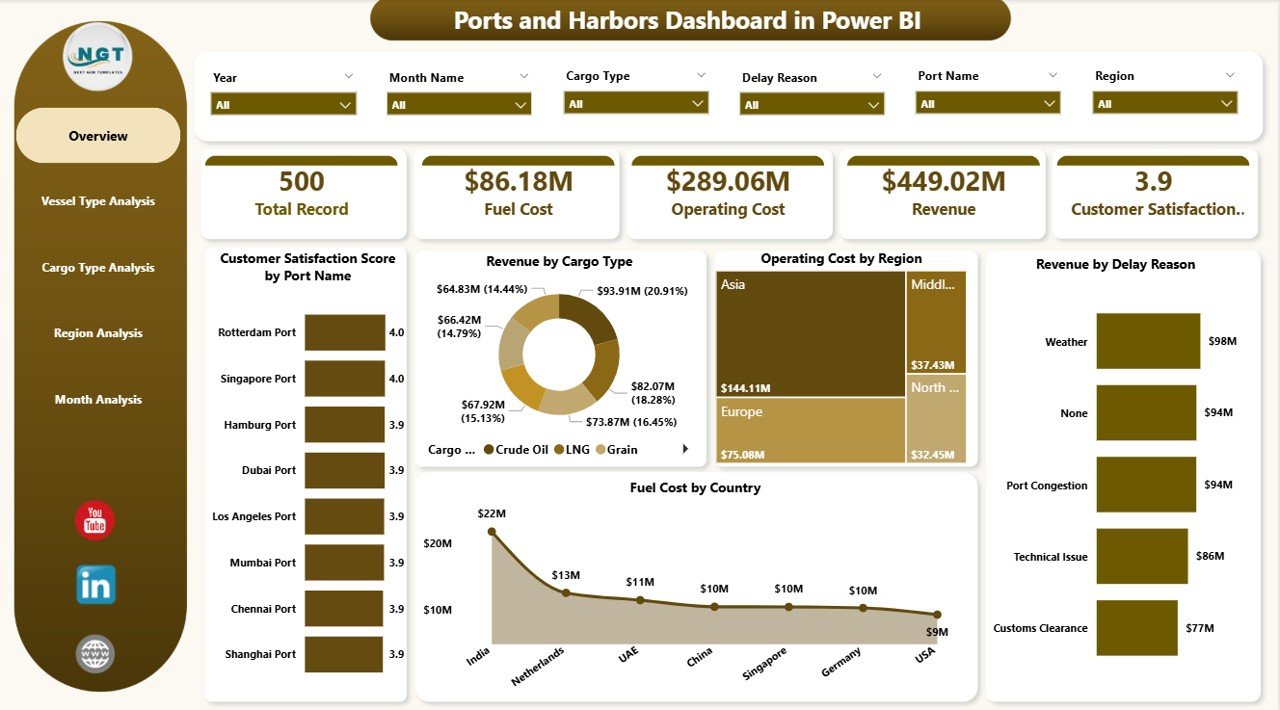
📊 Overview Page – Executive snapshot with revenue, cost, fuel, delay, and satisfaction insights.
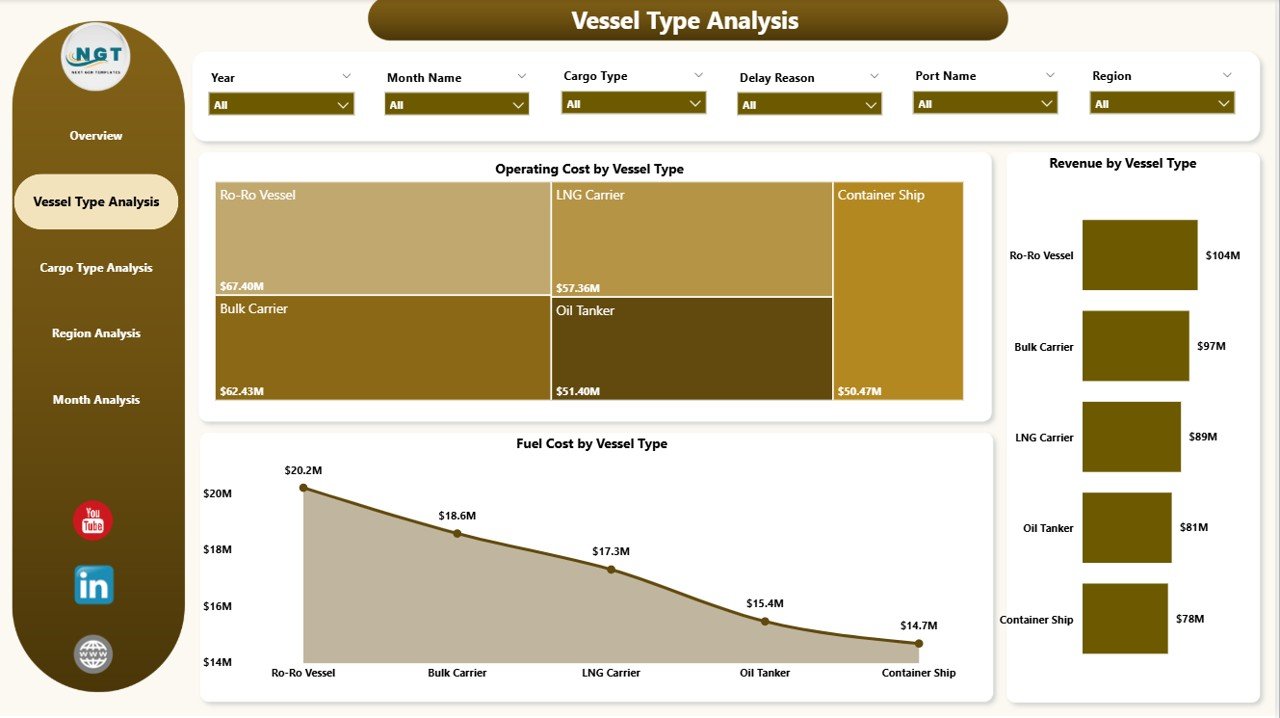
🚢 Vessel Type Analysis – Compare revenue, operating cost, and fuel consumption by vessel category.
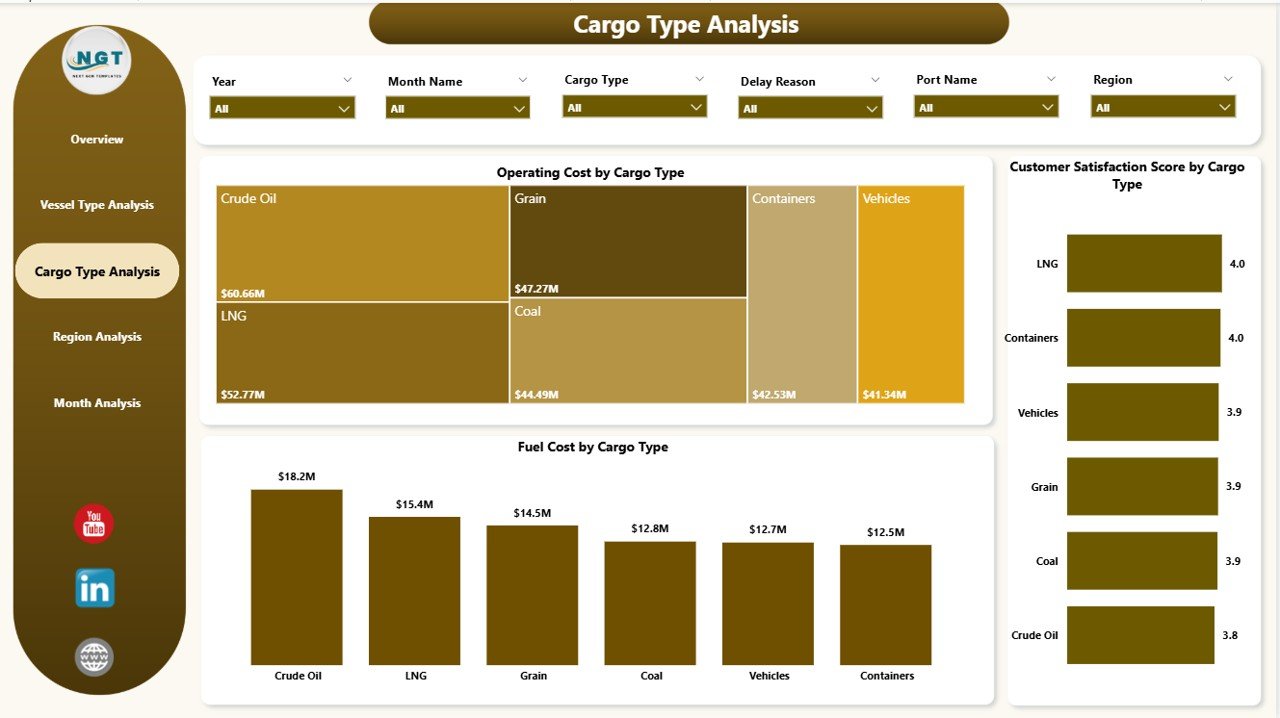
📦 Cargo Type Analysis – Evaluate profitability, cost impact, and satisfaction by cargo type.
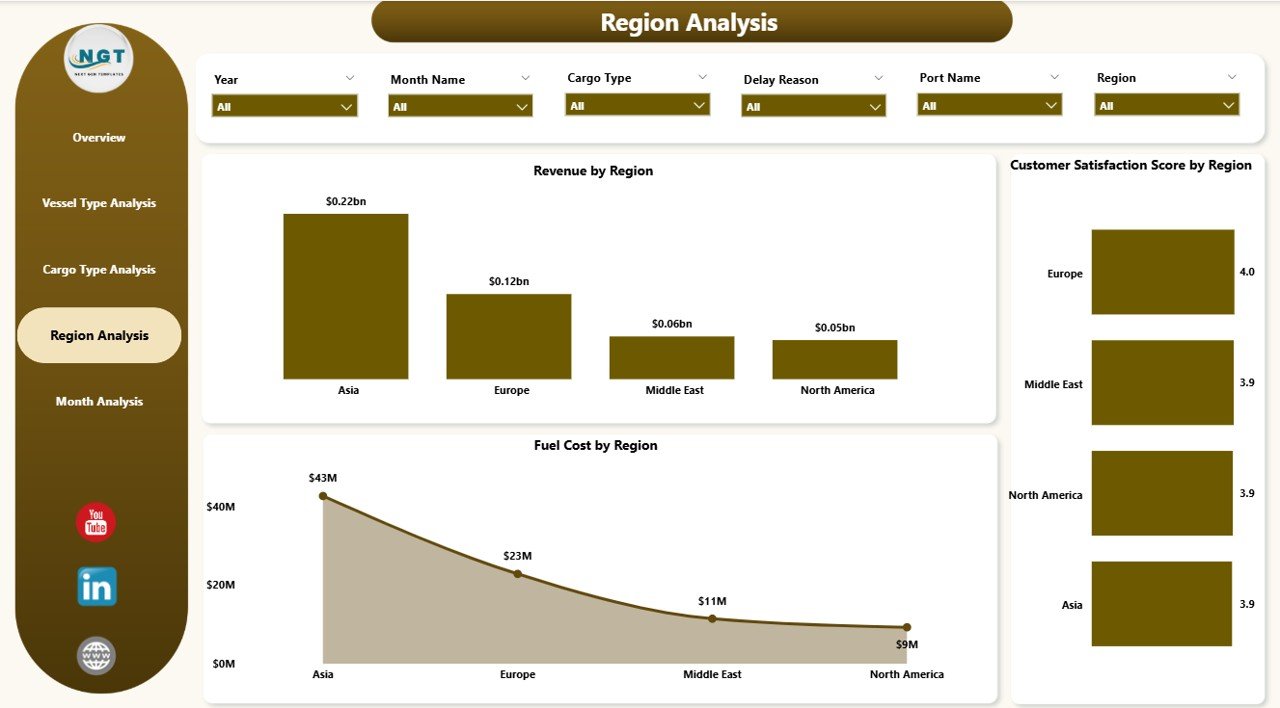
🌍 Region Analysis – Analyze revenue and cost performance across regions.
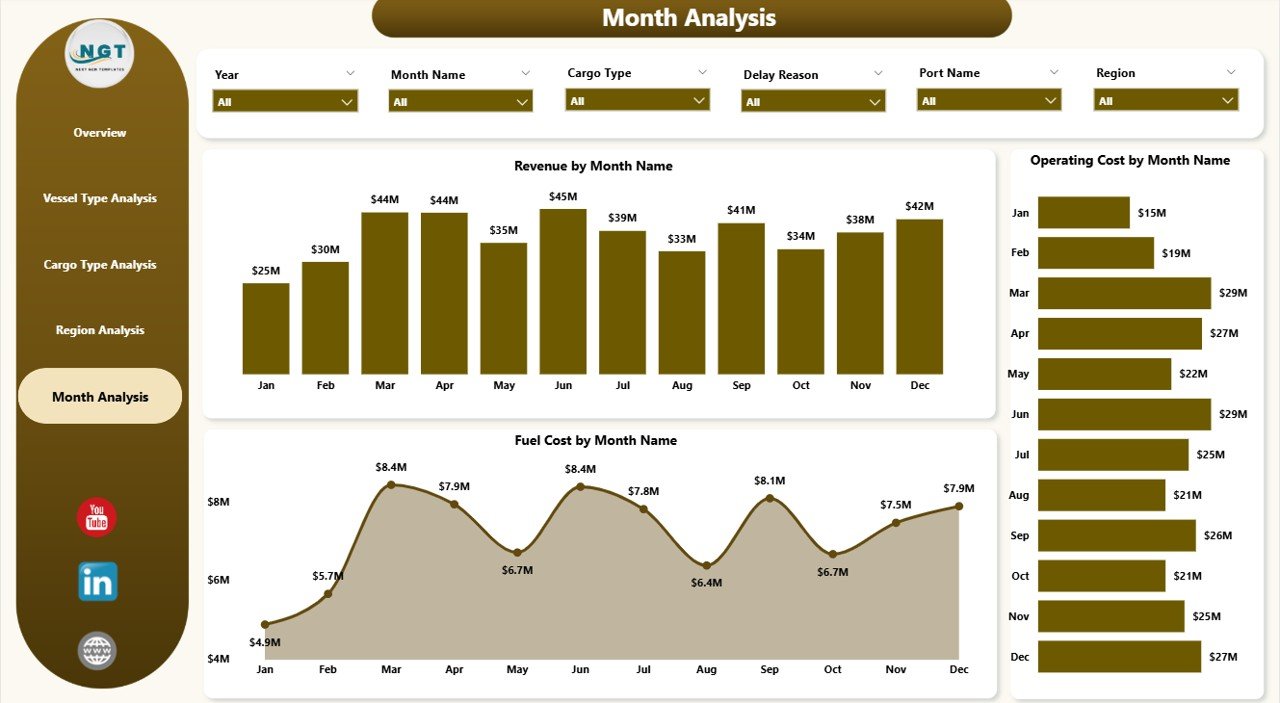
📅 Month Analysis – Track fuel, revenue, and cost trends over time.
✨ Advanced Power BI capabilities include:
Interactive slicers (Region, Vessel Type, Cargo Type, Month)
Dynamic filtering
Drill-down analysis
Clean KPI visuals
Automated data refresh
Because everything updates instantly, you move from reactive reporting to proactive management.
📦 What’s Inside the Ports and Harbors Dashboard in Power BI
This ready-to-use Power BI file provides:
✔ 5 Professional Dashboard Pages
✔ Revenue tracking by Cargo Type
✔ Operating Cost monitoring by Region
✔ Fuel Cost analysis by Country
✔ Revenue by Delay Reason insights
✔ Customer Satisfaction Score by Port
✔ Vessel-level cost breakdown
✔ Monthly trend visualization
✔ Interactive filtering system
You simply connect your operational data and refresh. The dashboard handles the analytics.
🛠 How to Use the Ports and Harbors Dashboard in Power BI
Using this dashboard is simple:
1️⃣ Import or connect your maritime operational data.
2️⃣ Refresh the Power BI model.
3️⃣ Use slicers to filter by region, vessel type, cargo type, or month.
4️⃣ Review revenue vs cost trends instantly.
5️⃣ Identify fuel spikes and delay-related revenue impact.
For example:
If operating cost increases in a specific region, you can investigate resource allocation.
If fuel cost spikes for certain vessel types, you can adjust contracts.
If delay reasons reduce revenue, you can optimize operational workflows.
Because insights are visual and interactive, decisions become faster and more accurate.
👥 Who Can Benefit from This Ports and Harbors Dashboard in Power BI
This dashboard is ideal for:
⚓ Port Authorities
🚢 Maritime Logistics Companies
📦 Shipping Line Operators
💼 Port Finance Teams
📊 Operations Managers
📈 Strategy & Planning Teams
Whether you manage a single harbor or multiple global ports, this dashboard improves:
✔ Cost transparency
✔ Revenue monitoring
✔ Fuel expense control
✔ Customer satisfaction tracking
✔ Regional performance analysis
When maritime data becomes centralized and interactive, performance improves naturally.
💰 How This Dashboard Increases Profitability
Profitability depends on cost control and operational efficiency.
This dashboard helps you:
Identify high-revenue cargo types
Reduce fuel waste
Detect delay-related revenue losses
Compare regional performance
Track monthly trends
Instead of reacting after losses occur, you prevent them early.
And prevention drives profitability.
Click hare to read the Detailed blog post
Visit our YouTube channel to learn step-by-step video tutorials
Watch the step-by-step video tutorial:
Compatibility and Requirements
- Works in Power BI Desktop, which is free to download from Microsoft.
- You connect your own maritime operational data and refresh the model. Microsoft explains the install in Get Power BI Desktop.
- Slicers for Region, Vessel Type, Cargo Type and Month filter the report pages.
Frequently Asked Questions
How many pages does the dashboard have?
Five pages: Overview, Vessel Type Analysis, Cargo Type Analysis, Region Analysis and Month Analysis.
Which filters can I use?
Slicers for Region, Vessel Type, Cargo Type and Month. The visuals also support drill-down and dynamic filtering.
What does the dashboard track?
Revenue by cargo type, operating cost by region, fuel cost by country, revenue by delay reason, customer satisfaction score by port, vessel-level cost and monthly trends.
How do I use my own data?
Connect your maritime operational data and refresh the Power BI model. The visuals update from the refreshed data.
Is there an Excel or other Power BI version for logistics?
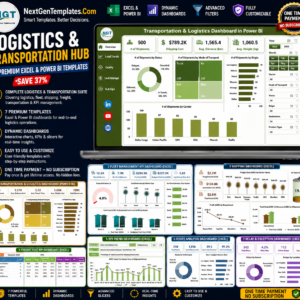
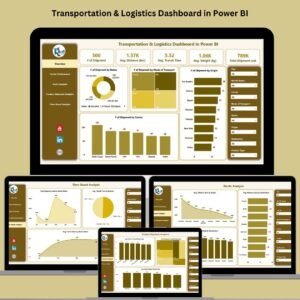
Yes. See the Transportation & Logistics Dashboard in Power BI and the Transportation & Logistics Dashboard in Excel.
Related Logistics and Reporting Templates
- Transportation & Logistics Dashboard in Power BI: another Power BI dashboard for logistics operations
- Transportation & Logistics Dashboard in Excel: the same topic in Excel
- Supply Chain Report in Excel: a supply chain view for operations teams
- Logistics and Transportation Hub: a bundle of 7 logistics templates in Excel and Power BI
Browse all Power BI dashboards.