
Managing a pharmacy efficiently requires constant tracking of performance metrics such as sales, prescriptions, inventory, and customer satisfaction. The Pharmacy KPI Dashboard in Google Sheets is a ready-to-use, interactive dashboard that helps pharmacy managers and owners monitor key performance indicators (KPIs), analyze trends, and make data-driven decisions for better profitability and service delivery.
This easy-to-customize template combines the power of Google Sheets with visual analytics to help you compare Month-to-Date (MTD) and Year-to-Date (YTD) results, track progress against targets, and identify operational bottlenecks — all in one place.
Whether you manage a single pharmacy or multiple branches, this dashboard ensures complete visibility into your performance metrics. 🚀

🔑 Key Features of the Pharmacy KPI Dashboard in Google Sheets
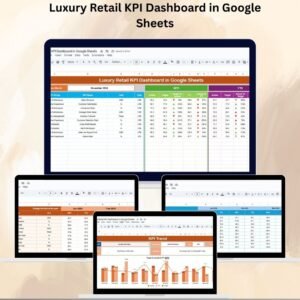
📊 Dashboard Sheet Tab
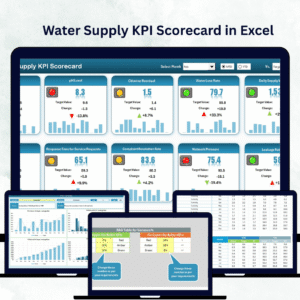
The main dashboard provides a snapshot of overall pharmacy performance through KPI cards and visual indicators.
Highlights Include:
-
Month Selection Dropdown (Range D3): Dynamically updates data for the selected month
-
MTD Metrics: Compare Actual vs. Target vs. Previous Year data with color-coded arrows
-
YTD Metrics: Evaluate year-to-date performance for a broader perspective
-
Visual Indicators: Quickly identify underperforming KPIs with traffic lights and arrows
This view enables real-time decision-making with a single glance.
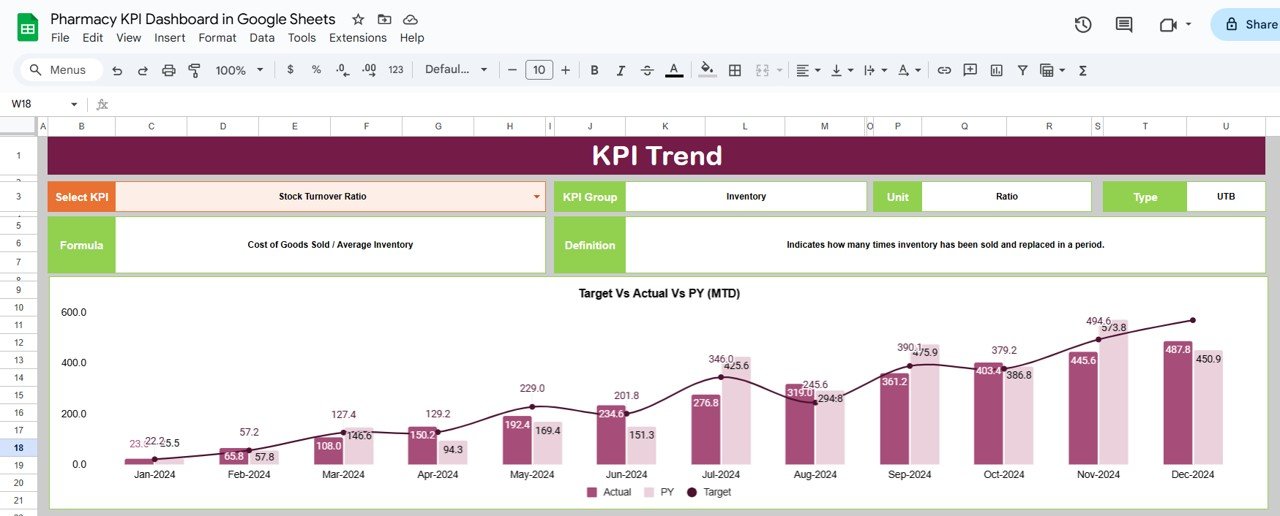
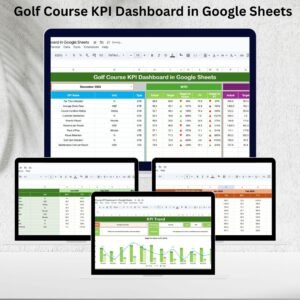
📈 KPI Trend Sheet Tab
Dive deeper into individual KPI analysis with trend visuals and detailed breakdowns:
-
Select KPI from a dropdown (Range C3)
-
View KPI Group, Unit, and Type (UTB or LTB)
-
Analyze trends over months and compare progress
This helps pinpoint areas for improvement and optimize pharmacy operations.
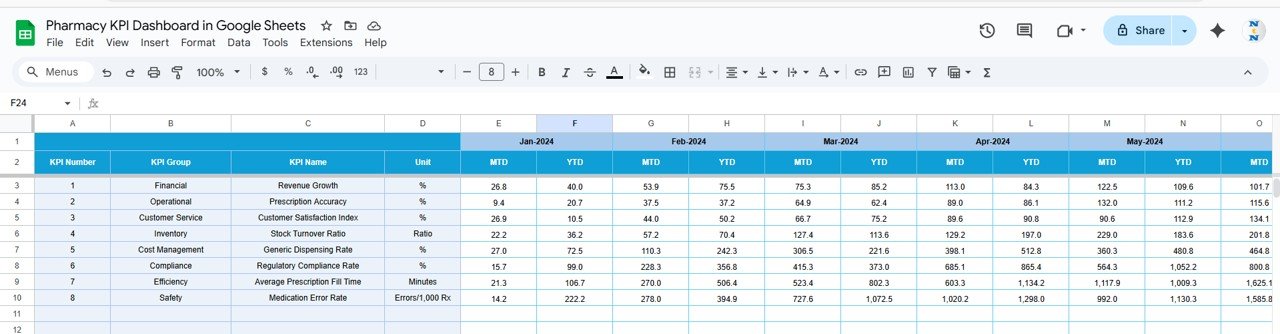
🧾 Actual Numbers Sheet Tab
Record all actual performance data for each month:
-
Input MTD and YTD figures
-
Change the first month of the year (Range E1) for flexible reporting
Accurate entries here keep your dashboard current and insightful.
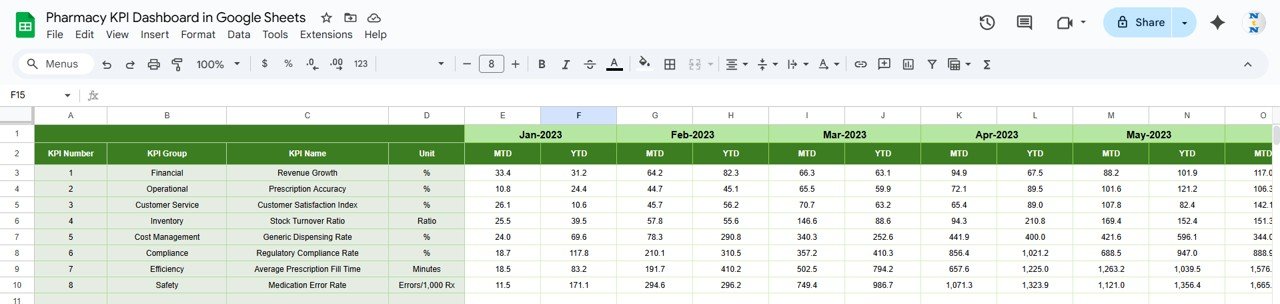
🎯 Target Sheet Tab
Define performance goals for each KPI:
-
Input MTD and YTD targets
-
Compare against actual results
This allows managers to stay aligned with business objectives and improve accountability.
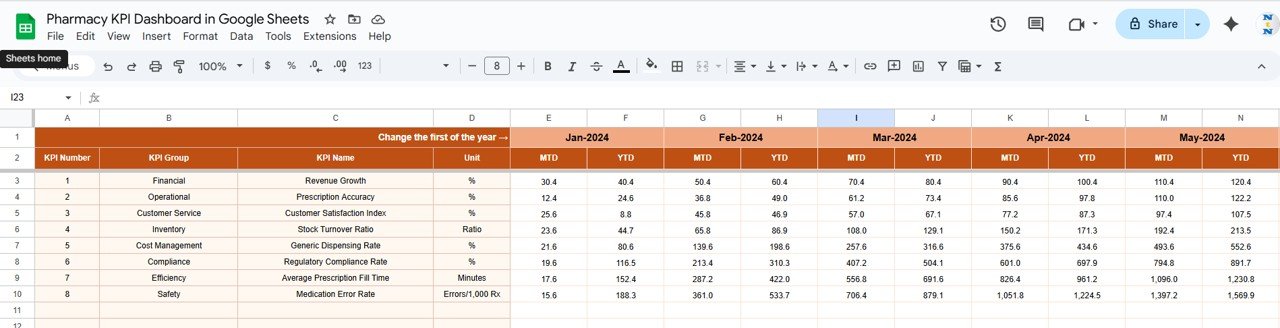
📅 Previous Year Numbers Sheet Tab
Input last year’s metrics for year-over-year comparison.
Identify seasonal patterns, track improvement, and evaluate progress over time.
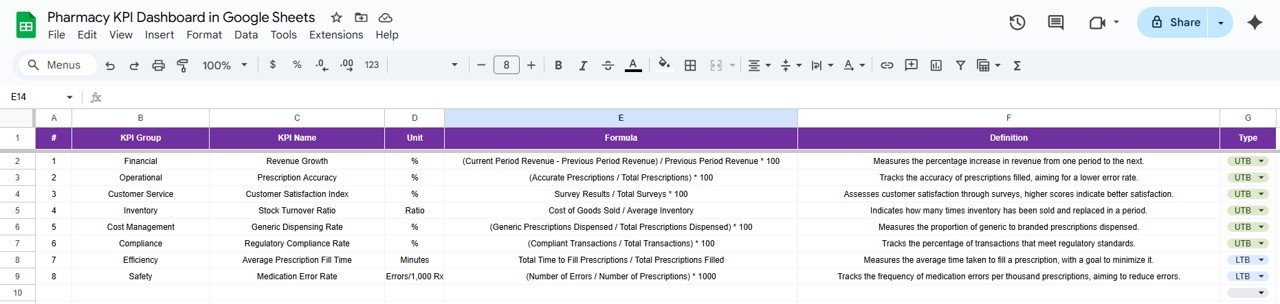
📘 KPI Definition Sheet Tab
Maintain clarity and consistency with detailed KPI definitions:
-
KPI Name, Group, Unit, Formula, and Definition
-
Specify KPI Type (Lower-the-Better or Upper-the-Better)
This sheet acts as your reference guide for all performance metrics.
🌟 Advantages of Using the Pharmacy KPI Dashboard
✅ Centralized Performance Data: Track all operational KPIs in one place
📈 Real-Time Insights: Get instant updates with every new data entry
💊 Optimized Operations: Improve inventory turnover, reduce stockouts, and boost service quality
📅 MTD & YTD Comparison: Evaluate monthly and annual progress simultaneously
🧠 Data-Driven Decisions: Empower managers to act proactively, not reactively
🧾 Customizable Design: Easily add new KPIs or modify formulas to fit your needs
👥 Collaboration Ready: Google Sheets enables multi-user editing for large pharmacy teams
🧠 Best Practices for Using the Dashboard
-
Update Regularly: Input MTD and YTD figures as soon as data is available
-
Segment KPIs: Track separately for sales, inventory, and customer satisfaction
-
Monitor Trends: Review previous year comparisons to identify recurring challenges
-
Use Conditional Formatting: Leverage arrows and colors to highlight performance shifts
-
Set Clear Targets: Define realistic yet ambitious goals for every metric
-
Review Monthly: Present dashboard summaries in management reviews
💼 How This Dashboard Helps Pharmacy Managers
💊 Streamline Inventory Management: Track stockouts, turnover rates, and expired stock to reduce losses
🧾 Boost Profitability: Identify trends in sales and prescription volumes
👥 Enhance Customer Satisfaction: Monitor service times and patient feedback
📦 Improve Compliance: Maintain accurate performance records
📊 Enable Smarter Decisions: Visualize performance in real time to support data-backed strategies
With this Google Sheets dashboard, you’ll transform your pharmacy’s raw data into actionable intelligence for growth, efficiency, and service excellence. 🌟


Reviews
There are no reviews yet.